Business
Where Are the Oldest Companies in Existence?
View the full-size version of this infographic.
Where Are the Oldest Companies in Existence?
View the high resolution version of this infographic by clicking here.
In just a few decades, it’s possible that some of today’s most recognized companies may no longer be household names.
Corporate longevity, or the average lifespan of a company, has been shrinking dramatically.
In the 1960s, a typical S&P 500 company was projected to last for more than 60 years. However, with the rapidly transforming business landscape today, it’s down to just 18 years.
The Companies With the Strongest Staying Power
Even with companies skewing younger, there are always exceptions to the rule.
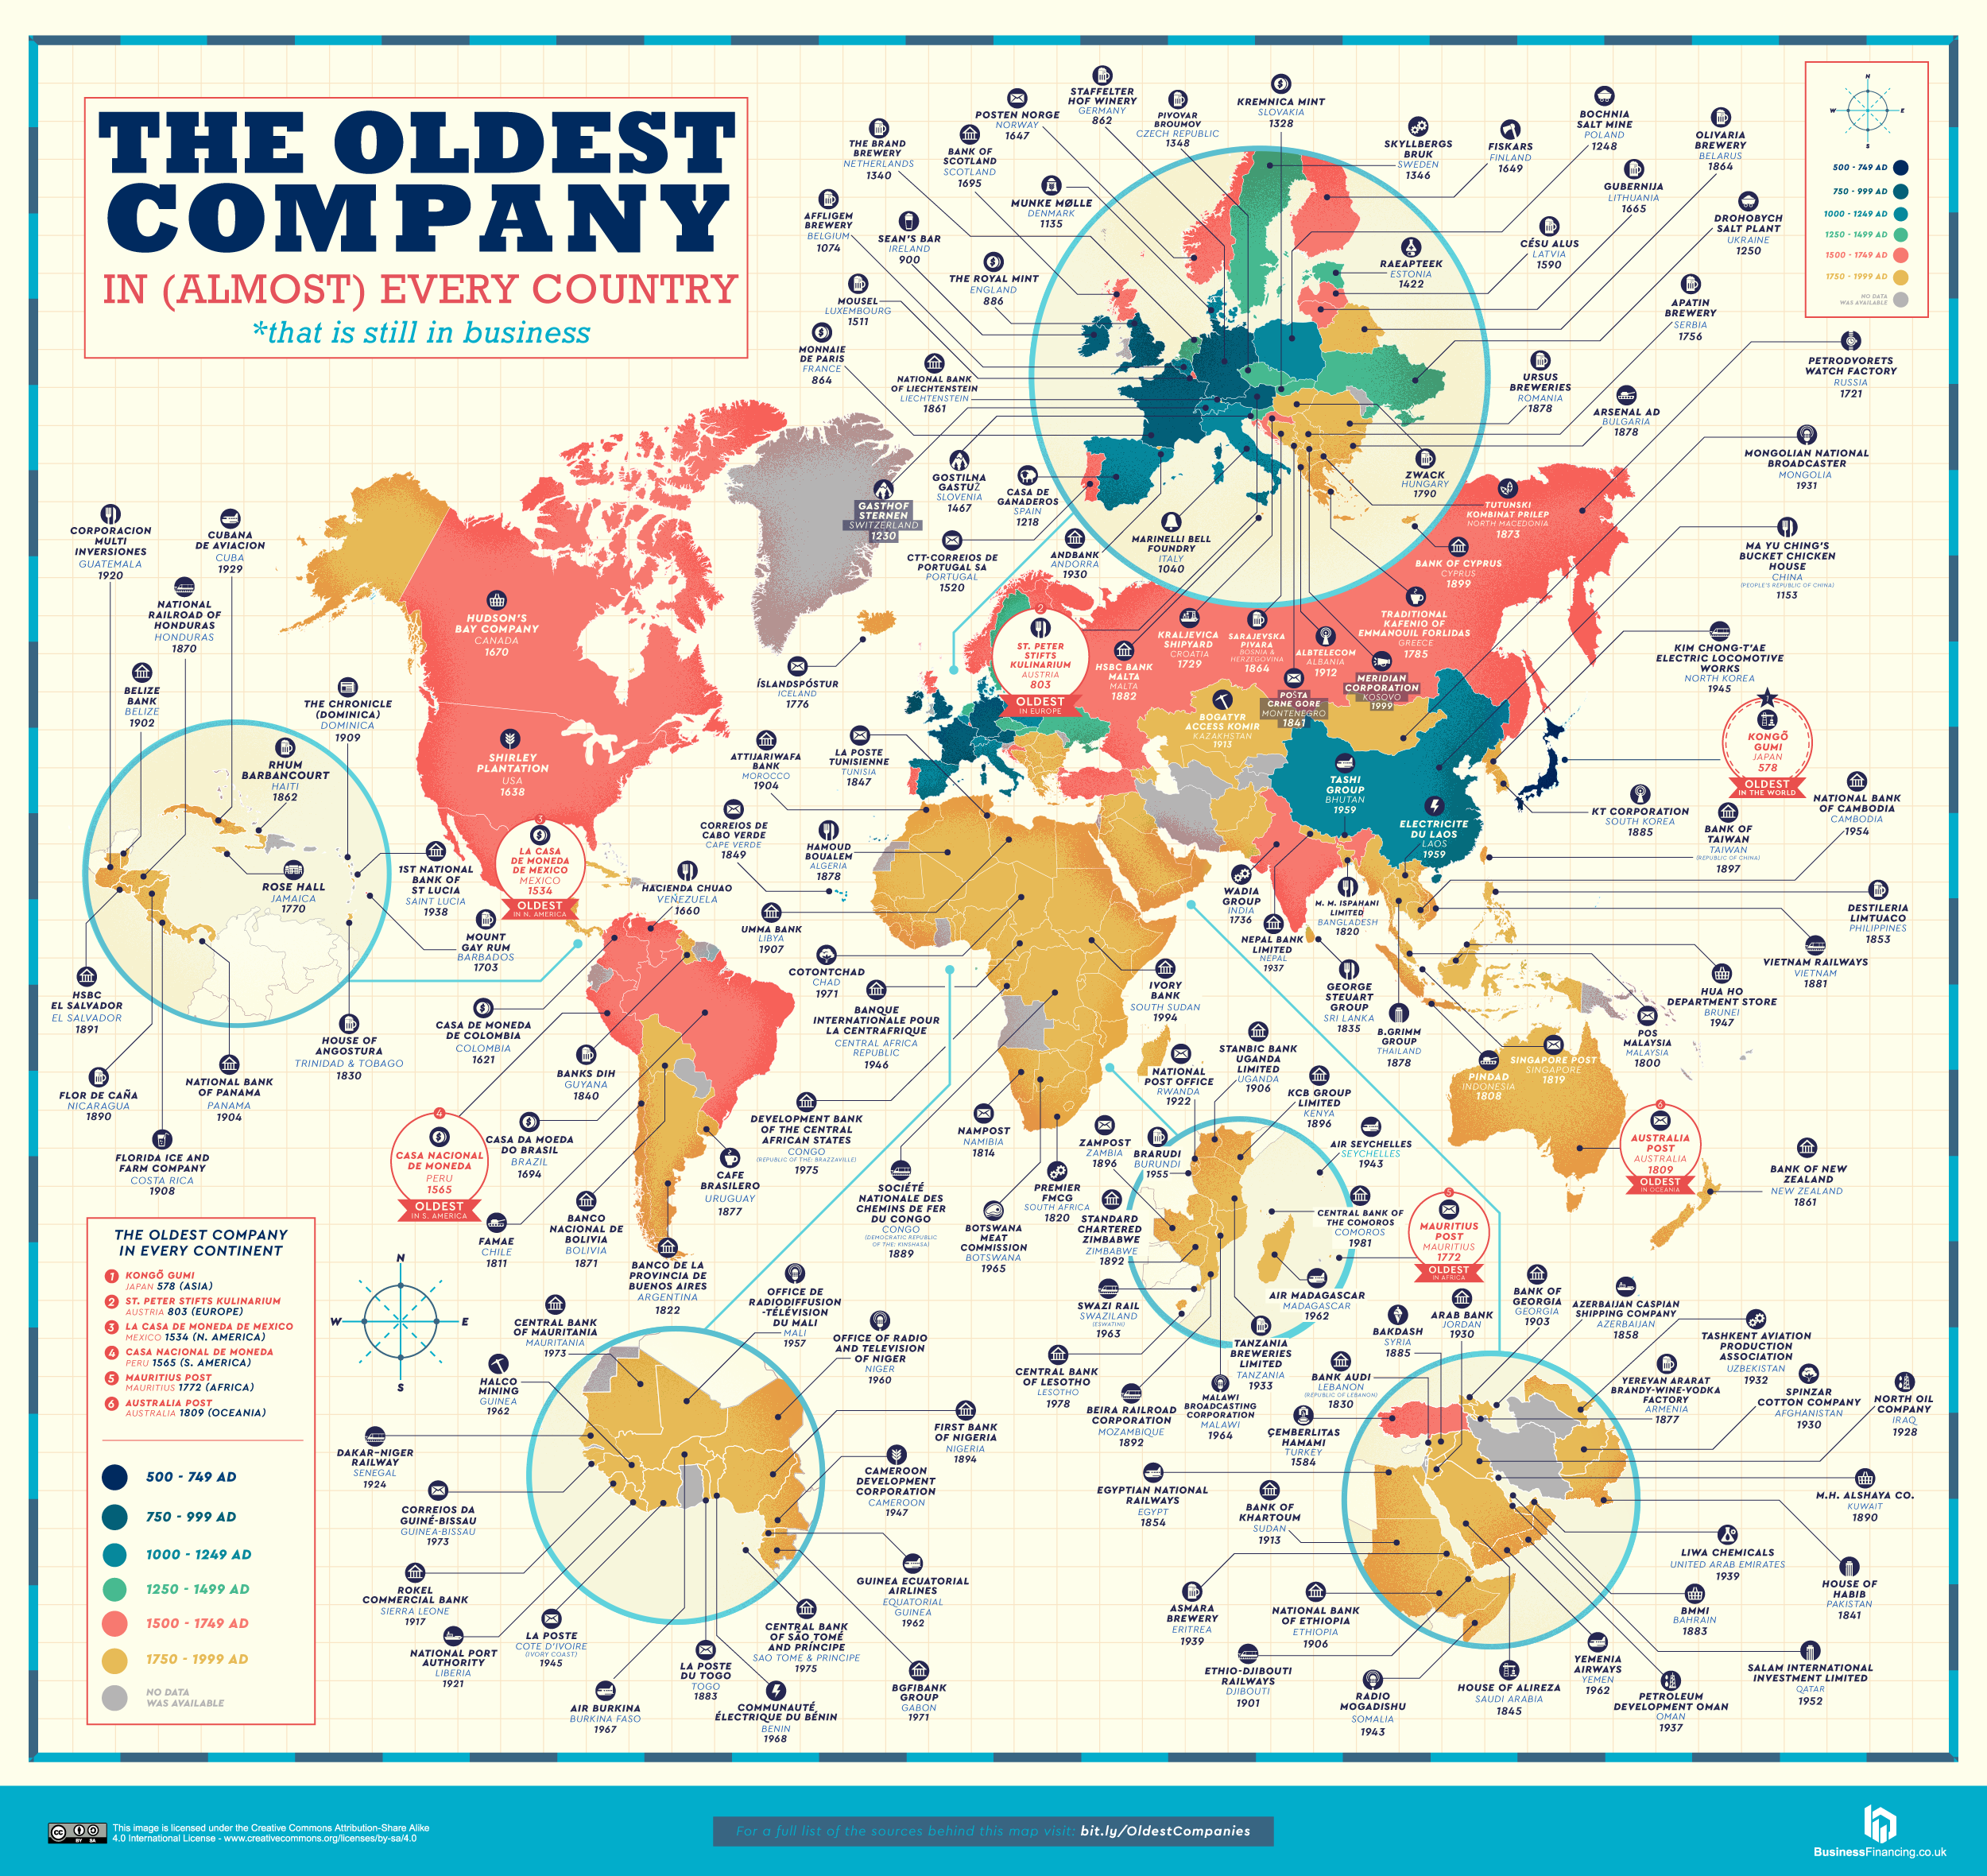
Luckily, many companies around the world have stood the test of time, and today’s detailed map from Business Financing highlights the oldest company in existence in each country.
For centuries, here are the world’s oldest corporations which have made their mark:
Year | Company Name | Country | Industry |
---|---|---|---|
578 | Kongō Gumi Co., Ltd. | Japan | Construction |
803 | St. Peter Stifts Kulinarium | Austria | Service Industry (Restaurant) |
862 | Staffelter Hof | Germany | Distillers, Vintners, & Breweries (Winery) |
864 | Monnaie de Paris | France | Manufacturing & Production (Mint) |
886 | The Royal Mint | England | Manufacturing & Production (Mint) |
900 | Sean’s Bar | Ireland | Service Industry (Pub) |
1040 | Pontificia Fonderia Marinelli | Italy | Manufacturing & Production (Bell foundry) |
1074 | Affligem Brewery | Belgium | Distillers, Vintners, & Breweries |
1135 | Munke Mølle | Denmark | Manufacturing & Production (Flour Mill) |
1153 | Ma Yu Ching’s Bucket Chicken House | China | Service Industry (Restaurant) |
Whether they were born out of necessity to support a rapidly growing population—requiring new infrastructure and more money circulation—or simply to satisfy peoples’ thirst for alcohol or hunger for fried chicken, these companies continue to play a lasting role.
The Oldest Company in Every Country, by Region
Let’s dive into the regional maps, which paint a different picture for each continent.
In the following maps, countries are color-coded based on the major industry that the oldest company falls under:
- Primary: Natural resources
- Secondary: Manufacturing and processing
- Tertiary: Services and distribution
- Quaternary: Knowledge and information
Notes on Methodology:
This research considers both state-run and independent businesses in their definitions. For countries where data was hard to pin down, they have been grayed out.
As well, since many countries have a relatively new inception, present-day names and borders have been used. The map does not factor in older companies that are no longer in operation, or if it was unclear whether they were still open.
Click here to explore the full research methodology.
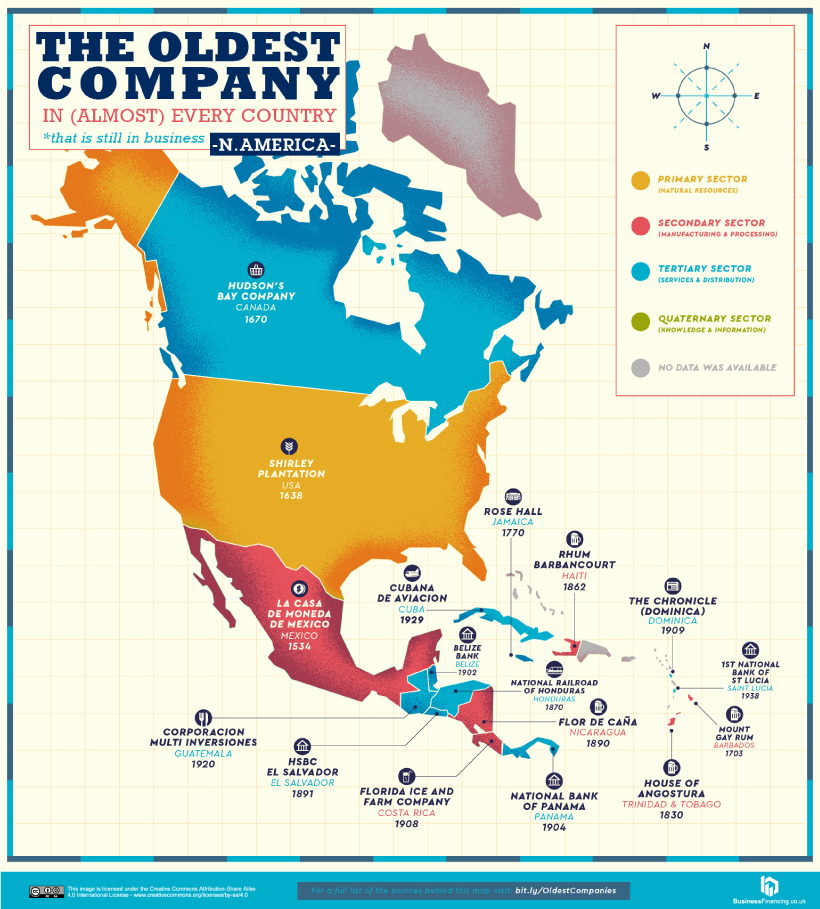
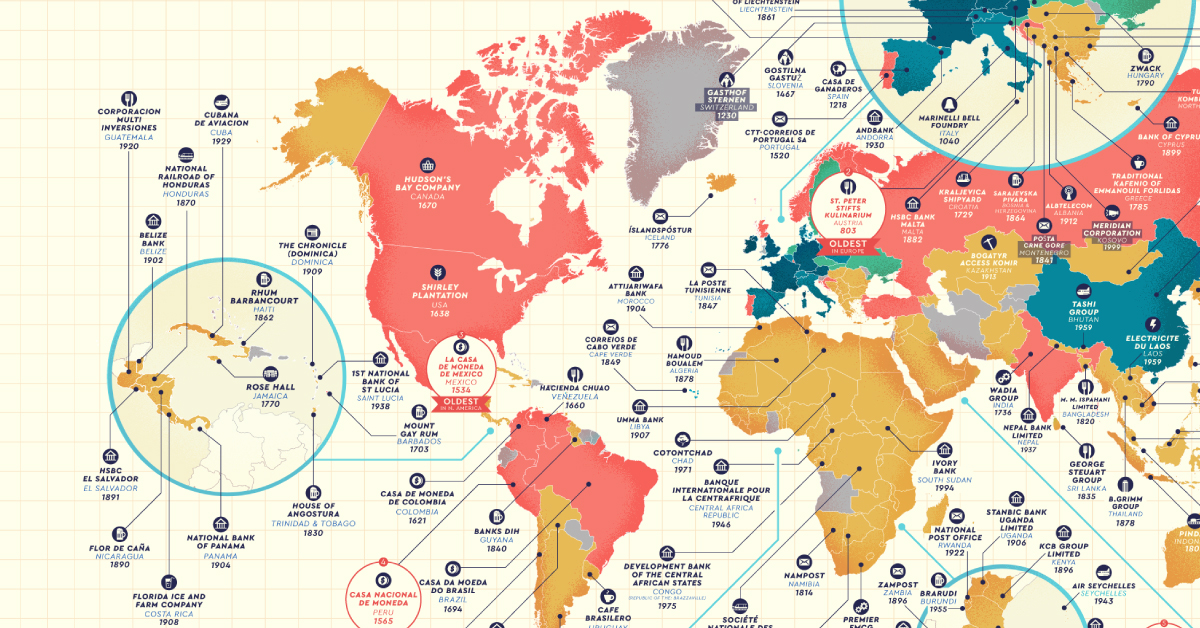
North America
Mexico’s La Casa de Moneda de México (founded 1534) is the oldest company across North America, and the first mint of America. Owned by the Spanish conquistador Hernán Cortés, it was where the famous ‘pieces of eight’, or Spanish dollars were created.
In the U.S., the Shirley Plantation in Virginia is an ongoing reminder of the history of slavery. First founded in 1613, business actually began in 1638—and as many as 90 slaves were under indentured labor on the estate growing tobacco.
Further north, Canada’s Hudson’s Bay (founded 1670) was at the helm of the fur trade between European settlers and First Nations tribes—the two parties agreed on beaver pelts as a common, valuable trade standard.
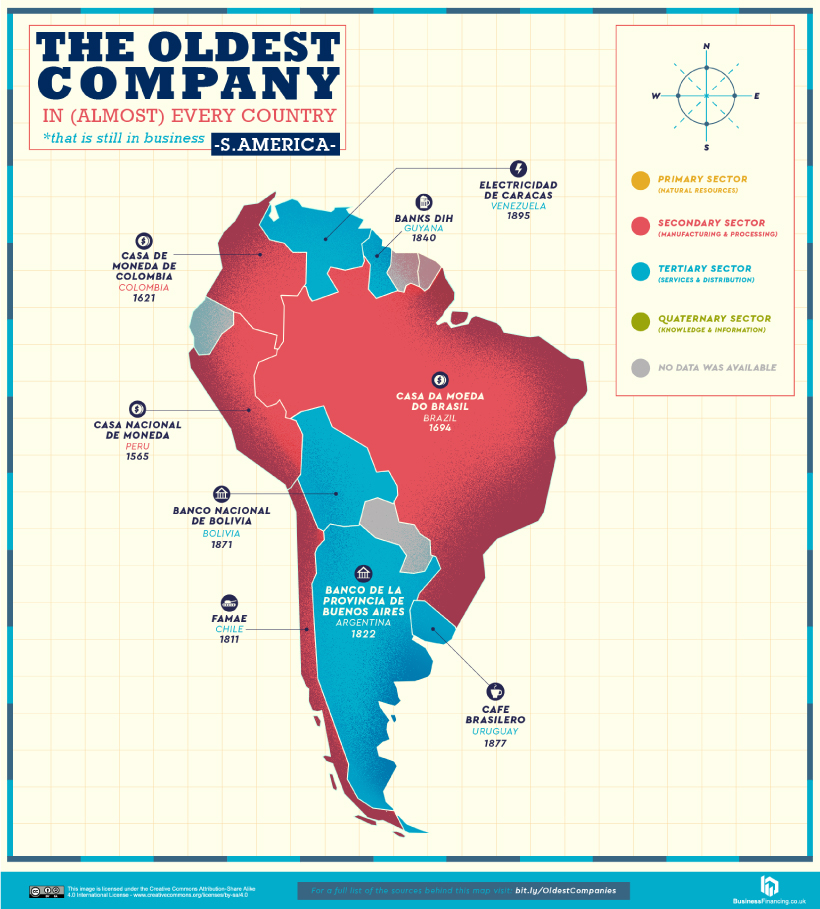
South America
Three of the five oldest companies in South America are mints—specifically in Brazil, Colombia, and Peru.
The oldest of these mints, Casa Nacional de Moneda in Peru, was built on order from Spain and established in 1565. After the great influx of newly-mined silver from America to Europe, the Spanish crown outlined to King Felipe II that building a mint would give the colony economic benefits and more control.
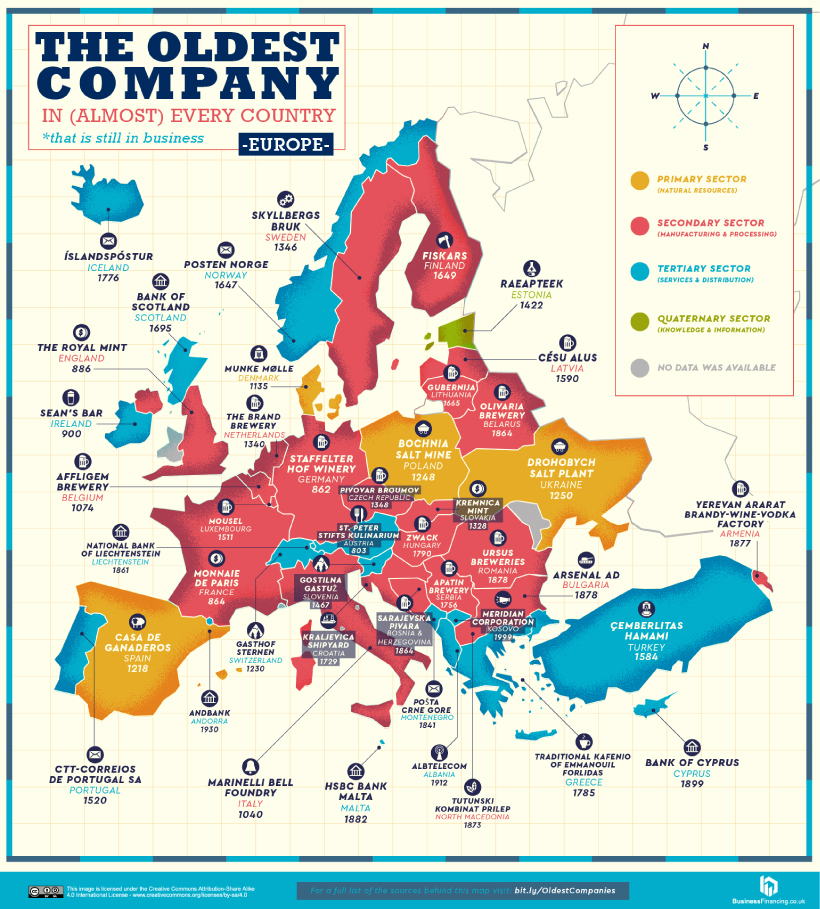
Europe
In total, 15 of Europe’s oldest companies are related to the food and beverage industries, from distilleries, vintners (winemaking), and breweries alongside restaurants and pubs. Austria’s St. Peter Stifts Kulinarium (founded in 803) is Europe’s oldest restaurant, located inside the St. Peter’s Abbey monastery.
Although Germany is famously known for its beer culture, its oldest company is in fact the Staffelter Hof Winery (founded in 862). Today, Germany is still a top wine country, with the industry generating up to $17 billion in revenue per year.
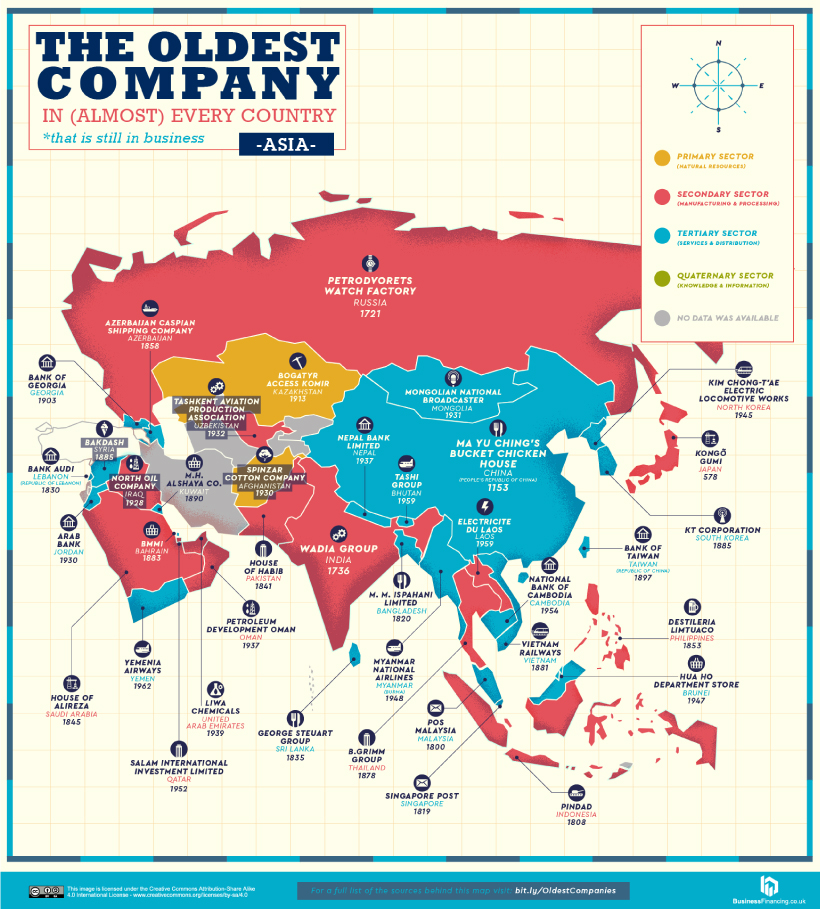
Asia
Asia has six oldest companies in the banking and finance category, as well as another six in the aviation and transport sector. The continent is also home to two of the world’s oldest companies, located in Japan and China.
The Japanese temple and shrine construction company, Kongō Gumi Co., Ltd. (founded in 578) has weathered a few storms over the millennia, from nuclear bombs to financial crises. In 2006, it was bought by the construction conglomerate, Takamatsu Construction Group Co., and continues to operate today.
In neighboring China, Ma Yu Ching’s Bucket Chicken House has endured dynasties of change as well. The company’s simple premise has come a long way, and it was named a cultural heritage in the country’s Henan Province.
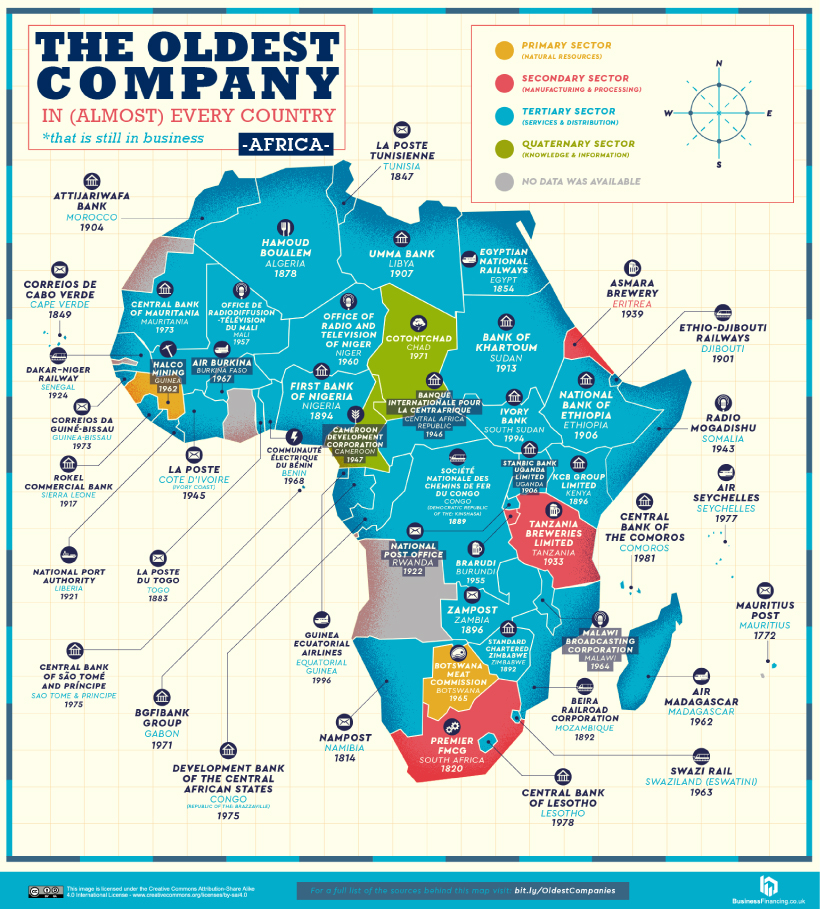
Africa
Africa’s oldest companies are another vestige of the colonial legacy, with 11 transport companies—airlines, ports and shipping, and railways—and 9 postal services.
In fact, Cape Verde’s Correios de Cabo Verde (postal service, founded in 1849) and the DRC’s Société nationale des Chemins de fer du Congo (national railway company, founded in 1889) still go by their Portuguese and French names respectively.
Banking is another one of the oldest industries, with 17 companies across Africa. Zimbabwe’s Standard Chartered branch has been around since 1892, a subsidiary of its London-based parent company.
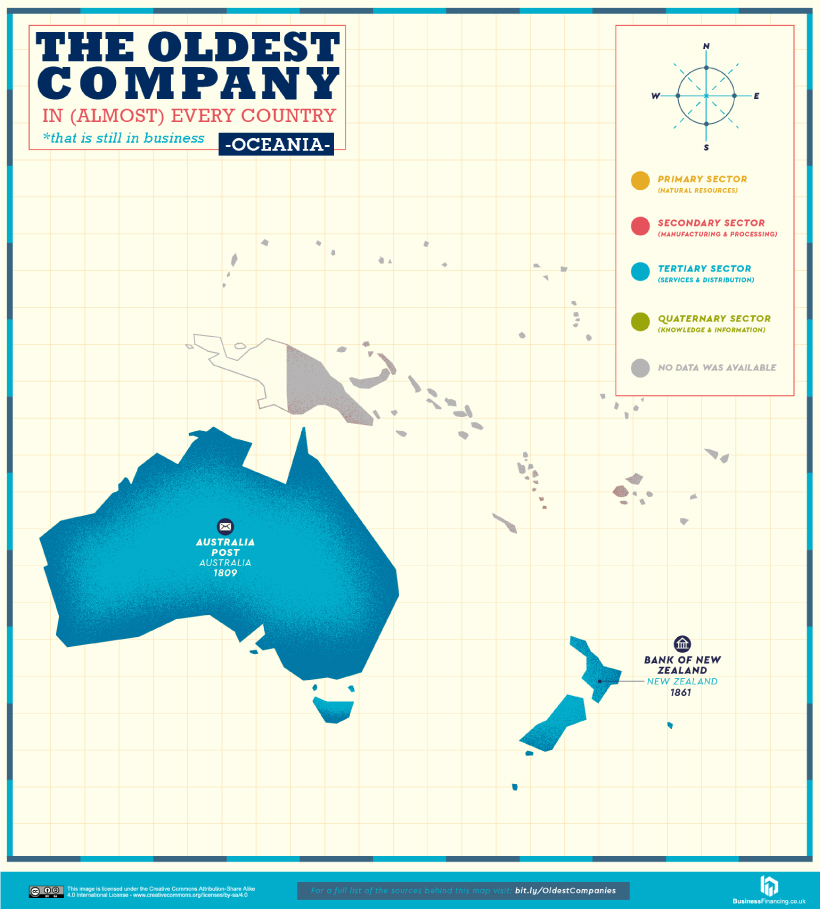
Oceania
Australia officially became a country on January 1st, 1901—but its oldest company, the Australia Post (founded in 1809) precedes this by almost a century.
Interestingly, just one more old company could be located for this region, which is the Bank of New Zealand—one of the country’s Big Four banks.
All in all, these oldest companies paint a historical picture of the major industries which have shaped entire regions.
Did you recognize any on the list?
Support the Future of Data Storytelling
Sorry to interrupt your reading, but we have a favor to ask. At Visual Capitalist we believe in a world where data can be understood by everyone. That’s why we want to build the VC App - the first app of its kind combining verifiable and transparent data with beautiful, memorable visuals. All available for free.
As a small, independent media company we don’t have the expertise in-house or the funds to build an app like this. So we’re asking our community to help us raise funds on Kickstarter.
If you believe in data-driven storytelling, join the movement and back us on Kickstarter!
Thank you.

Markets
30 Years of Gun Manufacturing in America
The U.S. has produced nearly 170 million firearms over the past three decades. Here are the numbers behind America’s gun manufacturing sector.

30 Years of Gun Manufacturing in America
While gun sales have been brisk in recent years, the uncertainty surrounding COVID-19 was a boon for the gun industry.
From 2010-2019, an average of 13 million guns were sold legally in the U.S. each year. In 2020 and 2021, annual gun sales sharply increased to 20 million.
While the U.S. does import millions of weapons each year, a large amount of firearms sold in the country were produced domestically. Let’s dig into the data behind the multi-billion dollar gun manufacturing industry in America.
Gun Manufacturing in the United States
According to a recent report from the Bureau of Alcohol, Tobacco, Firearms and Explosives (ATF), the U.S. has produced nearly 170 million firearms over the past three decades, with production increasing sharply in recent years.
America’s gunmakers produce a wide variety of firearms, but they’re generally grouped into five categories; pistols, rifles, shotguns, revolvers, and everything else.
Below is a breakdown of firearms manufactured in the country over the past 30 years, by type:
Year | Pistols | Rifles | Revolvers | Shotguns | Misc. Firearms | Total Firearms |
---|---|---|---|---|---|---|
1989 | 1,404,753 | 1,407,400 | 628,573 | 935,541 | 42,126 | 4,418,393 |
1990 | 1,371,427 | 1,211,664 | 470,495 | 848,948 | 57,434 | 3,959,968 |
1991 | 1,378,252 | 883,482 | 456,966 | 828,426 | 15,980 | 3,563,106 |
1992 | 1,669,537 | 1,001,833 | 469,413 | 1,018,204 | 16,849 | 4,175,836 |
1993 | 2,093,362 | 1,173,694 | 562,292 | 1,144,940 | 81,349 | 5,055,637 |
1994 | 2,004,298 | 1,316,607 | 586,450 | 1,254,926 | 10,936 | 5,173,217 |
1995 | 1,195,284 | 1,411,120 | 527,664 | 1,173,645 | 8,629 | 4,316,342 |
1996 | 987,528 | 1,424,315 | 498,944 | 925,732 | 17,920 | 3,854,439 |
1997 | 1,036,077 | 1,251,341 | 370,428 | 915,978 | 19,680 | 3,593,504 |
1998 | 960,365 | 1,535,690 | 324,390 | 868,639 | 24,506 | 3,713,590 |
1999 | 995,446 | 1,569,685 | 335,784 | 1,106,995 | 39,837 | 4,047,747 |
2000 | 962,901 | 1,583,042 | 318,960 | 898,442 | 30,196 | 3,793,541 |
2001 | 626,836 | 1,284,554 | 320,143 | 679,813 | 21,309 | 2,932,655 |
2002 | 741,514 | 1,515,286 | 347,070 | 741,325 | 21,700 | 3,366,895 |
2003 | 811,660 | 1,430,324 | 309,364 | 726,078 | 30,978 | 3,308,404 |
2004 | 728,511 | 1,325,138 | 294,099 | 731,769 | 19,508 | 3,099,025 |
2005 | 803,425 | 1,431,372 | 274,205 | 709,313 | 23,179 | 3,241,494 |
2006 | 1,021,260 | 1,496,505 | 385,069 | 714,618 | 35,872 | 3,653,324 |
2007 | 1,219,664 | 1,610,923 | 391,334 | 645,231 | 55,461 | 3,922,613 |
2008 | 1,609,381 | 1,734,536 | 431,753 | 630,710 | 92,564 | 4,498,944 |
2009 | 1,868,258 | 2,248,851 | 547,195 | 752,699 | 138,815 | 5,555,818 |
2010 | 2,258,450 | 1,830,556 | 558,927 | 743,378 | 67,929 | 5,459,240 |
2011 | 2,598,133 | 2,318,088 | 572,857 | 862,401 | 190,407 | 6,541,886 |
2012 | 3,487,883 | 3,168,206 | 667,357 | 949,010 | 306,154 | 8,578,610 |
2013 | 4,441,726 | 3,979,570 | 725,282 | 1,203,072 | 495,142 | 10,844,792 |
2014 | 3,633,454 | 3,379,549 | 744,047 | 935,411 | 358,165 | 9,050,626 |
2015 | 3,557,199 | 3,691,799 | 885,259 | 777,273 | 447,131 | 9,358,661 |
2016 | 4,720,075 | 4,239,335 | 856,291 | 848,617 | 833,123 | 11,497,441 |
2017 | 3,691,010 | 2,504,092 | 720,917 | 653,139 | 758,634 | 8,327,792 |
2018 | 3,881,158 | 2,880,536 | 664,835 | 536,126 | 1,089,973 | 9,052,628 |
2019 | 3,046,013 | 1,957,667 | 580,601 | 480,735 | 946,929 | 7,011,945 |
Total | 60,804,840 | 59,796,760 | 15,826,964 | 26,241,134 | 6,298,415 | 168,968,113 |
Pistols (36%) and rifles (35%) are the dominant categories, and over time, the former has become the most commonly produced firearm type.
In 2001, pistols accounted for 21% of firearms produced. Today, nearly half of all firearms produced are pistols.
Who is Producing America’s Firearms?
There are a wide variety of firearm manufacturing companies in the U.S., but production is dominated by a few key players.
Here are the top 10 gunmakers in America, which collectively make up 70% of production:
Rank | Firearm Manufacturer | Guns Produced (2016-2020) | Share of total |
---|---|---|---|
1 | Smith & Wesson Corp | 8,218,199 | 17.2% |
2 | Sturm, Ruger & Company, Inc | 8,166,448 | 17.1% |
3 | Sig Sauer Inc | 3,660,629 | 7.7% |
4 | Freedom Group | 3,045,427 | 6.4% |
5 | 0 F Mossberg & Sons Inc | 2,223,241 | 4.7% |
6 | Taurus International Manufacturing | 1,996,121 | 4.2% |
7 | WM C Anderson Inc | 1,816,625 | 3.8% |
8 | Glock Inc | 1,510,437 | 3.2% |
9 | Henry RAC Holding Corp | 1,378,544 | 2.9% |
10 | JIE Capital Holdings / Enterprises | 1,258,969 | 2.6% |
Total | 33,274,640 | 69.7% |
One-third of production comes from two publicly-traded parent companies: Smith & Wesson (NASDAQ: SWBI), and Sturm, Ruger & Co. (NYSE: RGR)
Some of these players are especially dominant within certain types of firearms. For example:
- 58% of pistols were made by Smith & Wesson, Ruger, and SIG SAUER (2008–2018)
- 45% of rifles were made by Remington*, Ruger, and Smith & Wesson (2008–2018)
*In 2020, Remington filed for Chapter 11 bankruptcy protection, and its assets were divided and sold to various buyers. The Remington brand name is now owned by Vista Outdoor (NYSE: VSTO)
The Geography of Gun Manufacturing
Companies that manufacture guns hold a Type 07 license from the ATF. As of 2020, there are more than 16,000 Type 07 licensees across the United States.
Below is a state-level look at where the country’s licensees are located:
State | Licenses (2000) | Licenses (2020) | Population | Licenses per 100,000 pop. (2020) |
---|---|---|---|---|
Alaska | 8 | 117 | 733,391 | 16.0 |
Alabama | 40 | 276 | 5,039,877 | 5.5 |
Arkansas | 28 | 302 | 3,011,524 | 10.0 |
Arizona | 100 | 959 | 7,276,316 | 13.2 |
California | 159 | 620 | 39,237,836 | 1.6 |
Colorado | 27 | 481 | 5,812,069 | 8.3 |
Connecticut | 71 | 194 | 3,605,944 | 5.4 |
Delaware | 0 | 10 | 989,948 | 1.0 |
Florida | 131 | 1,009 | 21,781,128 | 4.6 |
Georgia | 52 | 510 | 10,799,566 | 4.7 |
Hawaii | 0 | 11 | 1,455,271 | 0.8 |
Iowa | 11 | 187 | 3,190,369 | 5.9 |
Idaho | 38 | 358 | 1,839,106 | 19.5 |
Illinois | 40 | 263 | 12,671,469 | 2.1 |
Indiana | 39 | 280 | 6,805,985 | 4.1 |
Kansas | 17 | 229 | 2,937,880 | 7.8 |
Kentucky | 22 | 211 | 4,505,836 | 4.7 |
Louisiana | 20 | 258 | 4,657,757 | 5.5 |
Massachusetts | 67 | 263 | 6,984,723 | 3.8 |
Maryland | 36 | 146 | 6,165,129 | 2.4 |
Maine | 13 | 107 | 1,362,359 | 7.9 |
Michigan | 43 | 386 | 10,050,811 | 3.8 |
Minnesota | 63 | 254 | 5,707,390 | 4.5 |
Missouri | 62 | 401 | 6,168,187 | 6.5 |
Mississippi | 12 | 190 | 2,961,279 | 6.4 |
Montana | 24 | 240 | 1,084,225 | 22.1 |
North Carolina | 52 | 628 | 10,551,162 | 6.0 |
North Dakota | 3 | 46 | 779,094 | 5.9 |
Nebraska | 15 | 91 | 1,961,504 | 4.6 |
New Hampshire | 25 | 188 | 1,377,529 | 13.6 |
New Jersey | 10 | 26 | 9,267,130 | 0.3 |
New Mexico | 18 | 179 | 2,117,522 | 8.5 |
Nevada | 45 | 276 | 3,104,614 | 8.9 |
New York | 35 | 299 | 19,835,913 | 1.5 |
Ohio | 80 | 644 | 11,780,017 | 5.5 |
Oklahoma | 37 | 423 | 3,959,353 | 10.7 |
Oregon | 55 | 226 | 4,237,256 | 5.3 |
Pennsylvania | 87 | 519 | 12,964,056 | 4.0 |
Rhode Island | 1 | 20 | 1,097,379 | 1.8 |
South Carolina | 25 | 284 | 5,190,705 | 5.5 |
South Dakota | 14 | 79 | 886,667 | 8.9 |
Tennessee | 76 | 352 | 6,975,218 | 5.0 |
Texas | 150 | 2,022 | 29,527,941 | 6.8 |
Utah | 33 | 478 | 3,271,616 | 14.6 |
Virginia | 48 | 412 | 8,642,274 | 4.8 |
Vermont | 15 | 85 | 643,077 | 13.2 |
Washington | 49 | 351 | 7,738,692 | 4.5 |
Wisconsin | 38 | 306 | 5,895,908 | 5.2 |
West Virginia | 20 | 115 | 1,793,716 | 6.4 |
Wyoming | 20 | 147 | 576,851 | 25.5 |
These manufacturers are located all around the country, so these numbers are somewhat reflective of population. Unsurprisingly, large states like Texas and Florida have the most licensees.
Sorting by the number of licensees per 100,000 people offers a different point of view. By this measure, Wyoming, Montana, and Idaho come out on top.
If recent sales and production trends are any indication, these numbers may only continue to grow.
Business
The World’s Largest Real Estate Investment Trusts (REITs)
Real estate investment trusts (REITS) are a simple alternative for investors looking to gain exposure to real estate.

The World’s Largest Real Estate Investment Trusts (REITs)
Real estate is widely regarded as an attractive asset class for investors.
This is because it offers several benefits like diversification (due to less correlation with stocks), monthly income, and protection from inflation. The latter is known as “inflation hedging”, and stems from real estate’s tendency to appreciate during periods of rising prices.
Affordability, of course, is a major barrier to investing in most real estate. Property markets around the world have reached bubble territory, making it incredibly difficult for people to get their foot in the door.
Thankfully, there are easier ways of gaining exposure. One of these is purchasing shares in a real estate investment trust (REIT), a type of company that owns and operates income-producing real estate, and is most often publicly-traded.
What Qualifies as REIT?
To qualify as a REIT in the U.S., a company must meet several criteria:
- Invest at least 75% of assets in real estate, cash , or U.S. Treasuries
- Derive at least 75% of gross income from rents, interest on mortgages, or real estate sales
- Pay at least 90% of taxable income in the form of shareholder dividends
- Be a taxable corporation
- Be managed by a board of directors or trustees
- Have at least 100 shareholders after one year of operations
- Have no more than half its shares held by five or fewer people
Investing in a REIT is similar to purchasing shares of any other publicly-traded company. There are also exchange-traded funds (ETFs) and mutual funds which may hold a basket of REITs. Lastly, note that some REITs are private, meaning they aren’t traded on stock exchanges.
The Top 10 by Market Cap
Here are the world’s 10 largest publicly-traded REITs, as of March 25, 2022.
REIT | Market Cap | Dividend Yield | Property Type |
---|---|---|---|
Prologis (NYSE: PLD) | $116.4B | 2.03% | Industrial |
American Tower (NYSE: AMT) | $109.8B | 2.38% | Communications |
Crown Castle (NYSE: CCI | $76.8B | 3.35% | Communications |
Public Storage (NYSE: PSA) | $65.9B | 2.14% | Self-storage |
Equinix (NYSE: EQIX) | $64.4B | 1.74% | Data centers |
Simon Property Group (NYSE: SPG) | $48.9B | 5.07% | Malls |
Welltower (NYSE: WELL) | $43.0B | 2.58% | Healthcare |
Digital Realty (NYSE: DLR) | $40.1B | 3.55% | Data centers |
Realty Income (NYSE: O) | $40.1B | 4.44% | Commercial |
AvalonBay Communities (NYSE: AVB) | $34.6B | 2.62% | Residential |
As shown above, REITs focus on different sectors of the market. Understanding their differences is an important step to consider before making an investment.
For example, Prologis manages the world’s largest portfolio of logistics real estate. This includes warehouses, distribution centers, and other supply chain facilities around the globe. It’s reasonable to assume that this REIT would benefit from further growth in ecommerce—more on this near the end.
Realty Income, on the other hand, owns a portfolio of over 11,100 commercial real estate properties in the U.S. and Europe. It rents these properties out to major brands like Walgreens and 7-Eleven, which together account for 8.1% of the REIT’s annual income.
More Than Just Buildings
Cell towers and data centers may not seem like “real estate”, but they are both critical pieces of modern infrastructure that take up land.
REITs that focus on these sectors include American Tower and Crown Castle, which own wireless communications assets in the U.S. and abroad. They are likely to benefit from the increased adoption of 5G networks and the Internet of Things (IoT).
On the other hand, Equinix and Digital Realty are focused on data centers, a fast growing industry that is benefitting from digitalization. Both of these REITs work with major tech firms such as Amazon and Google.
Trends to Watch
The demand for real estate can be heavily influenced by overarching trends found around the world. One of these is population growth and urbanization, which has drastically pushed up the cost of housing in many cities around the world.
There’s also the rising prevalence of ecommerce, which has triggered a boom in demand for warehouse space. This is best captured by Amazon’s massive growth during the COVID-19 pandemic, during which the company doubled the number of its warehouse facilities.
Globally, ecommerce accounts for just 19.6% of total retail sales. Should that figure continue to rise, industrial real estate prices could be in store for robust, long-term growth.
-
Money3 weeks ago
Mapping the Migration of the World’s Millionaires
-
Energy1 week ago
Who’s Still Buying Fossil Fuels From Russia?
-
Markets3 weeks ago
Visualizing the Coming Shift in Global Economic Power (2006-2036p)
-
Datastream4 weeks ago
Ranked: These Are 10 of the World’s Least Affordable Housing Markets
-
Demographics3 weeks ago
Mapped: A Decade of Population Growth and Decline in U.S. Counties
-
Misc4 weeks ago
Visualizing Well-Known Airlines by Fleet Composition
-
Misc3 weeks ago
Iconic Infographic Map Compares the World’s Mountains and Rivers
-
Markets2 weeks ago
Interest Rate Hikes vs. Inflation Rate, by Country