BYD is set to surpass Tesla in EV sales for 2024. In this graphic, we illustrate the global electric vehicle...


click for more →


Scan with your phone's camera or QR code app to view
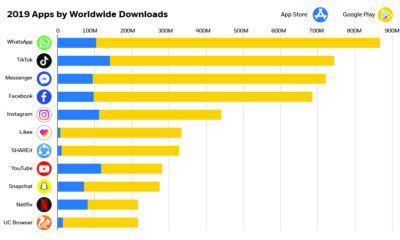

The app economy is expected to be over $6 trillion by 2021—see the world's most downloaded apps and how they're driving the future of this market.
Tesla is not only the top valued U.S. automaker, it's now worth more than Ford and GM combined. Will the rally continue, or will short sellers...
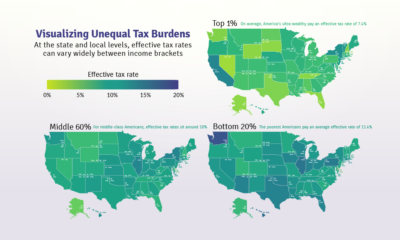

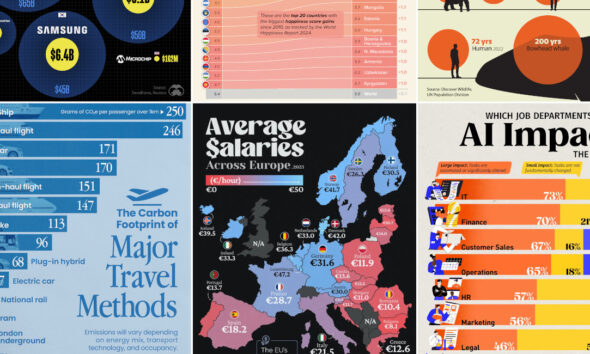
Poor families pay a higher share of their income towards state and local taxes than wealthy families. These maps show the inequitable tax burdens.
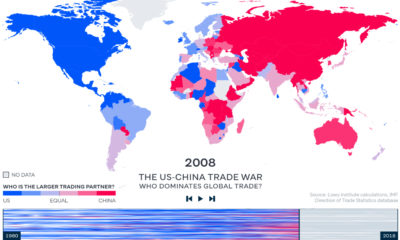

China has become the world's major trading partner – and now, 128 of 190 countries trade more with China than they do with the United States.
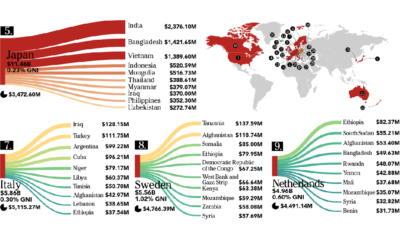

This infographic looks at who is giving – and who is receiving – the billions of dollars in foreign aid that flows between countries each year.
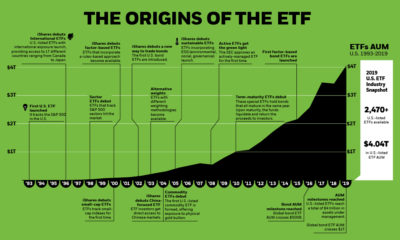

This graphic timeline highlights how the exchange-traded fund (ETF) came into existence, as well as the 26-year history of ETFs as an investment vehicle.
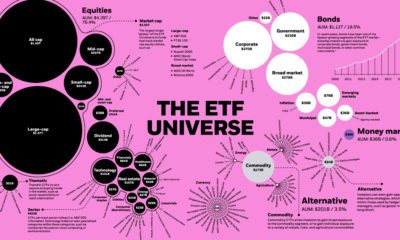

The global ETF universe has grown to be worth $5.75 trillion — here's how the assets break down by type, sector, and investment focus.
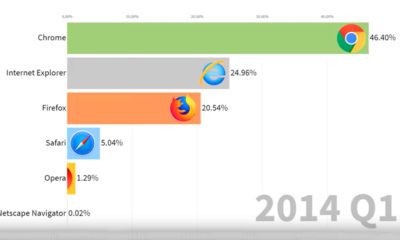

This animation provides a nostalgic look back at the market share of various web browsers, from Netscape Navigator to Google Chrome.


Telcos failed to capitalize on the 'Netflix' opportunity — however, the birth of a new multi-billion dollar industry (esports) could change the game.
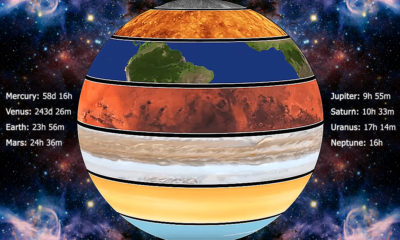

Rotation can have a big influence on a planet's habitability. These animations show how each planet in the solar system moves to its own distinct rhythm.
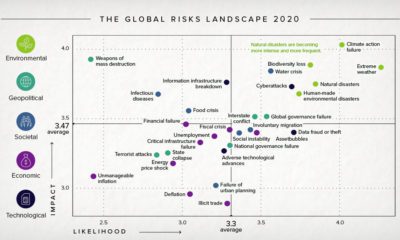

The Global Risk Report 2020 paints an unprecedented risk landscape for 2020—one dominated by climate change and other environmental concerns.
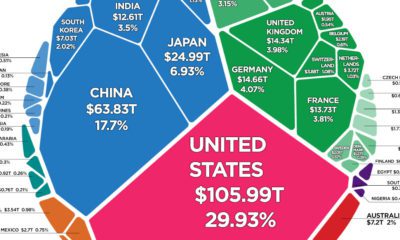

There is $360.6 trillion of wealth globally. This graphic shows how it breaks down by country, to show who owns all of the world's wealth.
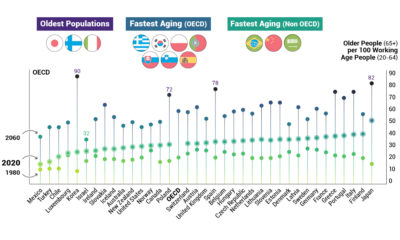

The data behind the world's rapidly aging population, and what it could mean for the economy and future generations of retirees.


Here's a sneak preview of features that VC+ members will get in their inbox in January 2020.
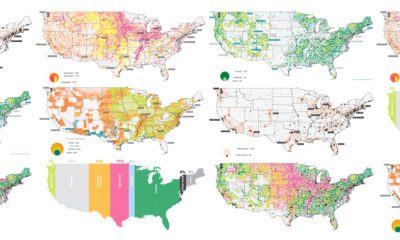

The U.S. covers an immense 3.8 million square miles—what is all this land currently used for, and what does that mean for the future?
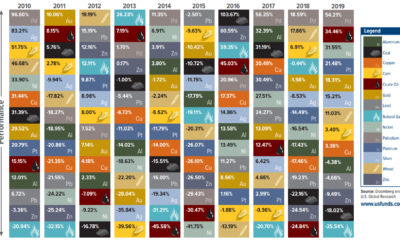

Which individual commodities were the best performers in 2019, and how do those numbers compare to the past decade of data?
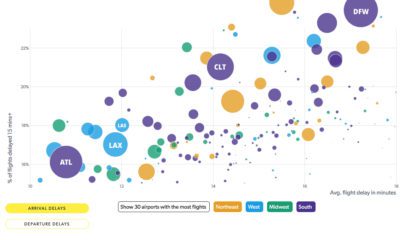

With flight travel more than tripling in the past 30 years, we break down the most notorious airports in the U.S. with the worst flight delays.