Technology
Internet Browser Market Share (1996–2019)
Web browsers are a ubiquitous part of the internet experience and one of the most commonly used digital tools of the modern era.
Since the first rudimentary interfaces were created in the 1990s, a number of browsers have entered the market, with a select few achieving market dominance over our access to web content.
Today’s bar chart race video, by the YouTube channel Data is Beautiful, is a nostalgic look back at how people used to access the internet, from Mosaic to Chrome.
The First Wave of Browsers
Simply put, web browsers are the software applications that act as our portal to the internet. Today, aside from the occasional pop-up box, we barely notice them. In the early ’90s though, when the web was in its infancy, the crude, boxy interfaces were a revolutionary step in making the internet usable to people with access to a computer.
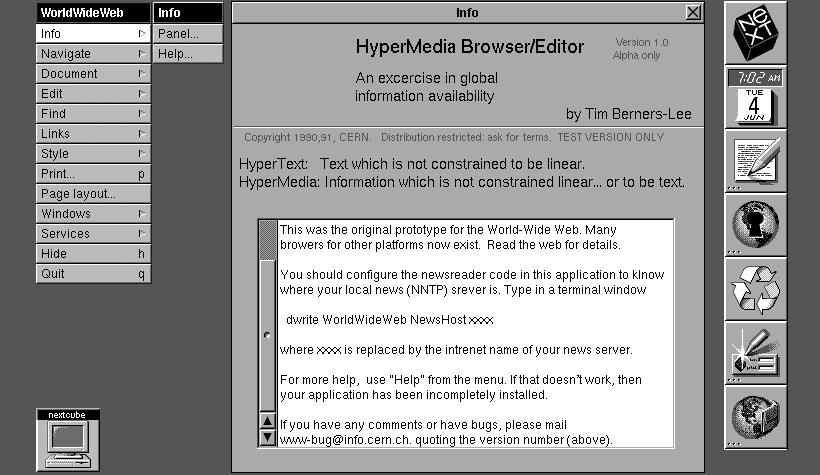
The first step in this journey came in 1990, when the legendary Tim Berners-Lee developed the first-ever web browser called “WorldWideWeb” – later renamed Nexus. Nexus was a graphical user interface (GUI) that allowed users to view text on web pages. Images were still beyond reach, but since most connections were dial-up, that wasn’t much of a limitation at the time.
The precurser to the modern browser was Mosaic, originally developed as a temporary project by the the University of Illinois at Urbana–Champaign (UIUC) and the National Center for Supercomputing Applications (NCSA).
After his graduation from UIUC in 1993, Marc Andreessen teamed up with Jim Clark, the founder of Silicon Graphics, to produce a commercial version of the browser. The resulting software, Netscape Navigator, became the first widely used browser, moving the internet from an abstract concept to a network that was accessible to everyday people. The company soon staged a wildly popular IPO, which saw the 16-month-old startup reach a valuation of nearly $3 billion.
Naturally, the fanfare surrounding Netscape had captured Microsoft’s attention. Immediately after Netscape’s IPO, the first version of Internet Explorer (building off a licensed version of Mozilla) was released. The browser wars had begun.
The Internet Explorer Era
In 1995, Bill Gates was looking to capitalize on the “Internet Tidal Wave”, and was up to the challenge of eating into Netscape’s market share, which stood at about 90%.
A new competitor “born” on the Internet is Netscape. We have to match and beat their offerings…
– Bill Gates
Ultimately, Netscape was no match for Internet Explorer (IE) once it was bundled with the Windows operating system. By the dawn of the new millennium (beware Y2K!) the situation had reversed, with IE capturing over 75% of the browser market share.
With Netscape mostly out of the picture, IE had a stranglehold on the market. In fact, Microsoft’s position was so comfortable that after IE6 was released 2001, the next full version wouldn’t ship until 2006.
It was during this time that a new player came onto the scene. Mozilla Firefox was officially launched in 2004, seeing over 60 million downloads within its first nine months. For the first time in years, Microsoft began to feel the heat of competition.
Goliath and Goliath
Despite the growing popularity for Mozilla Firefox, it was a browser backed by another tech giant that would eventually lead to IE’s downfall – Google Chrome.
Chrome was pitched to the public in 2008 as “a fresh take on the browser”. While Microsoft struggled with open web standards, Chrome’s source code was openly available through Google’s Chromium project.
By 2011, Firefox and Chrome had eroded IE’s market share to below 50%, and a year later, Chrome would end Internet Explorer’s 14-year reign as the world’s top internet browser.
Today, the browser market has come full circle. Chrome has now become the dominant browser on the market, while competitors fight to increase their single-digit market shares. IE has dropped to fourth place.
Looking Back at the Peaks
In the 25 years since Netscape gave people access to the internet, a few browsers have had their moment in the sun. Here are the years of peak market share for all the major browsers:
Browser | Peak Market Share | Peak Year |
---|---|---|
Netscape Navigator | 90% | 1995 |
Internet Explorer | 95% | 2004 |
Opera | 3% | 2009 |
Mozilla Firefox | 32% | 2010 |
Safari | 7% | 2012 |
Once a browser becomes popular, it can be incredibly difficult to carve into its market share. Even during the height of the iPhone era, Apple’s browser, Safari, was only able to manage a 7% market share.
For now, it looks like Chrome will continue to be the world’s preferred method of experiencing the internet. If Chrome’s current trajectory continues, it could become the third major browser to surpass a 90% market share.
Support the Future of Data Storytelling
Sorry to interrupt your reading, but we have a favor to ask. At Visual Capitalist we believe in a world where data can be understood by everyone. That’s why we want to build the VC App - the first app of its kind combining verifiable and transparent data with beautiful, memorable visuals. All available for free.
As a small, independent media company we don’t have the expertise in-house or the funds to build an app like this. So we’re asking our community to help us raise funds on Kickstarter.
If you believe in data-driven storytelling, join the movement and back us on Kickstarter!
Thank you.

Technology
Ranked: The Best-Selling Video Game Consoles of All Time
Video game consoles have changed drastically over the last 50 years. Here are some of the best-selling ones across the globe.

Ranked: The Best-Selling Video Game Consoles of All Time
In 1972, the first-ever commercially available home video game console hit the market—the Magnavox Odyssey. Players of the Odyssey had a choice between two built-in games that were stored directly in the device, and would use a joystick and dials as a controller.
Video game consoles have come a long way since then, and the console market has grown into a multi-billion dollar industry that’s expected to reach $72.67 billion in value by the end of 2022.
This graphic by Enrique Mendoza uses data from VGChartz to show the market leaders in the industry, by highlighting the top-selling video consoles of all time, as of May 8, 2022.
Nine Generations of Video Game Consoles
Before diving into the top-selling consoles, it’s worth taking a step back to touch on the evolution of home consoles to show how they’ve changed over the years.
We dug into the literature on the history of video game consoles, and found that most articles and blog posts on the topic cite nine different generations of devices.
Here’s a breakdown of each generation, and some of their most noteworthy systems:
1972: Gen One, Where it Began
Consoles in the first generation had pre-built games that were stored directly on the device. They include the Magnavox Odyssey and Atari’s Pong.
1976: Gen Two Emerges
In this generation, games were sold separately, rather than programmed into the device. Consoles of this gen include the Fairchild Channel F and the Atari 2600.
1983: Gen Three, the “8-bit Generation”
This era’s consoles typically had 8-bit processes which allowed for more advanced graphics for the time. A few notable consoles during this gen were the Sega SG-1000 and the Nintendo Famicom, released outside Japan as the Nintendo Entertainment System (NES).
1987: Gen Four Elevates Handheld Gaming
Home consoles were released with 16-bit systems, meaning that audio and graphics improved even more in this era. But an arguably bigger moment for this gen was the emergence of the Nintendo Game Boy.
1993: The 3D Start of Gen Five
This generation saw the move away from pixels and towards 3D polygons. Some consoles like the Sony PlayStation started using CD-ROMs instead of cartridges, which stored more data at a cheaper cost and changed the industry.
1998: Gen Six and the Internet
At the start of this generation, the three major players in the console space were Sony, Sega, and Nintendo. By the end, Sega would be replaced with Microsoft as it launched the Xbox and helped popularize online console gaming.
2005: HD Graphics and Motion Controls of Gen Seven
On one side of the market, Microsoft and Sony were competing with high-definition graphics, faster processers, and different forms (Blu-rays or DVDs). But Nintendo’s motion-sensing Nintendo Wii arguably defined this generation, and the handheld Nintendo DS swept the market as well.
2012: Gen Eight’s Modern Consoles
Consoles of this era started having increased connectivity and processing power, with full HD an expectation. It was also an extremely long generation, starting with Nintendo’s unsuccessful Wii U and ending with the ultra-successful Nintendo Switch, widely considered the first hybrid console with three different ways to play: TV mode, handheld mode, or tabletop mode.
2020: Gen Nine and Beyond
So far, this generation has brought upgraded graphics (up to 8K resolution), larger games, and game-streaming capabilities. Devices in this gen include the Xbox Series X/S and PlayStation 5, which both use solid state drives to increase speed and performance, while Nintendo has yet to introduce a 9th generation device.
The Best-Selling Game Consoles
The best-selling video game console of all time is Sony’s PlayStation 2 (PS2). More than 157 million systems have been sold around the world since its launch in March 2000.
Rank | Console | Manufacturer | Global lifetime sales (millions) |
---|---|---|---|
1 | PlayStation 2 (PS2) | Sony | 157.68 |
2 | Nintendo DS (DS) | Nintendo | 154.90 |
3 | Game Boy (GB) | Nintendo | 118.69 |
4 | PlayStation 4 (PS4) | Sony | 116.97 |
5 | Nintendo Switch (NS) | Nintendo | 107.21 |
6 | PlayStation (PS) | Sony | 102.50 |
7 | Nintendo Wii (Wii) | Nintendo | 101.64 |
8 | PlayStation 3 (PS3) | Sony | 87.41 |
9 | Xbox 360 (X360) | Microsoft | 85.8 |
10 | Game Boy Advance (GBA) | Nintendo | 81.51 |
11 | PlayStation Portable (PSP) | Sony | 81.09 |
12 | Nintendo 3DS (3DS) | Nintendo | 75.95 |
13 | Nintendo Entertainment System (NES) | Nintendo | 61.91 |
14 | Xbox One (XOne) | Microsoft | 50.57 |
15 | Super Nintendo Entertainment System (SNES) | Nintendo | 49.10 |
16 | Nintendo 64 (N64) | Nintendo | 32.93 |
17 | Sega Genesis (GEN) | Sega | 29.54 |
18 | Atari 2600 (2600) | Atari | 27.64 |
19 | Xbox (XB) | Microsoft | 24.65 |
20 | GameCube (GC) | Nintendo | 21.74 |
21 | PlayStation 5 (PS5) | Sony | 19.32 |
22 | PlayStation Vita (PSV) | Sony | 16.21 |
23 | Xbox Series X/S (XS) | Microsoft | 14.32 |
24 | Nintendo Wii U (WiiU) | Nintendo | 13.97 |
25 | GameGear (GG) | Sega | 10.62 |
26 | Sega Saturn (SAT) | Sega | 8.82 |
27 | Dreamcast (DC) | Sega | 8.20 |
28 | Atari 7800 (7800) | Atari | 4.30 |
Despite the fact the PS2’s been discontinued since 2013, no other gaming console has managed to top it—in fact, the next closest actively-sold consoles, the PS4 and Nintendo Switch, are each more than 40 million units behind.
One major factor for the PS2’s success was its built-in DVD player. At the time, DVD players were very expensive, and in many places a PS2 was a cheaper and effective alternative. It was also one of the first devices to be “backward compatible,” meaning users could play most of their PS1 games on the PS2. This meant players didn’t have to buy a whole new library of games when they made the switch to a PS2, and Sony could tap into its existing customer base.
But while Sony’s PS2 is the top-selling console on the list, Nintendo has more top-selling consoles on the list—almost half of the consoles on the list are manufactured by Nintendo (11), while only seven are made by Sony.
What Will it Take to Out-Sell the PS2?
As the PS4 has started taking a backseat to the PS5 in sales and promotion, the current most-likely contender for the best-selling console crown is the Nintendo Switch. Early in 2022, it was the fastest console to sell 100 million units.
With lots of hype around the possibilities of AR and VR, it’ll be interesting to see what new features come with the next generation of gaming consoles.
Will future devices ever beat the PS2’s record-breaking sales? Time will tell. But for now, the 22-year-old console continues to hold its well-earned spot at the top.
Technology
Visualizing The 50 Biggest Data Breaches From 2004–2021
In 2021, more than 5.9 billion user records were stolen. This graphic visualizes the 50 largest data breaches, by entity and sector, since 2004.

Visualizing The 50 Biggest Data Breaches From 2004–2021
As our world has become increasingly reliant on technology and data stored online, data breaches have become an omnipresent threat to users, businesses, and government agencies. In 2021, a new record was set with more than 5.9 billion user records stolen.
This graphic by Chimdi Nwosu visualizes the 50 largest data breaches since 2004, along with the sectors most impacted. Data was aggregated from company statements and news reports.
Understanding the Basics of Data Breaches
A data breach is an incident in which sensitive or confidential information is copied, transmitted or stolen by an unauthorized entity. This can occur as a result of malware attacks, payment card fraud, insider leaks, or unintended disclosure.
The targeted data is often customer PII (personally identifiable information), employee PII, intellectual property, corporate data or government agency data.
Date breaches can be perpetrated by lone hackers, organized cybercrime groups, or even national governments. Stolen information can then be used in other criminal enterprises such as identity theft, credit card fraud, or held for ransom payment.
Notable Data Breaches Since 2004
The largest data breach recorded occurred in 2013 when all three billion Yahoo accounts had their information compromised. In that cyberattack, the hackers were able to gather the personal information and passwords of users. While the full extent of the Yahoo data breach is still not fully realized, subsequent cybercrimes across the globe have been linked to the stolen information.
Here are the 50 largest data breaches by amount of user records stolen from 2004–2021.
Rank | Entity | Sector | Records Compromised | Year |
---|---|---|---|---|
1 | Yahoo | Web | 3.0B | 2013 |
2 | River City Media | Web | 1.4B | 2017 |
3 | Aadhaar | Government | 1.1B | 2018 |
4 | First American Corporation | Finance | 885M | 2019 |
5 | Spambot | Web | 711M | 2017 |
6 | Web | 700M | 2021 | |
7 | Tech | 533M | 2021 | |
8 | Yahoo | Web | 500M | 2014 |
9 | Marriott International | Retail | 500M | 2018 |
10 | Syniverse | Telecoms | 500M | 2021 |
11 | Web | 419M | 2019 | |
12 | Friend Finder Network | Web | 412M | 2016 |
13 | OxyData | Tech | 380M | 2019 |
14 | MySpace | Web | 360M | 2016 |
15 | Exactis | Data | 340M | 2018 |
16 | Tech | 330M | 2018 | |
17 | Airtel | Telecoms | 320M | 2019 |
18 | Indian citizens | Web | 275M | 2019 |
19 | Wattpad | Web | 270M | 2020 |
20 | Microsoft | Web | 250M | 2019 |
21 | Experian Brazil | Finance | 220M | 2021 |
22 | Chinese resume leak | Web | 202M | 2019 |
23 | Court Ventures | Finance | 200M | 2013 |
24 | Apollo | Tech | 200M | 2018 |
25 | Deep Root Analytics | Web | 198M | 2015 |
26 | Zynga | Gaming | 173M | 2019 |
27 | VK | Web | 171M | 2016 |
28 | Equifax | Finance | 163M | 2017 |
29 | Dubsmash | Web | 162M | 2019 |
30 | Massive American business hack | Finance | 160M | 2013 |
31 | MyFitnessPal | App | 150M | 2018 |
32 | Ebay | Web | 145M | 2014 |
33 | Canva | Web | 139M | 2019 |
34 | Heartland | Finance | 130M | 2009 |
35 | Nametests | App | 120M | 2018 |
36 | Tetrad | Finance | 120M | 2020 |
37 | Web | 117M | 2016 | |
38 | Pakistani mobile operators | Telecoms | 115M | 2020 |
39 | ElasticSearch | Tech | 108M | 2019 |
40 | Capital One | Finance | 106M | 2019 |
41 | Thailand visitors | Government | 106M | 2021 |
42 | Firebase | App | 100M | 2018 |
43 | Quora | Web | 100M | 2018 |
44 | Rambler.ru | Web | 98M | 2012 |
45 | TK / TJ Maxx | Retail | 94M | 2007 |
46 | MyHeritage | Web | 92M | 2018 |
47 | AOL | Web | 92M | 2004 |
48 | Dailymotion | Web | 85M | 2016 |
49 | Anthem | Health | 80M | 2015 |
50 | Sony Playstation Network | Gaming | 77M | 2011 |
The massive Yahoo hack accounted for roughly 30% of the 9.9 billion user records stolen from the Web sector—by far the most impacted sector. The next most-impacted sectors were Tech and Finance, with 2 billion and 1.6 billion records stolen, respectively.
Although these three sectors had the highest totals of user data lost, that doesn’t necessarily imply they have weaker security measures. Instead, it can probably be attributed to the sheer number of user records they compile.
Not all infamous data breaches are of a large scale. A smaller data breach in 2014 made headlines when Apple’s iCloud was hacked and the personal pictures of roughly 200 celebrities were disseminated across the internet. Although this highly targeted hack only affected a few hundred people, it highlighted how invasive and damaging data breaches can be to users.
The Cost of Data Breaches to Businesses
Every year data breaches cost businesses billions of dollars to prevent and contain, while also eroding consumer trust and potentially having an adverse effect on customer retention.
A 2021 IBM security report estimated that the average cost per data breach for companies in 2020 was $4.2 million, which represents a 10% increase from 2019. That increase is mainly attributed to the added security risk associated with having more people working remotely due to the COVID-19 pandemic.
Measures to Improve Data Security
Completely preventing data breaches is essentially impossible, as cybercrime enterprises are often persistent, dynamic, and sophisticated. Nevertheless, businesses can seek out innovative methods to prevent exposure of data and mitigate potential damages.
For example, after the iCloud attack in 2014, Apple began avidly encouraging users to adopt two-factor authentication in an effort to strengthen data security.
Regardless of the measures businesses take, the unfortunate reality is that data breaches are a cost of doing business in the modern world and will continue to be a concern to both companies and users.
-
Money1 week ago
Mapping the Migration of the World’s Millionaires
-
Markets2 weeks ago
Visualizing the Coming Shift in Global Economic Power (2006-2036p)
-
Datastream3 weeks ago
Ranked: These Are 10 of the World’s Least Affordable Housing Markets
-
Demographics1 week ago
Mapped: A Decade of Population Growth and Decline in U.S. Counties
-
Misc2 weeks ago
Visualizing Well-Known Airlines by Fleet Composition
-
Politics4 weeks ago
Which Countries Trust Their Government, and Which Ones Don’t?
-
Markets4 weeks ago
Ranked: Visualizing the Largest Trading Partners of the U.S.
-
Misc1 week ago
Iconic Infographic Map Compares the World’s Mountains and Rivers