Chart of the Week
Ranked: The Most Innovative Economies in the World
 Can I share this graphic?
 When do I need a license?
 Interested in this piece?
Ranked: The Most Innovative Economies in the World
Innovation was again a front-of-mind theme in Davos at the World Economic Forum’s annual assembly of political and business leaders in 2020.
The global conversation centered around the ability of countries to innovate in the face of changing times. An economy’s response to megatrends, such as tech breakthroughs and the risks of climate change, can dictate its long-term success.
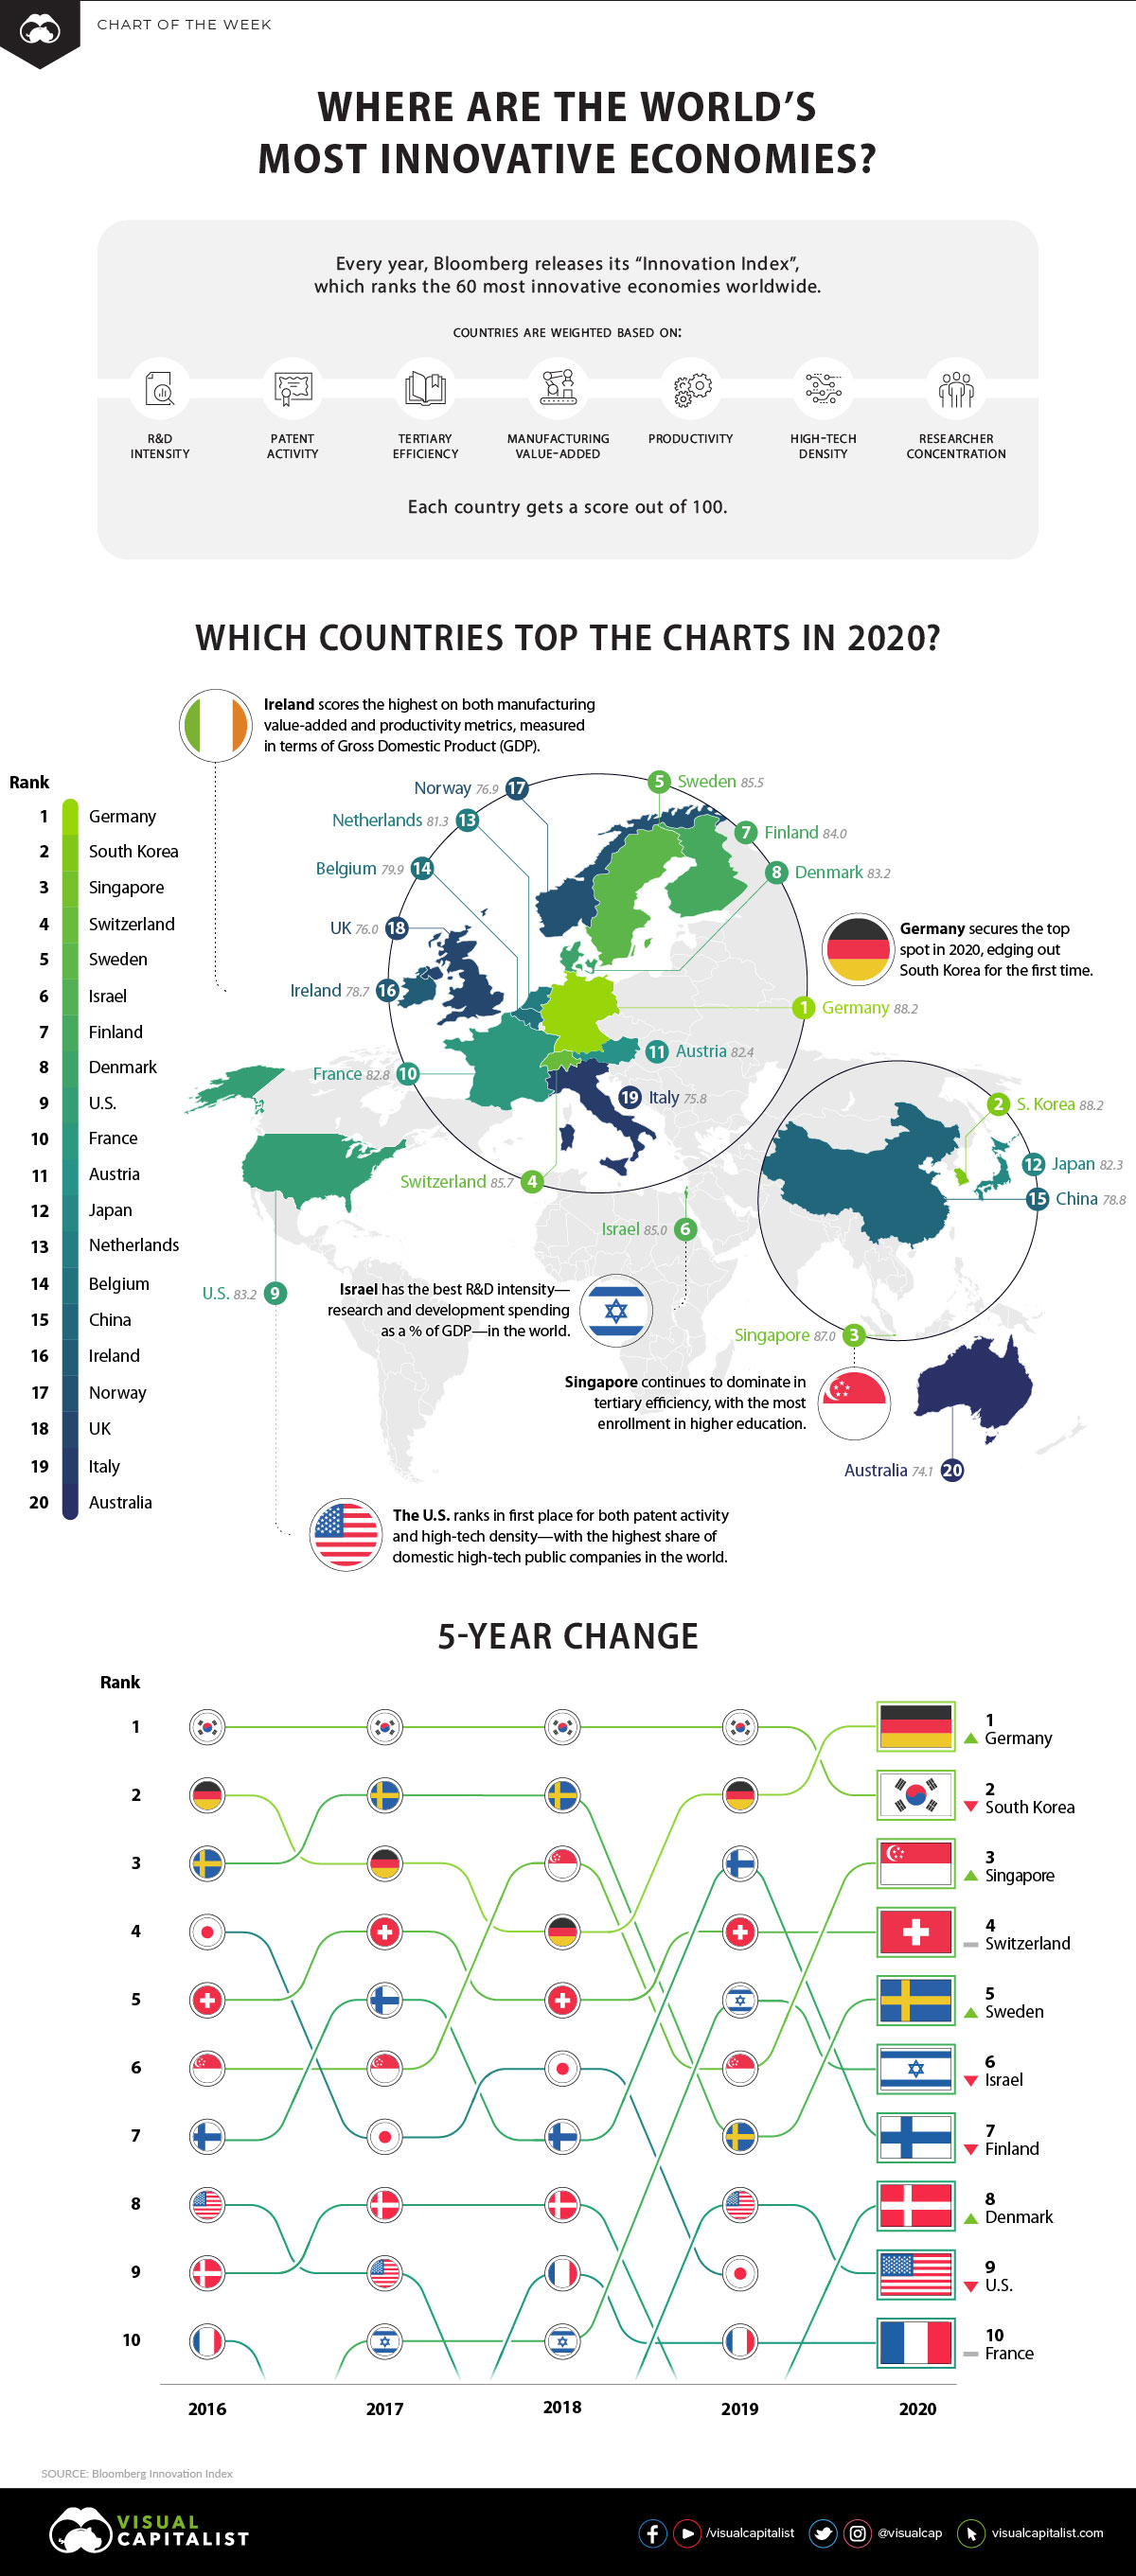
Today’s chart identifies the world’s top 20 most innovative economies, based on the annual index created by Bloomberg. We also delve into how the top 10 spots have evolved over time.
How Are Innovative Economies Measured?
Each year, the index assesses over 200 economies across seven weighted metrics.
- R&D Intensity
Annual research and development spending, as a % of an economy’s gross domestic product (GDP). - Patent Activity
The number of annual patent and grant filings, and the 3-year average growth of filings abroad and filings growth, as a share of the world’s total patent growth. - Tertiary Efficiency
The total enrollment in higher education, the share of labor force with advanced education levels, and the share of STEM graduates and in the labor force. - Manufacturing Value-added
Manufacturing output levels—contributing to exports—as a % of GDP, and per capita. - Productivity
GDP and gross national income (GNI) in the working age population, and the 3-year improvement. - High-tech Density
The volume of domestic, high-tech public companies as a share of the world’s total companies. Examples of high-tech companies include: aerospace and defense, biotech, internet services, and renewable energy. - Researcher Concentration
Professionals (including postgraduate PhD students) engaged in R&D across the population.
Based on available data of these measures, only 105 countries made the final cut for this year’s edition of the index—below are the 60 most innovative economies scored out of 100 points, and the highlights from that list.
The 10 Most Innovative Economies
For the first time in years, Germany clinched the top spot for the most innovative economy, ending South Korea’s winning streak. The European nation scores in the top five for its manufacturing value-added, high-tech density, and patent activity metrics.
However, even winners have some room for improvement. As the global economy sways ever more in the direction of services over manufacturing, Germany could improve its rate of higher education to achieve an even better score on the index.
Ranking third overall, Singapore leads the charge for tertiary efficiency, with almost 85% gross enrollment in higher education as of 2017. In contrast, Germany’s enrollment stood at around 70% in the same year.
Which other countries sit in the top 10?
| Rank | Country | Score | YoY Rank Change | Best-performing Metric |
|---|---|---|---|---|
| #1 | 🇩🇪 Germany | 88.21 | +1 | High-tech density, Patent activity (tied) |
| #2 | 🇰🇷 South Korea | 88.16 | -1 | R&D intensity |
| #3 | 🇸🇬 Singapore | 87.01 | +3 | Tertiary efficiency (Ranked #1) |
| #4 | 🇨🇭 Switzerland | 85.67 | 0 | R&D intensity, Researcher concentration (tied) |
| #5 | 🇸🇪 Sweden | 85.50 | +2 | R&D intensity |
| #6 | 🇮🇱 Israel | 85.03 | -1 | R&D intensity (Ranked #1) |
| #7 | 🇫🇮 Finland | 84.00 | -4 | Productivity, Researcher concentration (tied) |
| #8 | 🇩🇰 Denmark | 83.22 | +3 | Researcher concentration (Ranked #1) |
| #9 | 🇺🇸 United States | 83.17 | -1 | High-tech density, Patent activity (Tied, Ranked #1 for both) |
| #10 | 🇫🇷 France | 82.75 | 0 | High-tech density |
A global hub for innovation, South Korea is still not to be ignored. With one of the most complex economies around, it leads in exports of communications technology and cars. It’s also at the forefront of 5G, being the first country to roll it out—so it’s no surprise that South Korea spends big on research, relative to its GDP.
R&D spending determines life or death for South Korean companies… It’s about widening whatever lead South Korea has—or else China will catch up.
—Chang Suk-Gwon, University professor in Seoul
The United States ranks in first place for both patent activity, and high-tech density—with the highest share of domestic high-tech public companies in the world. With the “Big Five” tech giants all headquartered here, it’s easy to see their impact on a global scale.
Over the past five years, the top 10 players in this index have shuffled around, but remained quite consistent. But one particular economy may well upend the future leaderboard.
The Most Innovative Economies (#11-20)
In 2020, the #11-#20 ranked innovative countries show an interesting mix.
| Rank | Country | Score | YoY Ranking Change | Best-performing metric |
|---|---|---|---|---|
| #11 | 🇦🇹 Austria | 82.40 | +1 | R&D intensity |
| #12 | 🇯🇵 Japan | 82.31 | -3 | R&D intensity, Manufacturing value-added (tied) |
| #13 | 🇳🇱 Netherlands | 81.28 | +2 | High-tech density |
| #14 | 🇧🇪 Belgium | 79.93 | -1 | R&D intensity, Productivity (tied) |
| #15 | 🇨🇳 China | 78.80 | +1 | Patent activity (Ranked #2) |
| #16 | 🇮🇪 Ireland | 78.65 | -2 | Manufacturing value-added, Productivity (Tied, Ranked #1 for both) |
| #17 | 🇳🇴 Norway | 76.93 | 0 | Productivity |
| #18 | 🇬🇧 United Kingdom | 76.03 | 0 | Tertiary efficiency |
| #19 | 🇮🇹 Italy | 75.76 | +2 | High-tech density |
| #20 | 🇦🇺 Australia | 74.13 | -1 | Productivity |
China’s steady rise (up from 21st place in 2017) could be because it scores second worldwide for patent activity. This comes from the aggressive 6,000 patents filed since 2015 by the nation’s own tech giants. The patents cover breakthrough technologies from AI and blockchain, to autonomous driving and even regenerative medicine.
Ireland comes in first place on both manufacturing value-added and productivity metrics. In fact, for every hour worked, employed Irish people add $99.50 to national GDP.
The Full List
Below is the full list of all 60 innovative economies highlighted in the 2020 index.
| Rank | Country | Score | YoY Ranking Change |
|---|---|---|---|
| #1 | Germany | 88.21 | +1 |
| #2 | South Korea | 88.16 | -1 |
| #3 | Singapore | 87.01 | +3 |
| #4 | Switzerland | 85.67 | 0 |
| #5 | Sweden | 85.50 | +2 |
| #6 | Israel | 85.03 | -1 |
| #7 | Finland | 84.00 | -4 |
| #8 | Denmark | 83.22 | +3 |
| #9 | U.S. | 83.17 | -1 |
| #10 | France | 82.75 | 0 |
| #11 | Austria | 82.40 | +1 |
| #12 | Japan | 82.31 | -3 |
| #13 | Netherlands | 81.28 | +2 |
| #14 | Belgium | 79.93 | -1 |
| #15 | China | 78.80 | +1 |
| #16 | Ireland | 78.65 | -2 |
| #17 | Norway | 76.93 | 0 |
| #18 | UK | 76.03 | 0 |
| #19 | Italy | 75.76 | +2 |
| #20 | Australia | 74.13 | -1 |
| #21 | Slovenia | 73.93 | +10 |
| #22 | Canada | 73.11 | -2 |
| #23 | Iceland | 71.56 | 0 |
| #24 | Czech Republic | 70.00 | +1 |
| #25 | Poland | 69.98 | -3 |
| #26 | Russia | 68.63 | +1 |
| #27 | Malaysia | 68.28 | -1 |
| #28 | Hungary | 68.24 | +4 |
| #29 | New Zealand | 68.08 | -5 |
| #30 | Greece | 66.30 | +5 |
| #31 | Luxembourg | 65.41 | -3 |
| #32 | Romania | 65.25 | -3 |
| #33 | Spain | 65.11 | -3 |
| #34 | Portugal | 65.08 | 0 |
| #35 | Turkey | 63.84 | -2 |
| #36 | Estonia | 62.79 | 0 |
| #37 | Latvia | 62.03 | +5 |
| #38 | Lithuania | 61.97 | -1 |
| #39 | Hong Kong | 61.70 | -1 |
| #40 | Thailand | 60.36 | 0 |
| #41 | Slovakia | 59.36 | -2 |
| #42 | Bulgaria | 56.59 | -1 |
| #43 | Croatia | 55.00 | +1 |
| #44 | UAE | 54.31 | +2 |
| #45 | Argentina | 53.78 | +5 |
| #46 | Brazil | 53.65 | -1 |
| #47 | Malta | 53.48 | -4 |
| #48 | Cyprus | 51.56 | 0 |
| #49 | Algeria | 51.24 | NA |
| #50 | South Africa | 51.15 | +1 |
| #51 | Chile | 49.58 | +7 |
| #52 | Tunisia | 49.56 | 0 |
| #53 | Saudi Arabia | 49.54 | +3 |
| #54 | India | 49.33 | 0 |
| #55 | Qatar | 48.81 | +2 |
| #56 | Ukraine | 48.24 | -3 |
| #57 | Vietnam | 47.64 | +3 |
| #58 | Egypt | 46.29 | NA |
| #59 | Kazakhstan | 46.10 | NA |
| #60 | Macao | 46.09 | NA |
Highlights from the rest of the list include:
- Slovenia improved the most by 10 places (to the #21 spot) thanks to its stronger patent activity.
- New Zealand slid by 10 places to the 29th spot, falling for the third consecutive year.
- Last but not least, four countries or jurisdictions made their debut onto the index in 2020: Algeria, Egypt, Kazakhstan, and Macao.
It’s clear that many countries are continuously pushing the envelope in order to maintain their competitiveness within the global economy—and constant innovation can provide a better life for their present and future populations.
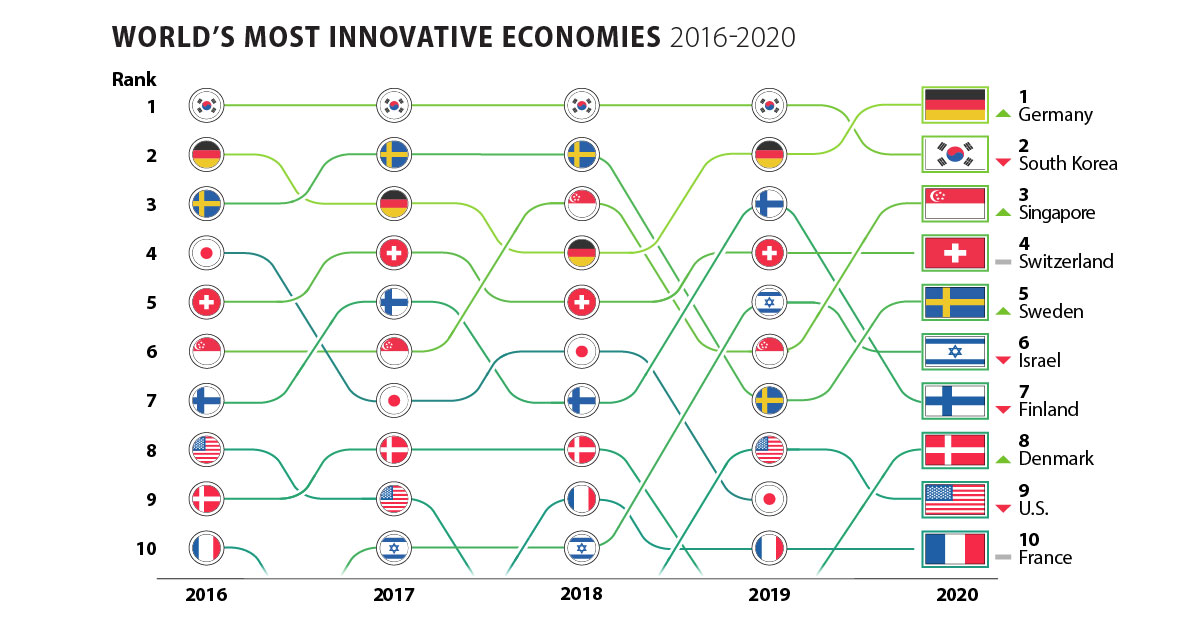


Chart of the Week
The Road to Recovery: Which Economies are Reopening?
We look at mobility rates as well as COVID-19 recovery rates for 41 economies, to see which countries are reopening for business.

The Road to Recovery: Which Economies are Reopening?
COVID-19 has brought the world to a halt—but after months of uncertainty, it seems that the situation is slowly taking a turn for the better.
Today’s chart measures the extent to which 41 major economies are reopening, by plotting two metrics for each country: the mobility rate and the COVID-19 recovery rate:
- Mobility Index
This refers to the change in activity around workplaces, subtracting activity around residences, measured as a percentage deviation from the baseline. - COVID-19 Recovery Rate
The number of recovered cases in a country is measured as the percentage of total cases.
Data for the first measure comes from Google’s COVID-19 Community Mobility Reports, which relies on aggregated, anonymous location history data from individuals. Note that China does not show up in the graphic as the government bans Google services.
COVID-19 recovery rates rely on values from CoronaTracker, using aggregated information from multiple global and governmental databases such as WHO and CDC.
Reopening Economies, One Step at a Time
In general, the higher the mobility rate, the more economic activity this signifies. In most cases, mobility rate also correlates with a higher rate of recovered people in the population.
Here’s how these countries fare based on the above metrics.
| Country | Mobility Rate | Recovery Rate | Total Cases | Total Recovered |
|---|---|---|---|---|
| Argentina | -56% | 31.40% | 14,702 | 4,617 |
| Australia | -41% | 92.03% | 7,150 | 6,580 |
| Austria | -100% | 91.93% | 16,628 | 15,286 |
| Belgium | -105% | 26.92% | 57,849 | 15,572 |
| Brazil | -48% | 44.02% | 438,812 | 193,181 |
| Canada | -67% | 52.91% | 88,512 | 46,831 |
| Chile | -110% | 41.58% | 86,943 | 36,150 |
| Colombia | -73% | 26.28% | 25,366 | 6,665 |
| Czechia | -29% | 70.68% | 9,140 | 6,460 |
| Denmark | -93% | 88.43% | 11,512 | 10,180 |
| Finland | -93% | 81.57% | 6,743 | 5,500 |
| France | -100% | 36.08% | 186,238 | 67,191 |
| Germany | -99% | 89.45% | 182,452 | 163,200 |
| Greece | -32% | 47.28% | 2,906 | 1,374 |
| Hong Kong | -10% | 97.00% | 1,067 | 1,035 |
| Hungary | -49% | 52.31% | 3,816 | 1,996 |
| India | -65% | 42.88% | 165,386 | 70,920 |
| Indonesia | -77% | 25.43% | 24,538 | 6,240 |
| Ireland | -79% | 88.92% | 24,841 | 22,089 |
| Israel | -31% | 87.00% | 16,872 | 14,679 |
| Italy | -52% | 64.99% | 231,732 | 150,604 |
| Japan | -33% | 84.80% | 16,683 | 14,147 |
| Malaysia | -53% | 80.86% | 7,629 | 6,169 |
| Mexico | -69% | 69.70% | 78,023 | 54,383 |
| Netherlands | -97% | 0.01% | 45,950 | 3 |
| New Zealand | -21% | 98.01% | 1,504 | 1,474 |
| Norway | -100% | 91.87% | 8,411 | 7,727 |
| Philippines | -87% | 23.08% | 15,588 | 3,598 |
| Poland | -36% | 46.27% | 22,825 | 10,560 |
| Portugal | -65% | 58.99% | 31,596 | 18,637 |
| Singapore | -105% | 55.02% | 33,249 | 18,294 |
| South Africa | -74% | 52.44% | 27,403 | 14,370 |
| South Korea | -4% | 91.15% | 11,344 | 10,340 |
| Spain | -67% | 69.11% | 284,986 | 196,958 |
| Sweden | -93% | 13.91% | 35,727 | 4,971 |
| Switzerland | -101% | 91.90% | 30,796 | 28,300 |
| Taiwan | 4% | 95.24% | 441 | 420 |
| Thailand | -36% | 96.08% | 3,065 | 2,945 |
| U.S. | -56% | 28.20% | 1,768,346 | 498,720 |
| United Kingdom | -82% | 0.05% | 269,127 | 135 |
| Vietnam | 15% | 85.02% | 327 | 278 |
Mobility data as of May 21, 2020 (Latest available). COVID-19 case data as of May 29, 2020.
In the main scatterplot visualization, we’ve taken things a step further, assigning these countries into four distinct quadrants:
1. High Mobility, High Recovery
High recovery rates are resulting in lifted restrictions for countries in this quadrant, and people are steadily returning to work.
New Zealand has earned praise for its early and effective pandemic response, allowing it to curtail the total number of cases. This has resulted in a 98% recovery rate, the highest of all countries. After almost 50 days of lockdown, the government is recommending a flexible four-day work week to boost the economy back up.
2. High Mobility, Low Recovery
Despite low COVID-19 related recoveries, mobility rates of countries in this quadrant remain higher than average. Some countries have loosened lockdown measures, while others did not have strict measures in place to begin with.
Brazil is an interesting case study to consider here. After deferring lockdown decisions to state and local levels, the country is now averaging the highest number of daily cases out of any country. On May 28th, for example, the country had 24,151 new cases and 1,067 new deaths.
3. Low Mobility, High Recovery
Countries in this quadrant are playing it safe, and holding off on reopening their economies until the population has fully recovered.
Italy, the once-epicenter for the crisis in Europe is understandably wary of cases rising back up to critical levels. As a result, it has opted to keep its activity to a minimum to try and boost the 65% recovery rate, even as it slowly emerges from over 10 weeks of lockdown.
4. Low Mobility, Low Recovery
Last but not least, people in these countries are cautiously remaining indoors as their governments continue to work on crisis response.
With a low 0.05% recovery rate, the United Kingdom has no immediate plans to reopen. A two-week lag time in reporting discharged patients from NHS services may also be contributing to this low number. Although new cases are leveling off, the country has the highest coronavirus-caused death toll across Europe.
The U.S. also sits in this quadrant with over 1.7 million cases and counting. Recently, some states have opted to ease restrictions on social and business activity, which could potentially result in case numbers climbing back up.
Over in Sweden, a controversial herd immunity strategy meant that the country continued business as usual amid the rest of Europe’s heightened regulations. Sweden’s COVID-19 recovery rate sits at only 13.9%, and the country’s -93% mobility rate implies that people have been taking their own precautions.
COVID-19’s Impact on the Future
It’s important to note that a “second wave” of new cases could upend plans to reopen economies. As countries reckon with these competing risks of health and economic activity, there is no clear answer around the right path to take.
COVID-19 is a catalyst for an entirely different future, but interestingly, it’s one that has been in the works for a while.
Without being melodramatic, COVID-19 is like the last nail in the coffin of globalization…The 2008-2009 crisis gave globalization a big hit, as did Brexit, as did the U.S.-China trade war, but COVID is taking it to a new level.
—Carmen Reinhart, incoming Chief Economist for the World Bank
Will there be any chance of returning to “normal” as we know it?

-

 Debt1 week ago
How Debt-to-GDP Ratios Have Changed Since 2000
-

 Markets2 weeks ago
Ranked: The World’s Top Flight Routes, by Revenue
-

 Countries2 weeks ago
Population Projections: The World’s 6 Largest Countries in 2075
-

 Markets2 weeks ago
The Top 10 States by Real GDP Growth in 2023
-

 Demographics2 weeks ago
The Smallest Gender Wage Gaps in OECD Countries
-

 United States2 weeks ago
Where U.S. Inflation Hit the Hardest in March 2024
-

 Green2 weeks ago
Top Countries By Forest Growth Since 2001
-

 United States2 weeks ago
Ranked: The Largest U.S. Corporations by Number of Employees