Green
Mapped: Where Are the World’s Most Sustainable Companies?
Where Are the World’s Most Sustainable Companies?
Everywhere you look, sustainability is permeating social, political, and business agendas.
In recent years, an impressive number of companies have stepped up to take a more active role in shaping a more sustainable future—not just in the environmental sense, but also by taking social and governance factors into consideration.
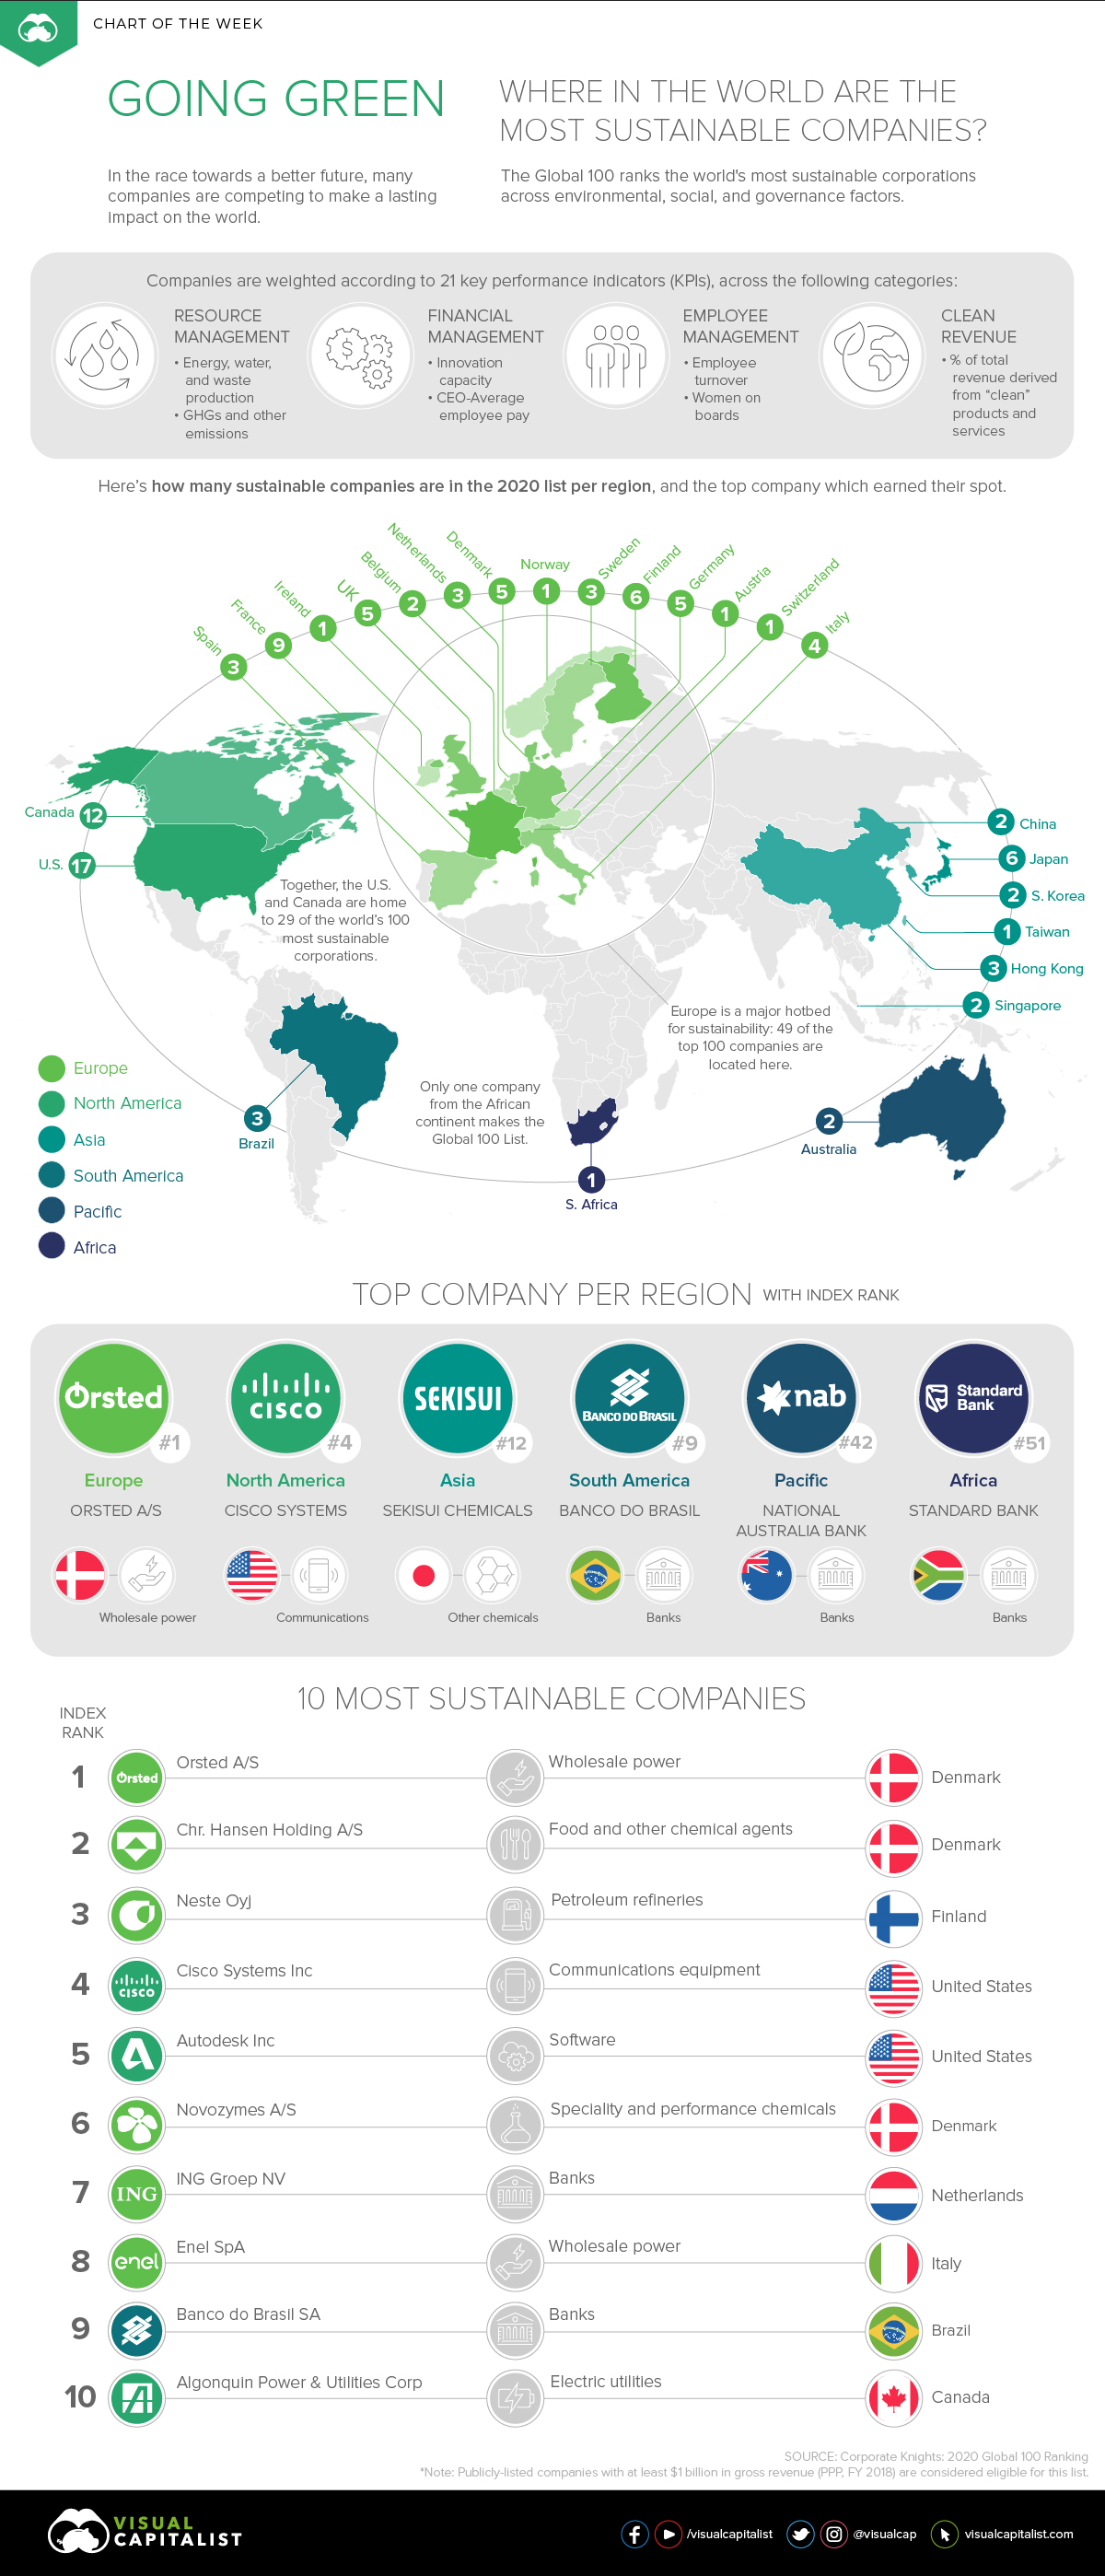
Today’s chart draws from the Corporate Knights Global 100, an annual ranking of the 100 most sustainable companies, to visualize exactly how many are located in each corner of the world. The companies on the list are clear winners not only because they aim to leave the world a better place, but because their stocks have also outperformed the market on average.
How is Corporate Sustainability Measured?
The researchers rely on readily available data for all publicly-listed companies with at least $1 billion in gross revenue (in PPP), as of the financial year 2018.
Companies are then screened for several key performance indicators (KPIs), including but not limited to the following categories and examples:
- Resource management
Example: GHGs and other emissions such as NOx and SOx emissions - Financial management
Example: Innovation capacity, or the percentage of R&D spending against total revenue - Employee management
Example: Women in executive management and/or on boards - Clean revenue
Example: The percentage of total revenue derived from “clean” products and services
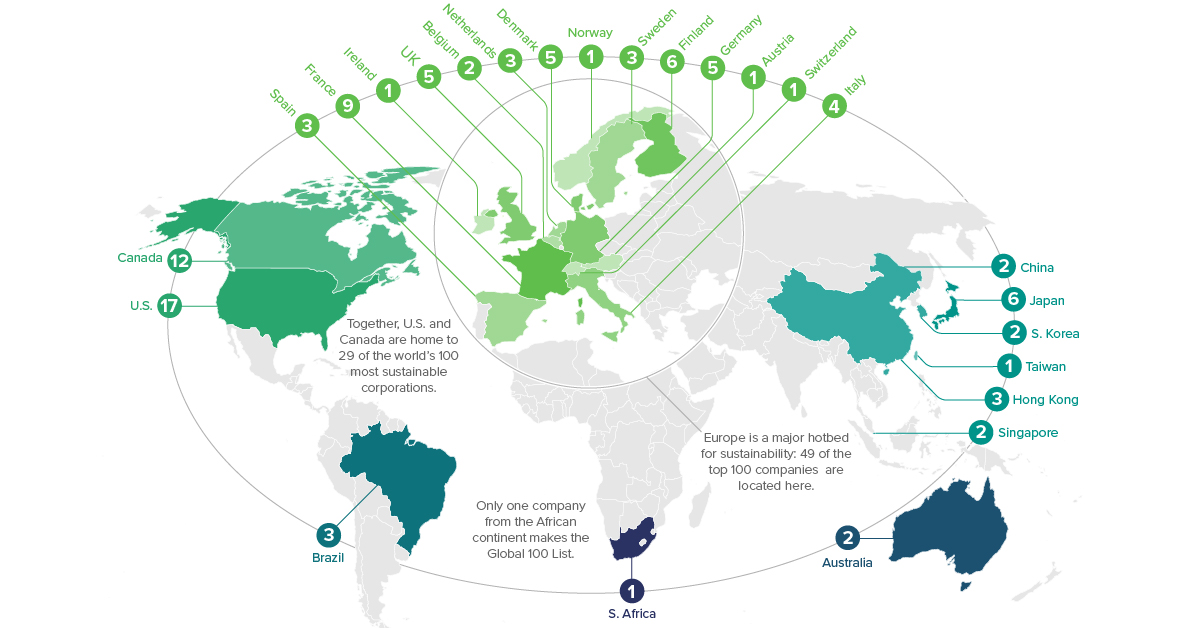
The concentration of the most sustainable companies also varies greatly depending on where you look. Here’s a closer view of every region.
Europe: 49/100 Sustainable Companies
Europe is front-and-center in the tidal shift towards more sustainable business, driven by far-reaching regulations. With this in mind, it’s perhaps not surprising to see that Europe is a hotbed of activity.
Nearly half the world’s most sustainable companies are located in Europe. France paves the way with nine sustainable companies in the ranking, followed by Finland with six companies of 100.
| Rank | Company | Industry | Country |
|---|---|---|---|
| #1 | Ørsted A/S | Wholesale Power | 🇩🇰 Denmark |
| #2 | Chr. Hansen Holding A/S | Food and other chemical agents | 🇩🇰 Denmark |
| #3 | Neste Oyj | Petroleum Refineries | 🇫🇮 Finland |
| #6 | Novozymes A/S | Specialty and Performance Chemicals | 🇩🇰 Denmark |
| #7 | ING Groep NV | Banks | 🇳🇱 Netherlands |
| #8 | Enel SpA | Wholesale Power | 🇮🇹 Italy |
| #11 | Osram Licht AG | Electrical Equipment and Power Systems | 🇩🇪 Germany |
| #13 | Storebrand ASA | Insurance | 🇳🇴 Norway |
| #14 | Umicore SA | Primary Metals Products | 🇧🇪 Belgium |
| #17 | Iberdrola SA | Wholesale Power | 🇪🇸 Spain |
| #18 | Outotec Oyj | Machinery Manufacturing | 🇫🇮 Finland |
| #20 | Accenture PLC | Technology Consulting Services | 🇮🇪 Ireland |
| #21 | Dassault Systemes SE | Software | 🇫🇷 France |
| #23 | Kering SA | Apparel and Accessory Products | 🇫🇷 France |
| #24 | UPM-Kymmene Oyj | Forestry and Paper Products | 🇫🇮 Finland |
| #27 | H & M Hennes & Mauritz AB | Apparel and Accessories Retail | 🇸🇪 Sweden |
| #28 | Sanofi SA | Biopharmaceuticals | 🇫🇷 France |
| #29 | Schneider Electric SE | Industrial Conglomerates | 🇫🇷 France |
| #31 | BNP Paribas SA | Banks | 🇫🇷 France |
| #32 | Kone Oyj | Machinery Manufacturing | 🇫🇮 Finland |
| #33 | Verbund AG | Wholesale Power | 🇦🇹 Austria |
| #34 | Valeo SA | Consumer Vehicles and Parts | 🇫🇷 France |
| #35 | ERG S.p.A. | Wholesale Power | 🇮🇹 Italy |
| #37 | Vestas Wind Systems A/S | Electrical Equipment and Power Systems | 🇩🇰 Denmark |
| #38 | bioMérieux | Diagnostics and Drug Delivery Devices | 🇫🇷 France |
| #39 | Intesa Sanpaolo SpA | Banks | 🇮🇹 Italy |
| #40 | Koninklijke KPN NV | Wireless and Wireline Telecomm. Services | 🇳🇱 Netherlands |
| #41 | Siemens AG | Industrial Conglomerates | 🇩🇪 Germany |
| #45 | Koninklijke DSM NV | Food and other chemical agents | 🇳🇱 Netherlands |
| #46 | Unilever PLC | Personal Care and Cleaning Products | 🇬🇧 UK |
| #52 | Ericsson | Communications Equipment | 🇸🇪 Sweden |
| #55 | Adidas AG | Apparel and Accessory Products | 🇩🇪 Germany |
| #56 | AstraZeneca PLC | Biopharmaceuticals | 🇬🇧 UK |
| #59 | Commerzbank AG | Banks | 🇩🇪 Germany |
| #61 | Abb Ltd | Industrial Conglomerates | 🇨🇭 Switzerland |
| #64 | Pearson PLC | Personal Professional Services | 🇬🇧 UK |
| #65 | BT Group PLC | Wireless and Wireline Telecomm. Services | 🇬🇧 UK |
| #66 | Metso Oyj | Machinery Manufacturing | 🇫🇮 Finland |
| #69 | Assicurazioni Generali SpA | Insurance | 🇮🇹 Italy |
| #70 | Acciona SA | Facilities and Construction Services | 🇪🇸 Spain |
| #71 | Novo Nordisk A/S | Biopharmaceuticals | 🇩🇰 Denmark |
| #73 | Skandinaviska Enskilda Banken AB | Banks | 🇸🇪 Sweden |
| #76 | Ucb S.A. | Biopharmaceuticals | 🇧🇪 Belgium |
| #79 | GlaxoSmithKline PLC | Biopharmaceuticals | 🇬🇧 UK |
| #87 | BASF SE | Specialty and Performance Chemicals | 🇩🇪 Germany |
| #94 | Industria de Diseno Textil SA | Apparel and Accessories Retail | 🇪🇸 Spain |
| #98 | L'Oreal SA | Personal Care and Cleaning Products | 🇫🇷 France |
| #99 | Kesko Corporation | Food and Beverage Retail | 🇫🇮 Finland |
| #100 | Amundi SA | Investment Services | 🇫🇷 France |
Denmark’s Ørsted A/S claims the top of the leaderboard in 2020. Within a decade, the company has completely transformed its business model—shifting away from the Danish Oil and Natural Gas (DONG) company into a pure play renewable energy company. The company recognized the importance of this transition:
Running the company just for profit doesn’t make sense, but running it just for a bigger purpose is also not sustainable in the long term. Doing good and doing well must go together.
—Henrik Poulsen, CEO
Just 10 years ago, DONG was 85%-fossil fuel based, and only 15%-renewables based. Today, Ørsted has flipped these proportions. The company attributes its dramatic transformation to the societal demand for green energy, and aims to be carbon-neutral by 2025.
North America: 29/100 Sustainable Companies
In this region, the U.S. alone is responsible for 17 of the top 100 sustainable companies in the world. What’s more, of the 28 new companies to the 2020 Ranking, Canada is the homebase for nine of these entrants.
| Rank | Company | Industry | Country |
|---|---|---|---|
| #4 | Cisco Systems Inc | Communications Equipment | 🇺🇸 U.S. |
| #5 | Autodesk Inc | Software | 🇺🇸 U.S. |
| #10 | Algonquin Power & Utilities Corp | Electric Utilities | 🇨🇦 CA |
| #15 | Hewlett Packard Enterprise Co | Computer Hardware | 🇺🇸 U.S. |
| #16 | American Water | Water Utilities | 🇺🇸 U.S. |
| #22 | McCormick & Company | Food and Beverage Production | 🇺🇸 U.S. |
| #26 | Prologis Inc | Real Estate Investment Trusts (REITs) | 🇺🇸 U.S. |
| #44 | Bombardier Inc | Aerospace and Defense Manufacturing | 🇨🇦 CA |
| #47 | Sims Metal Management Ltd | Primary Metals Products | 🇺🇸 U.S. |
| #48 | Bank of Montreal | Banks | 🇨🇦 CA |
| #49 | Cascades Inc | Containers and Packaging | 🇨🇦 CA |
| #53 | Danaher Corporation | Medical Devices | 🇺🇸 U.S. |
| #54 | Canadian National Railway Co | Cargo Transportation and Infrastructure Services | 🇨🇦 CA |
| #57 | Stantec Inc | Facilities and Construction Services | 🇨🇦 CA |
| #58 | HP Inc | Computer Peripherals and Systems | 🇺🇸 U.S. |
| #60 | Sun Life Financial Inc | Insurance | 🇨🇦 CA |
| #62 | Alphabet Inc | Internet and Data Services | 🇺🇸 U.S. |
| #67 | Comerica Incorporated | Banks | 🇺🇸 U.S. |
| #74 | Tesla Inc | Consumer Vehicles and Parts | 🇺🇸 U.S. |
| #77 | Workday Inc | Software | 🇺🇸 U.S. |
| #78 | Merck & Co Inc | Biopharmaceuticals | 🇺🇸 U.S. |
| #81 | Intel Corporation | Semiconductor Manufacturing | 🇺🇸 U.S. |
| #82 | Analog Devices Inc | Semiconductor Manufacturing | 🇺🇸 U.S. |
| #83 | IGM Financial Inc | Investment Services | 🇨🇦 CA |
| #84 | Canadian Solar Inc | Electrical Equipment and Power Systems | 🇨🇦 CA |
| #88 | Cogeco Communications Inc | Wireless and Wireline Telecomm. Services | 🇨🇦 CA |
| #91 | Teck Resources Ltd. | Metal Ore Mining | 🇨🇦 CA |
| #93 | Campbell Soup | Food and Beverage Production | 🇺🇸 U.S. |
| #96 | Telus Corp. | Wireless and Wireline Telecomm. Services | 🇨🇦 CA |
Cisco Systems comes in fourth worldwide, partly as a result of its clean revenues worth a stunning $25 billion. Not far behind is Autodesk, which rose an impressive 43 places since 2019. The main factor behind this leap? The software corporation now operates its cloud platforms using 99% renewable energy.
Asia: 16/100 Sustainable Companies
Over in Asia, Japan is a clear leader, boasting six sustainable companies in the list. Interestingly, the companies are from a wide range of industries, from computers (Panasonic) to cars (Toyota).
| Rank | Company | Industry | Country |
|---|---|---|---|
| #12 | Sekisui Chemicals | Other Materials | 🇯🇵 Japan |
| #25 | Taiwan Semiconductor | Semiconductor Equipment and Services | 🇹🇼 Taiwan |
| #36 | City Developments Ltd | Real Estate Investment and Services | 🇸🇬 Singapore |
| #43 | Shinhan Financial Group | Banks | 🇰🇷 South Korea |
| #50 | Advantech | Computer Hardware | 🇹🇼 Taiwan |
| #63 | Capitaland Limited | Real Estate Investment and Services | 🇸🇬 Singapore |
| #68 | Takeda Pharmaceutical | Biopharmaceuticals | 🇯🇵 Japan |
| #72 | Konica Minolta | Computer Peripherals and Systems | 🇯🇵 Japan |
| #80 | Samsung | Electrical Equipment and Power Systems | 🇰🇷 South Korea |
| #85 | BYD Co. | Consumer Vehicles and Parts | 🇨🇳 China |
| #86 | Kao Corp. | Personal Care and Cleaning Products | 🇯🇵 Japan |
| #89 | Panasonic Corp. | Computer Hardware | 🇯🇵 Japan |
| #90 | Vitasoy | Food and Beverage Production | 🇭🇰 Hong Kong |
| #92 | Toyota Motor Corp. | Consumer Vehicles and Parts | 🇯🇵 Japan |
| #95 | Singtel | Wireless and Wireline Telecomm. Services | 🇸🇬 Singapore |
| #97 | Lenovo Group | Computer Peripherals and Systems | 🇨🇳 China |
Japanese plastics manufacturer Sekisui Chemicals comes in first in Asia, after an immense improvement of 77 positions in just one year. The company builds environmentally-friendly housing, and 28% of its revenue aligns with the UN’s Sustainable Development Goals (SDGs).
Rest of the World: 6/100 Sustainable Companies
There are a few notable mentions in other regions, too. Brazil’s Banco do Brasil remains in the top ten list, and is one of the three most sustainable companies in all of South America.
| Rank | Company | Industry | Country |
|---|---|---|---|
| #9 | Banco do Brasil SA | Banks | 🇧🇷 Brazil |
| #19 | CEMIG | Electric Utilities | 🇧🇷 Brazil |
| #30 | Natura Cosmeticos SA | Personal Care and Cleaning Products | 🇧🇷 Brazil |
| #42 | National Australia Bank Ltd | Banks | 🇦🇺 Australia |
| #51 | Standard Bank Group Ltd | Banks | 🇿🇦 South Africa |
| #75 | Westpac Banking Corp | Banks | 🇦🇺 Australia |
More than half of the companies in these remaining regions are banks. Incidentally, financial services are the biggest group in the Global 100 overall.
The Best of Both Worlds
As it turns out, you can have your cake and eat it, too.
Altogether, the Global 100 most sustainable companies have consistently outperformed*, and outlasted the average company in the MSCI ACWI (All Country World Index):
| Metric | G100 | MSCI ACWI |
|---|---|---|
| Annualized Return | 7.3% | 7.0% |
| Average Company Age | 83 years | 49 years |
*Between 2005-Dec. 31 2019
Corporate sustainability is a significant driving force for urgent climate action, and the sustainable companies on this list acknowledge the triple bottom line of not just making profit, but also creating a lasting impact on people and the planet.


Green
The Carbon Footprint of Major Travel Methods
Going on a cruise ship and flying domestically are the most carbon-intensive travel methods.


The Carbon Footprint of Major Travel Methods
This was originally posted on our Voronoi app. Download the app for free on iOS or Android and discover incredible data-driven charts from a variety of trusted sources.
Did you know that transport accounts for nearly one-quarter of global energy-related carbon dioxide (CO₂) emissions?
This graphic illustrates the carbon footprints of major travel methods measured in grams of carbon dioxide equivalent (CO₂e) emitted per person to travel one kilometer. This includes both CO₂ and other greenhouse gases.
Data is sourced from Our World in Data, the UK Government’s Department for Energy Security and Net Zero, and The International Council on Clean Transportation, as of December 2022.
These figures should be interpreted as approximations, rather than exact numbers. There are many variables at play that determine the actual carbon footprint in any individual case, including vehicle type or model, occupancy, energy mix, and even weather.
Cruise Ships are the Most Carbon-Intensive Travel Method
According to these estimates, taking a cruise ship, flying domestically, and driving alone are some of the most carbon-intensive travel methods.
Cruise ships typically use heavy fuel oil, which is high in carbon content. The average cruise ship weighs between 70,000 to 180,000 metric tons, meaning they require large engines to get moving.
These massive vessels must also generate power for onboard amenities such as lighting, air conditioning, and entertainment systems.
Short-haul flights are also considered carbon-intensive due to the significant amount of fuel consumed during initial takeoff and climbing altitude, relative to a lower amount of cruising.
| Transportation method | CO₂ equivalent emissions per passenger km |
|---|---|
| Cruise Ship | 250 |
| Short-haul flight (i.e. within a U.S. state or European country) | 246 |
| Diesel car | 171 |
| Gas car | 170 |
| Medium-haul flight (i.e. international travel within Europe, or between U.S. states) | 151 |
| Long-haul flight (over 3,700 km, about the distance from LA to NY) | 147 |
| Motorbike | 113 |
| Bus (average) | 96 |
| Plug-in hybrid | 68 |
| Electric car | 47 |
| National rail | 35 |
| Tram | 28 |
| London Underground | 27 |
| Ferry (foot passenger) | 19 |
| Eurostar (International rail) | 4.5 |
Are EVs Greener?
Many experts agree that EVs produce a lower carbon footprint over time versus traditional internal combustion engine (ICE) vehicles.
However, the batteries in electric vehicles charge on the power that comes straight off the electrical grid—which in many places may be powered by fossil fuels. For that reason, the carbon footprint of an EV will depend largely on the blend of electricity sources used for charging.
There are also questions about how energy-intensive it is to build EVs compared to a comparable ICE vehicle.

-

 Debt1 week ago
How Debt-to-GDP Ratios Have Changed Since 2000
-

 Markets2 weeks ago
Ranked: The World’s Top Flight Routes, by Revenue
-

 Countries2 weeks ago
Population Projections: The World’s 6 Largest Countries in 2075
-

 Markets2 weeks ago
The Top 10 States by Real GDP Growth in 2023
-

 Demographics2 weeks ago
The Smallest Gender Wage Gaps in OECD Countries
-

 Economy2 weeks ago
Where U.S. Inflation Hit the Hardest in March 2024
-

 Green2 weeks ago
Top Countries By Forest Growth Since 2001
-

 United States2 weeks ago
Ranked: The Largest U.S. Corporations by Number of Employees