Markets
The Dominance of U.S. Companies in Global Markets
U.S. Companies Dominate Global Markets
Are global indexes as “global” as you think they are?
With the aim of tracking market performance around the world, these indexes incorporate securities from various regions. However, while the number of securities may be relatively well diversified across countries, a dollar perspective tells a different story. When market capitalization is taken into account, country weightings may become much more unbalanced.
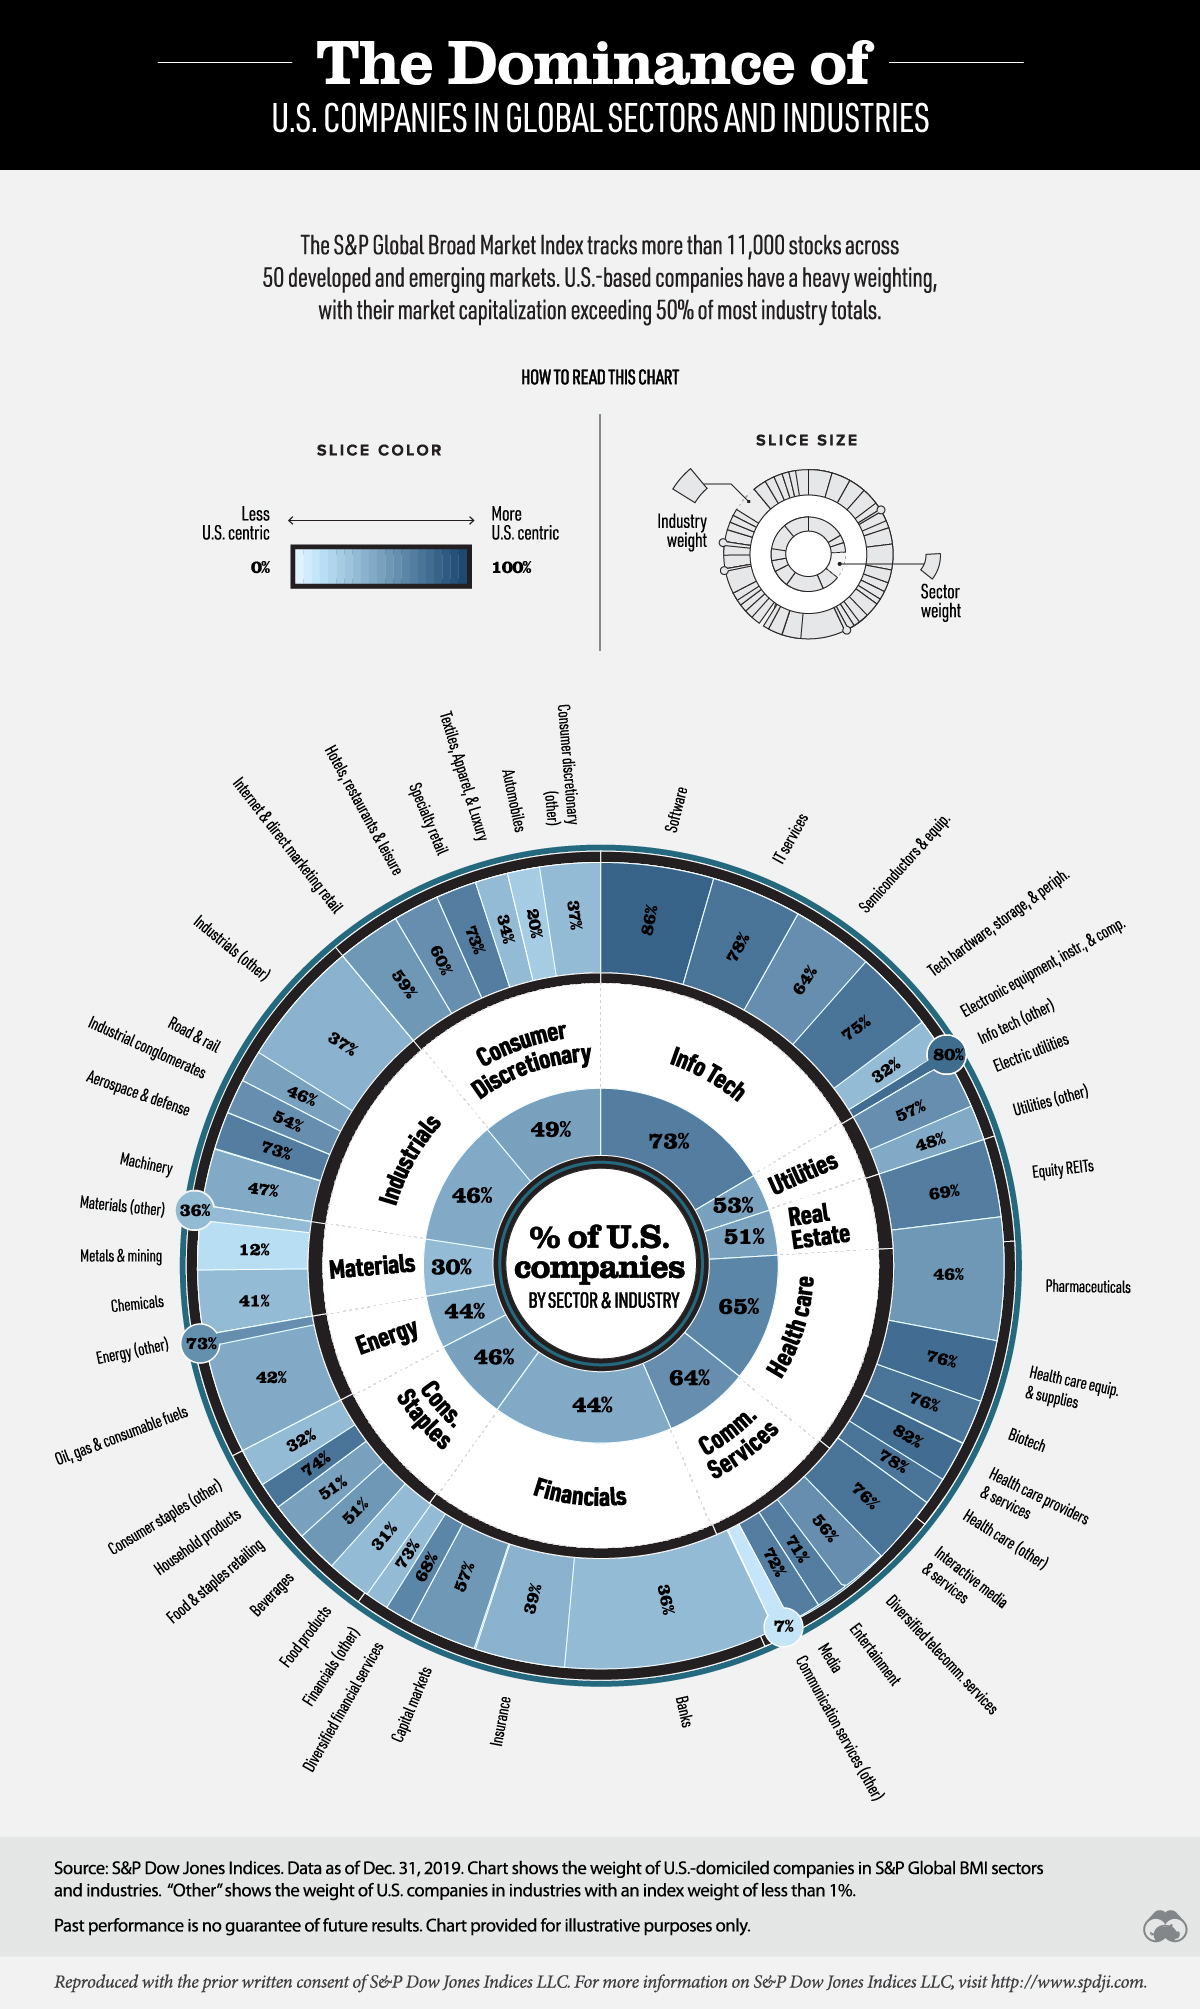
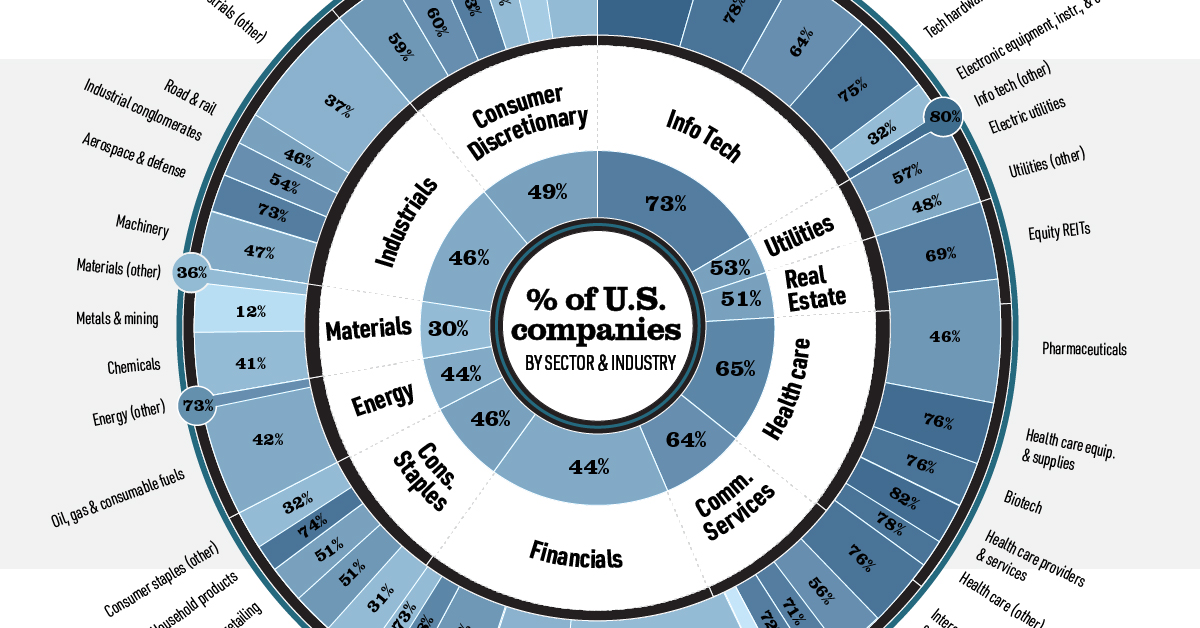
Today’s visualization is based on a concept by S&P Dow Jones Indices that shows the percentage of U.S.-based companies in global sectors and industries as of December 31, 2019. The calculations reflect the market capitalization of companies in the S&P Global Broad Market Index (BMI), an index that tracks over 11,000 stocks across 50 developed and emerging economies.
Percentage of U.S. Companies by Sector
U.S-based companies—those that maintain their primary business affairs in the U.S.—are a major component of many global sectors and industries.
Here’s how it breaks down:
| Sector | % of U.S.-based Companies | Most U.S.-heavy Subsector |
|---|---|---|
| Information technology | 73% | Software (86%) |
| Health care | 65% | Health care providers (82%) |
| Utilities | 53% | Electric utilities (57%) |
| Real estate | 51% | Equity REITs (69%) |
| Consumer discretionary | 49% | Specialty retail (73%) |
| Consumer staples | 46% | Household products (74%) |
| Industrials | 46% | Aerospace & defense (73%) |
| Energy | 44% | Energy - other (73%) |
| Financials | 44% | Financials - other (73%) |
| Materials | 30% | Chemicals (41%) |
U.S.-based companies make up a staggering 73% of the information technology (IT) sector. However, China may soon threaten this dominance. The Made in China 2025 plan highlights new-generation IT as a priority sector for the country.
The U.S. is still the world’s leader, but China is coming up very fast.
—Rebecca Fannin, Journalist & Author of Tech Titans of China
Healthcare is also heavily skewed towards U.S-based stocks, which make up 65% of the sector’s market capitalization. This weighting is perhaps not surprising given the success of many U.S. healthcare companies. In Fortune’s list of the 500 most profitable U.S. companies, 41 healthcare organizations made the cut.
The materials sector has the smallest weighting of U.S.-based stocks, but they still account for almost one-third of the overall market capitalization. Three American companies are in the sector’s top 10 holdings: Air Products & Chemicals, Ecolab, and Sherwin-Williams.
U.S. Equity Views in a Global Context
Given the high weighting of U.S. stocks in global sectors and industries, having a U.S. view is important. This refers to investors gaining a clear perspective on the risks and opportunities that exist in the country. Investors can consider the trends influencing American companies in order to help explain stock performance.
U.S. stock dominance also impacts geographic diversification. While it helps non-U.S. investors overcome their home bias, American investors may want to consider targeting specific international markets for well-rounded exposure.


Markets
The European Stock Market: Attractive Valuations Offer Opportunities
On average, the European stock market has valuations that are nearly 50% lower than U.S. valuations. But how can you access the market?


European Stock Market: Attractive Valuations Offer Opportunities
Europe is known for some established brands, from L’Oréal to Louis Vuitton. However, the European stock market offers additional opportunities that may be lesser known.
The above infographic, sponsored by STOXX, outlines why investors may want to consider European stocks.
Attractive Valuations
Compared to most North American and Asian markets, European stocks offer lower or comparable valuations.
| Index | Price-to-Earnings Ratio | Price-to-Book Ratio |
|---|---|---|
| EURO STOXX 50 | 14.9 | 2.2 |
| STOXX Europe 600 | 14.4 | 2 |
| U.S. | 25.9 | 4.7 |
| Canada | 16.1 | 1.8 |
| Japan | 15.4 | 1.6 |
| Asia Pacific ex. China | 17.1 | 1.8 |
Data as of February 29, 2024. See graphic for full index names. Ratios based on trailing 12 month financials. The price to earnings ratio excludes companies with negative earnings.
On average, European valuations are nearly 50% lower than U.S. valuations, potentially offering an affordable entry point for investors.
Research also shows that lower price ratios have historically led to higher long-term returns.
Market Movements Not Closely Connected
Over the last decade, the European stock market had low-to-moderate correlation with North American and Asian equities.
The below chart shows correlations from February 2014 to February 2024. A value closer to zero indicates low correlation, while a value of one would indicate that two regions are moving in perfect unison.
| EURO STOXX 50 | STOXX EUROPE 600 | U.S. | Canada | Japan | Asia Pacific ex. China |
|
|---|---|---|---|---|---|---|
| EURO STOXX 50 | 1.00 | 0.97 | 0.55 | 0.67 | 0.24 | 0.43 |
| STOXX EUROPE 600 | 1.00 | 0.56 | 0.71 | 0.28 | 0.48 | |
| U.S. | 1.00 | 0.73 | 0.12 | 0.25 | ||
| Canada | 1.00 | 0.22 | 0.40 | |||
| Japan | 1.00 | 0.88 | ||||
| Asia Pacific ex. China | 1.00 |
Data is based on daily USD returns.
European equities had relatively independent market movements from North American and Asian markets. One contributing factor could be the differing sector weights in each market. For instance, technology makes up a quarter of the U.S. market, but health care and industrials dominate the broader European market.
Ultimately, European equities can enhance portfolio diversification and have the potential to mitigate risk for investors.
Tracking the Market
For investors interested in European equities, STOXX offers a variety of flagship indices:
| Index | Description | Market Cap |
|---|---|---|
| STOXX Europe 600 | Pan-regional, broad market | €10.5T |
| STOXX Developed Europe | Pan-regional, broad-market | €9.9T |
| STOXX Europe 600 ESG-X | Pan-regional, broad market, sustainability focus | €9.7T |
| STOXX Europe 50 | Pan-regional, blue-chip | €5.1T |
| EURO STOXX 50 | Eurozone, blue-chip | €3.5T |
Data is as of February 29, 2024. Market cap is free float, which represents the shares that are readily available for public trading on stock exchanges.
The EURO STOXX 50 tracks the Eurozone’s biggest and most traded companies. It also underlies one of the world’s largest ranges of ETFs and mutual funds. As of November 2023, there were €27.3 billion in ETFs and €23.5B in mutual fund assets under management tracking the index.
“For the past 25 years, the EURO STOXX 50 has served as an accurate, reliable and tradable representation of the Eurozone equity market.”
— Axel Lomholt, General Manager at STOXX
Partnering with STOXX to Track the European Stock Market
Are you interested in European equities? STOXX can be a valuable partner:
- Comprehensive, liquid and investable ecosystem
- European heritage, global reach
- Highly sophisticated customization capabilities
- Open architecture approach to using data
- Close partnerships with clients
- Part of ISS STOXX and Deutsche Börse Group
With a full suite of indices, STOXX can help you benchmark against the European stock market.
Learn how STOXX’s European indices offer liquid and effective market access.

-

 Economy2 days ago
Economic Growth Forecasts for G7 and BRICS Countries in 2024
The IMF has released its economic growth forecasts for 2024. How do the G7 and BRICS countries compare?
-

 Markets1 week ago
U.S. Debt Interest Payments Reach $1 Trillion
U.S. debt interest payments have surged past the $1 trillion dollar mark, amid high interest rates and an ever-expanding debt burden.
-

 United States2 weeks ago
Ranked: The Largest U.S. Corporations by Number of Employees
We visualized the top U.S. companies by employees, revealing the massive scale of retailers like Walmart, Target, and Home Depot.
-

 Markets2 weeks ago
The Top 10 States by Real GDP Growth in 2023
This graphic shows the states with the highest real GDP growth rate in 2023, largely propelled by the oil and gas boom.
-

 Markets2 weeks ago
Ranked: The World’s Top Flight Routes, by Revenue
In this graphic, we show the highest earning flight routes globally as air travel continued to rebound in 2023.
-

 Markets2 weeks ago
Ranked: The Most Valuable Housing Markets in America
The U.S. residential real estate market is worth a staggering $47.5 trillion. Here are the most valuable housing markets in the country.


-

 Education1 week ago
How Hard Is It to Get Into an Ivy League School?
-

 Technology2 weeks ago
Ranked: Semiconductor Companies by Industry Revenue Share
-
Markets2 weeks ago
Ranked: The World’s Top Flight Routes, by Revenue
-

 Demographics2 weeks ago
Population Projections: The World’s 6 Largest Countries in 2075
-
Markets2 weeks ago
The Top 10 States by Real GDP Growth in 2023
-

 Demographics2 weeks ago
The Smallest Gender Wage Gaps in OECD Countries
-

 Economy2 weeks ago
Where U.S. Inflation Hit the Hardest in March 2024
-

 Green2 weeks ago
Top Countries By Forest Growth Since 2001