Politics
Ranked: America’s Most Searched and Visited News Sites by State
Ranked: America’s Most Searched News Sites by State
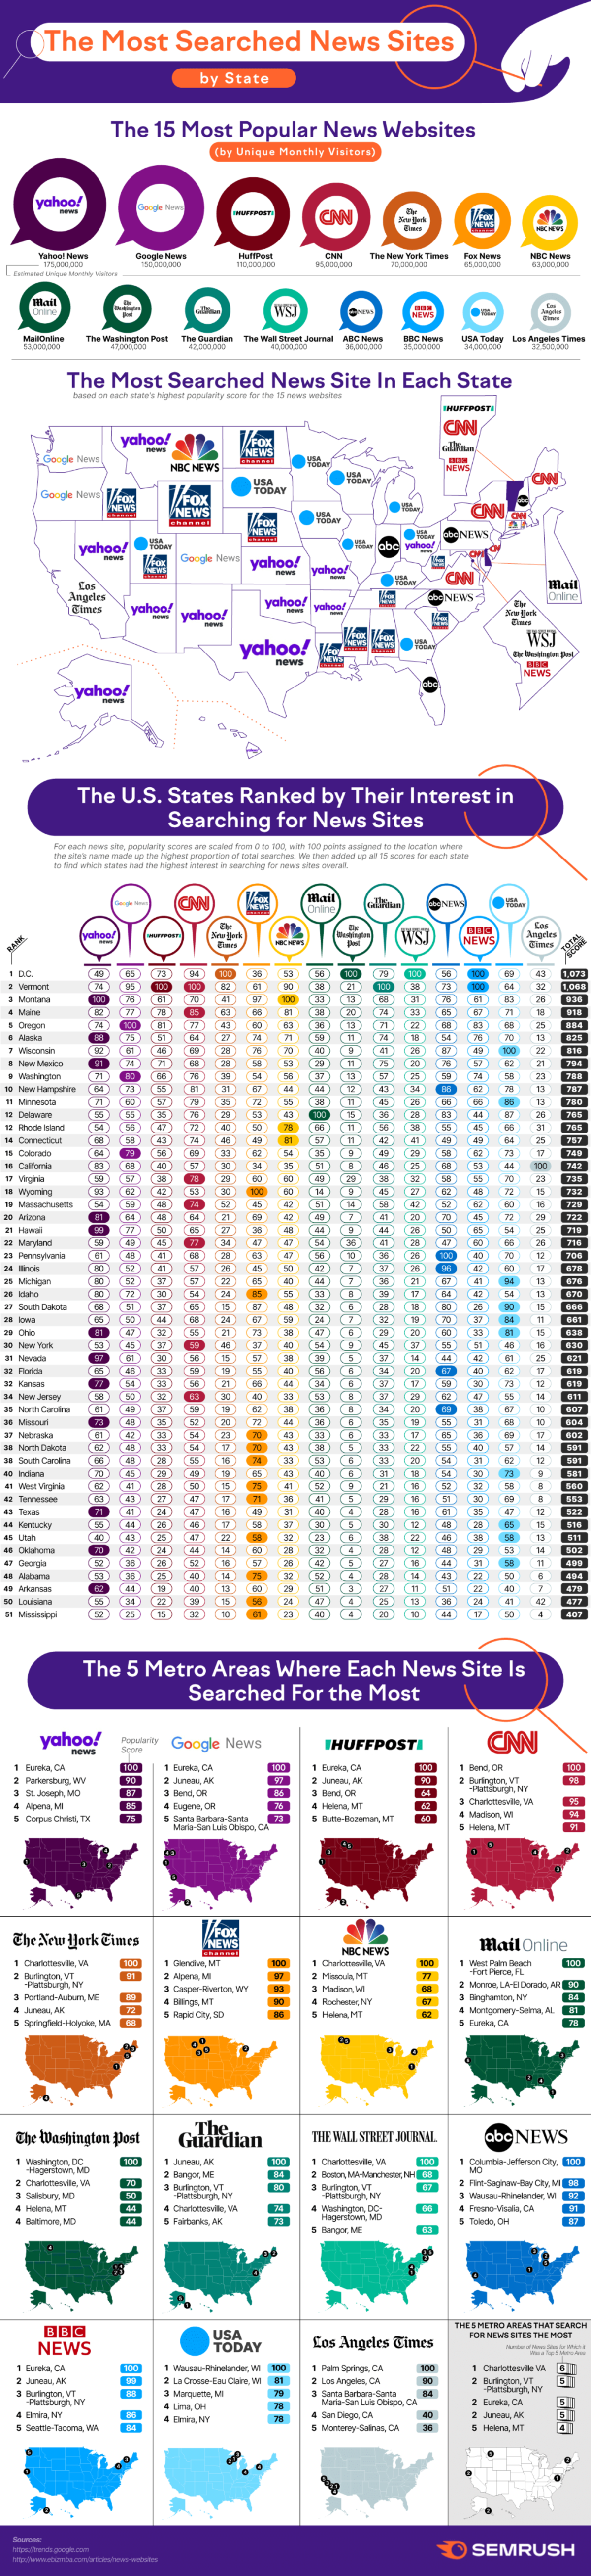
America is known to have significant distinctions at the state-by-state level, and data suggests this trend extends to popular news sources. To learn more, this infographic from SEMRush ranks U.S. news websites by search volume and popularity across U.S. states.
Here’s how the top 15 news sites compare when ranked by monthly visitors, as well as the number of states the news source is most searched for in:
| News Site | Monthly Visitors | State Search Popularity | Top Metro Area | |
|---|---|---|---|---|
| 1 | Yahoo! News | 175 million | 12 | Eureka, California (CA) |
| 2 | Google News | 150 million | 3 | Eureka, California (CA) |
| 3 | Huff Post | 110 million | 1 | Eureka, California (CA) |
| 4 | CNN | 95 million | 7 | Bend, Oregon (OR) |
| 5 | The New York Times | 70 million | 1 | Charlottesville, Virginia (VA) |
| 6 | Fox News | 65 million | 11 | Glendive, Montana (MT) |
| 7 | NBC News | 63 million | 3 | Charlottesville, Virginia (VA) |
| 8 | MailOnline | 53 million | 1 | West Palm Beach and Fort Pierce, Florida (FL) |
| 9 | The Washington Post | 47 million | 1 | Washington, DC and Hagerstown, Maryland (MD) |
| 10 | The Guardian | 42 million | 1 | Juneau, Alaska (AK) |
| 11 | The Wall Street Journal | 40 million | 1 | Charlottesville, Virginia (VA) |
| 12 | ABC News | 36 million | 5 | Columbia and Jefferson City, Missouri (MO) |
| 13 | BBC News | 35 million | 2 | Eureka, California (CA) |
| 14 | USA Today | 34 million | 10 | Wausau and Rhinelander, Wisconsin (WI) |
| 15 | Los Angeles Times | 32 million | 1 | Palm Springs, California (CA) |
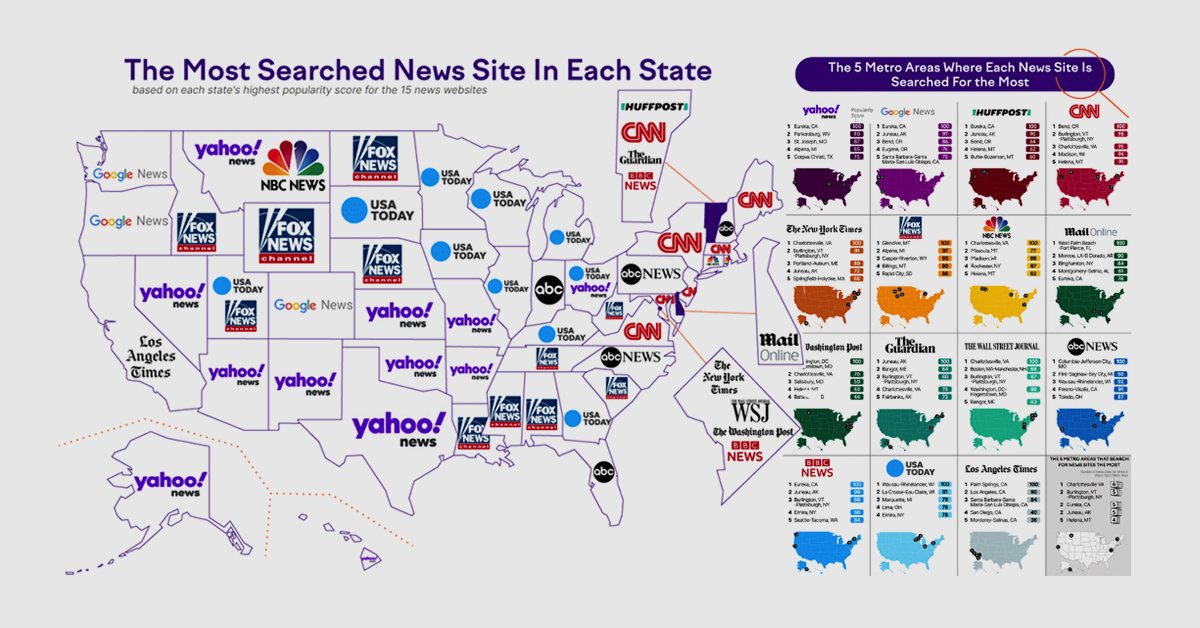
Political affiliation plays a large role in determining each state’s favored news sites. Blue states lean towards Google News and CNN, while red states overwhelmingly choose Fox News.
The Most Popular News Sites
Yahoo News is the most popular news website in America, bringing in a massive 175 million monthly visitors. In addition, they’re the most searched for news site in 12 states—the highest of any website. The company’s history has been a roller coaster ride and at different times Yahoo intended to acquire Google and Facebook. Both companies went on to be worth over $1 trillion each, while Yahoo shrank some 90% from when it was once worth $125 billion.
The New York Times has 60 million monthly visitors, but in recent years, has pivoted towards the coveted and trending paid subscription model. This decision is paying off well, as the site now has 6.1 million paid subscribers—more than any of its competitors. Consequently, the New York Times’ share price hit a record high in December 2020.
HuffPost, and their audience of 110 million, were bought by BuzzFeed from Verizon in November of 2020. The two organizations have some history together, as BuzzFeed co-founder Jonah Peretti was also one of the early founders of HuffPost.
CNN is seeing a fall in ratings ever since Donald Trump left office. By some measures has witnessed a 36% decline in primetime viewers in the new year.
Google News experiences 125 million visitors a month, ranking second overall. That said, they stand tall relative to their competitors by overall visits to their main site. Here, Google hits 92.5 billion monthly visits, while Yahoo experiences a more modest 3.8 billion. Unlike legacy media news companies, Google has managed to increase their market share of U.S. advertising revenues, due to more ads going digital.
The Modern News Landscape
Overall, the modern news industry has been a tough landscape to operate in. Here are some of the reasons why:
First, the internet has removed barriers to where people obtain information, and revenue streams have been disrupted in the process. The advertising business model of news organizations is cutthroat to compete in, and there has been plenty of consolidation and layoffs.
Lastly, trust in traditional news and media organizations has been declining amongst Americans, from nearly 60% to 46% since 2019.
| Year | A lot of Trust (%) | Some Trust (%) | Very Little/ No Trust (%) |
|---|---|---|---|
| 1994 | 35 | 37 | 27 |
| 1996 | 36 | 39 | 24 |
| 1998 | 34 | 40 | 25 |
| 2000 | 36 | 40 | 23 |
| 2002 | 35 | 43 | 21 |
| 2004 | 30 | 40 | 29 |
| 2006 | 31 | 40 | 28 |
| 2008 | 24 | 43 | 31 |
| 2010 | 22 | 41 | 36 |
| 2012 | 21 | 39 | 38 |
| 2014 | 18 | 42 | 39 |
| 2016 | 21 | 38 | 40 |
| 2018 | 20 | 34 | 45 |
| 2020 | 18 | 33 | 49 |
To add to this, on a global basis, the U.S. ranks well below most major countries based on trust in news media.
Some organizations like The Washington Post and The New York Times have opted out of the advertising model, moving towards the direction of premium subscriptions. But only 20% of the Americans pay for their news, which could lead to stiff competition down the road.
The Future Of News
There are serious concerns about the future of news in the era of spreading misinformation. Up to 43% of Americans say the media are doing a very “poor/poor job” in supporting democracy. But despite this waning trust, 84% of Americans view news media as “critical” or “very important”.
What will the future of media look like throughout the 21st century and how will this impact the most popular news sites of today?


Economy
The Bloc Effect: International Trade with Geopolitical Allies on the Rise
Rising geopolitical tensions are shaping the future of international trade, but what is the effect on trading among G7 and BRICS countries?


The Bloc Effect: International Trade with Allies on the Rise
International trade has become increasingly fragmented over the last five years as countries have shifted to trading more with their geopolitical allies.
This graphic from The Hinrich Foundation, the first in a three-part series covering the future of trade, provides visual context to the growing divide in trade in G7 and pre-expansion BRICS countries, which are used as proxies for geopolitical blocs.
Trade Shifts in G7 and BRICS Countries
This analysis uses IMF data to examine differences in shares of exports within and between trading blocs from 2018 to 2023. For example, we looked at the percentage of China’s exports with other BRICS members as well as with G7 members to see how these proportions shifted in percentage points (pp) over time.
Countries traded nearly $270 billion more with allies in 2023 compared to 2018. This shift came at the expense of trade with rival blocs, which saw a decline of $314 billion.
Country Change in Exports Within Bloc (pp) Change in Exports With Other Bloc (pp)
🇮🇳 India 0.0 3.9
🇷🇺 Russia 0.7 -3.8
🇮🇹 Italy 0.8 -0.7
🇨🇦 Canada 0.9 -0.7
🇫🇷 France 1.0 -1.1
🇪🇺 EU 1.1 -1.5
🇩🇪 Germany 1.4 -2.1
🇿🇦 South Africa 1.5 1.5
🇺🇸 U.S. 1.6 -0.4
🇯🇵 Japan 2.0 -1.7
🇨🇳 China 2.1 -5.2
🇧🇷 Brazil 3.7 -3.3
🇬🇧 UK 10.2 0.5
All shifts reported are in percentage points. For example, the EU saw its share of exports to G7 countries rise from 74.3% in 2018 to 75.4% in 2023, which equates to a 1.1 percentage point increase.
The UK saw the largest uptick in trading with other countries within the G7 (+10.2 percentage points), namely the EU, as the post-Brexit trade slump to the region recovered.
Meanwhile, the U.S.-China trade dispute caused China’s share of exports to the G7 to fall by 5.2 percentage points from 2018 to 2023, the largest decline in our sample set. In fact, partly as a result of the conflict, the U.S. has by far the highest number of harmful tariffs in place.
The Russia-Ukraine War and ensuing sanctions by the West contributed to Russia’s share of exports to the G7 falling by 3.8 percentage points over the same timeframe.
India, South Africa, and the UK bucked the trend and continued to witness advances in exports with the opposing bloc.
Average Trade Shifts of G7 and BRICS Blocs
Though results varied significantly on a country-by-country basis, the broader trend towards favoring geopolitical allies in international trade is clear.
Bloc Change in Exports Within Bloc (pp) Change in Exports With Other Bloc (pp)
Average 2.1 -1.1
BRICS 1.6 -1.4
G7 incl. EU 2.4 -1.0
Overall, BRICS countries saw a larger shift away from exports with the other bloc, while for G7 countries the shift within their own bloc was more pronounced. This implies that though BRICS countries are trading less with the G7, they are relying more on trade partners outside their bloc to make up for the lost G7 share.
A Global Shift in International Trade and Geopolitical Proximity
The movement towards strengthening trade relations based on geopolitical proximity is a global trend.
The United Nations categorizes countries along a scale of geopolitical proximity based on UN voting records.
According to the organization’s analysis, international trade between geopolitically close countries rose from the first quarter of 2022 (when Russia first invaded Ukraine) to the third quarter of 2023 by over 6%. Conversely, trade with geopolitically distant countries declined.
The second piece in this series will explore China’s gradual move away from using the U.S. dollar in trade settlements.
Visit the Hinrich Foundation to learn more about the future of geopolitical trade

-

 Economy1 day ago
Economic Growth Forecasts for G7 and BRICS Countries in 2024
The IMF has released its economic growth forecasts for 2024. How do the G7 and BRICS countries compare?
-

 United States1 week ago
Ranked: The Largest U.S. Corporations by Number of Employees
We visualized the top U.S. companies by employees, revealing the massive scale of retailers like Walmart, Target, and Home Depot.
-

 Economy2 weeks ago
Where U.S. Inflation Hit the Hardest in March 2024
We visualized product categories that saw the highest % increase in price due to U.S. inflation as of March 2024.
-

 Economy4 weeks ago
G20 Inflation Rates: Feb 2024 vs COVID Peak
We visualize inflation rates across G20 countries as of Feb 2024, in the context of their COVID-19 pandemic peak.
-

 Economy1 month ago
Mapped: Unemployment Claims by State
This visual heatmap of unemployment claims by state highlights New York, California, and Alaska leading the country by a wide margin.
-

 Economy2 months ago
Confidence in the Global Economy, by Country
Will the global economy be stronger in 2024 than in 2023?


-

 Mining1 week ago
Gold vs. S&P 500: Which Has Grown More Over Five Years?
-

 Markets2 weeks ago
Ranked: The Most Valuable Housing Markets in America
-

 Money2 weeks ago
Which States Have the Highest Minimum Wage in America?
-

 AI2 weeks ago
Ranked: Semiconductor Companies by Industry Revenue Share
-

 Markets2 weeks ago
Ranked: The World’s Top Flight Routes, by Revenue
-

 Countries2 weeks ago
Population Projections: The World’s 6 Largest Countries in 2075
-

 Markets2 weeks ago
The Top 10 States by Real GDP Growth in 2023
-

 Demographics2 weeks ago
The Smallest Gender Wage Gaps in OECD Countries