
The earthquake that shook buildings across New York in April 2024 was the third-largest quake in the Northeast U.S. over...


click for more →


Scan with your phone's camera or QR code app to view


This graphic uses data taken from latest official censuses and projections to rank the largest cities by population.
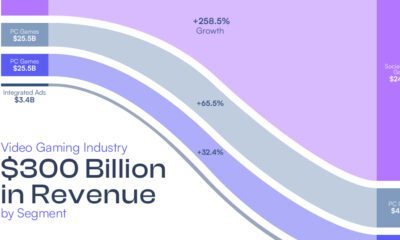

The video games industry could generate over $300 billion by 2026. Here is a break down of that revenue by source.


Gen Z job seekers are far more active than older generations, consistently looking for new work while already employed.
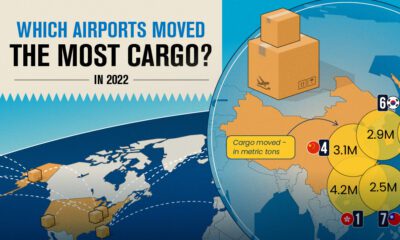

Cargo that moves through airports represents the value of around 35% of world trade. These hubs move the most cargo globally.
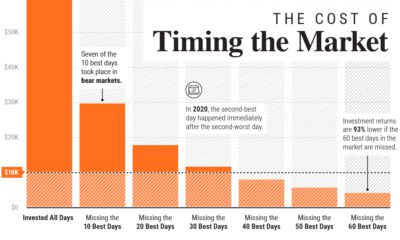

In this graphic, we show why timing the market is extremely difficult, and how it can meaningfully dent portfolio returns.


The periodic table of elements is widely recognized, but there are hundreds of beautiful and different periodic table reinterpretations.


This chart highlights the different countries, and the number of people, facing water security issues around the world.
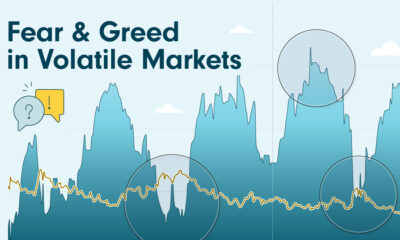

CNN's Fear & Greed Index captures investor confidence levels, usually reflecting market volatility. It increases during periods of greed in the markets and decreases when investors...
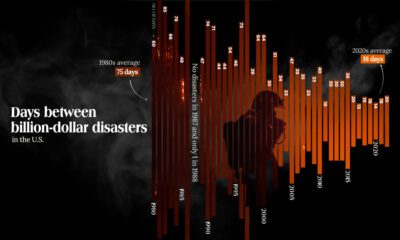

The Maui fire is the latest of many disasters in the U.S. And data shows that frequency of costly weather disasters has increased.


Join VC+ Lifetime this month and get the best visual insights for the best value. See what else VC+ members receive in August!
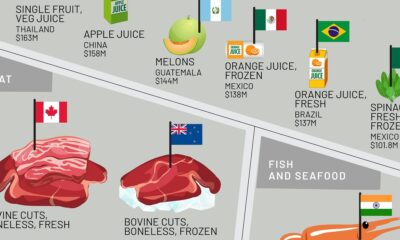

This infographic shows the top exporting countries for U.S. food imports, ranging from exotic fruits to meat, oils, spices, and more.
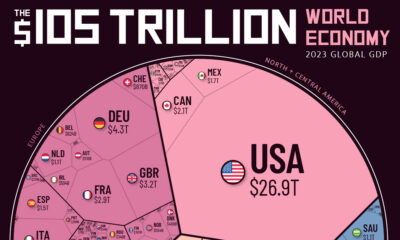

How much does each country contribute to the $105 trillion world economy in 2023, and what nations are seeing their nominal GDPs shrink?
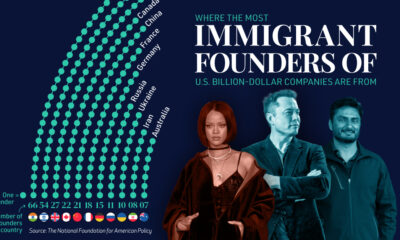

The majority of billion-dollar startups in the U.S. have at least one immigrant founder. Here is where those founders are from.
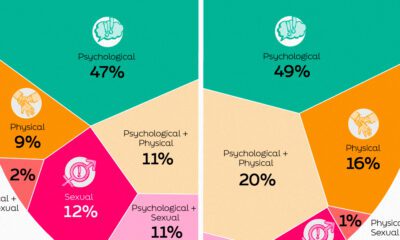

This infographic shows the types of workplace violence and harassment faced by people in the global workplace.


Internet adoption is widespread in the U.S. In fact, only 7% of Americans do not use the internet. Who are these non-adopters?
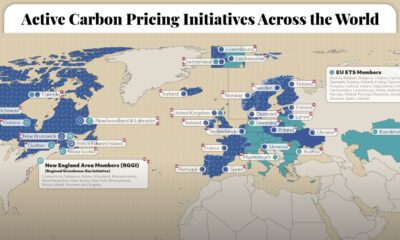

This graphic maps the 70 active carbon pricing initiatives worldwide, their established price of carbon, and the global emissions they cover.
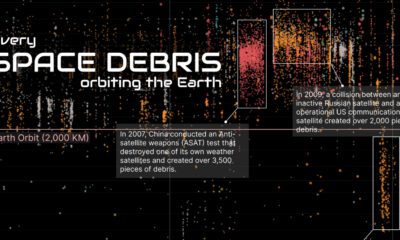

This visual breaks down just how much space debris is currently orbiting the Earth, and the nations responsible for it.


 Creator Program