Space
Visualizing the World’s Space Debris by Country Responsible
Article/Editing:
Space Debris: The Earth’s Orbiting Threat
Earlier in July, a suspicious object washed up on a remote beach in Western Australia. This chunk of golden metal was reported to be a piece of space debris that found its way back to Earth.
And it is not the only one. Today, thousands of defunct satellites, spent rocket stages, metal shards from collisions, and other remnants of human space exploration are orbiting the Earth at breakneck speeds.
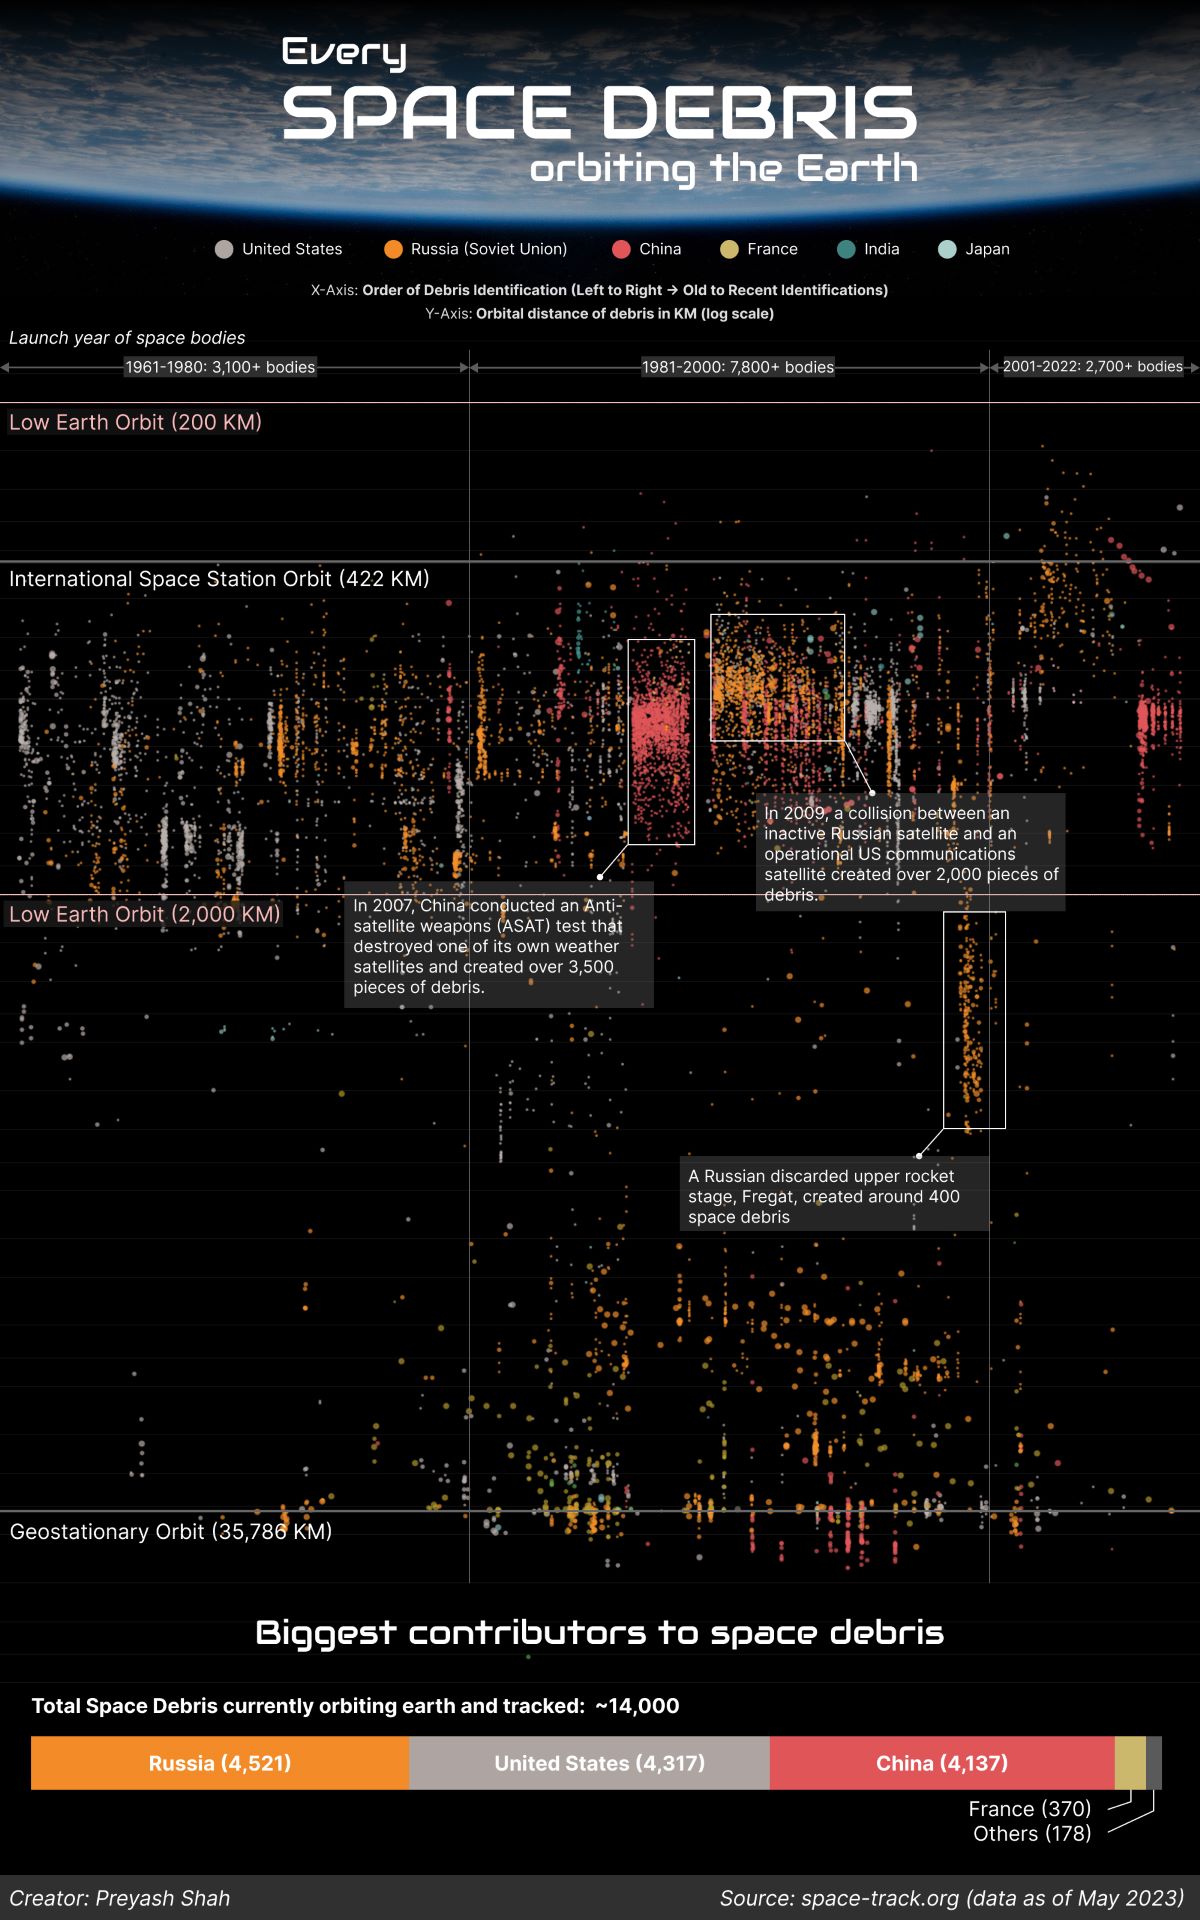
In this graphic, Preyash Shah uses tracking data from the Space-Track.org, maintained by the U.S. Space Force, to help visualize just how much debris is currently orbiting the Earth, while identifying the biggest contributors of this celestial clutter.
Note: Many spent rocket bodies are still actively tracked and controlled by their launch authorities, and the source tracks these separately. Space debris includes spent rocket bodies that are defunct and uncontrolled.
Ranked: Countries Responsible for the Most Space Debris
According to the data, there are roughly 14,000 small, medium, and large debris objects floating about in low Earth orbit as of May 2023. And this is not counting the millions of tiny debris fragments that are too small to be tracked.
Although space debris is a global problem, certain countries have played a larger role in contributing to the clutter. In the 1950s, the U.S. and Russia (formerly USSR) led the space race with the highest number of launched space objects. In the 1970s, they were joined by China, and objects from all three countries account for the vast majority of today’s space debris:
| Space Debris Contributor | # of Space Debris |
|---|---|
| 🇷🇺 Russia (including USSR) | 4,521 |
| 🇺🇸 United States | 4,317 |
| 🇨🇳 China | 4,137 |
| 🇫🇷 France | 370 |
| 🇮🇳 India | 62 |
| 🇯🇵 Japan | 48 |
| 🇨🇳 China / 🇧🇷 Brazil | 25 |
| 🇪🇺 European Space Agency | 22 |
| 🇨🇦 Canada | 5 |
| 🇦🇷 Argentina | 1 |
| 🇩🇪 Germany | 1 |
| Other | 24 |
*China-Brazil space debris originates from various cooperational space programs over the years
The debris count of Russia—including former launches by the Soviet Union—currently stands at 4,521. But the U.S. and China are not far behind with more than 4,000 each. And though many of these are accumulated over time, thousands of debris are created in single catastrophic moments.
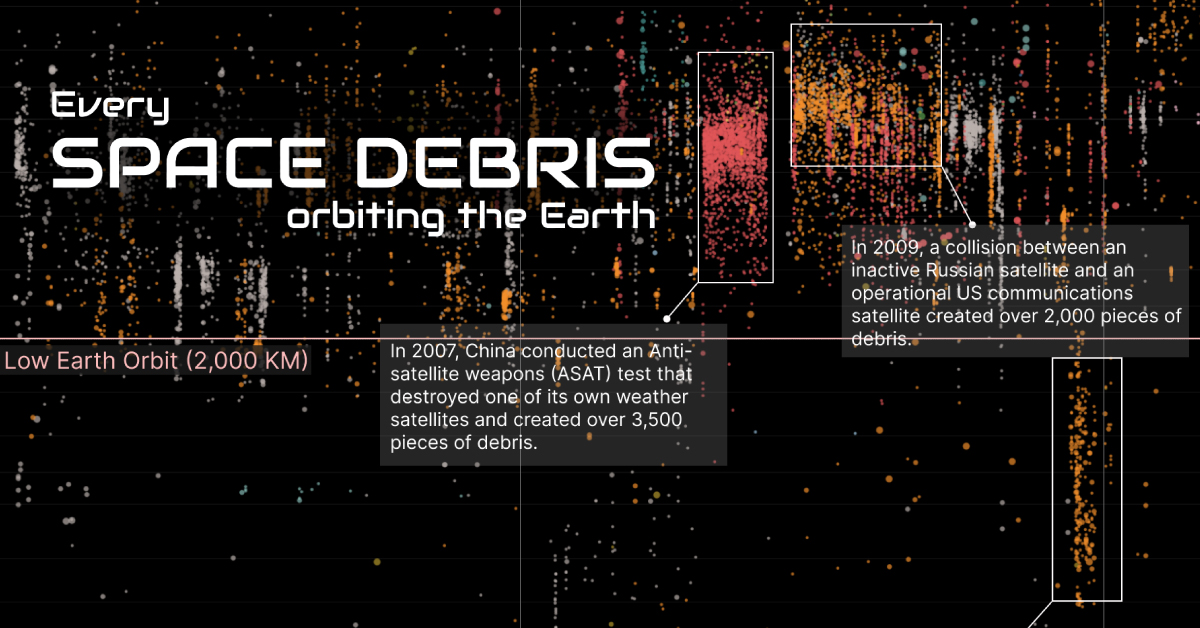
China’s anti-satellite test in 2007 destroyed its own weather satellite, creating 3,500 space debris pieces. Likewise, the 2009 collision between inactive Russian satellite Cosmos-2251 and operational U.S. communications satellite Iridium 33 created over 2,000 pieces of debris.
Moving at high speeds, even tiny fragments of debris can cause catastrophic collisions. And with companies like SpaceX launching expansive satellite networks, these numbers are bound to grow.
Clearer Skies on the Horizon?
Addressing the space debris issue requires a multi-faceted approach involving international cooperation, advanced technology, and responsible space practices.
Scientists and engineers are actively exploring methods to clean up debris, including concepts like space-based debris removal systems and novel deorbiting techniques.
Some space agencies like the European Space Agency are also making plans to ensure their space technology is designed with safe disposal plans to significantly reduce the accumulation of space junk.

This article was published as a part of Visual Capitalist's Creator Program, which features data-driven visuals from some of our favorite Creators around the world.


Technology
Which Companies Own the Most Satellites?
Despite Starlink’s dominance in the industry, the company is set to face intense competition in the coming years.
Which Companies Own the Most Satellites?
Nearly 7,000 satellites orbit the Earth, serving vital functions such as communication, navigation, and scientific research.
In 2022 alone, more than 150 launches took place, sending new instruments into space, with many more expected over the next decade.
But who owns these objects? In this graphic, we utilize data from the Union of Concerned Scientists to highlight the leaders in satellite technology.
SpaceX’s Dominance in Space
SpaceX, led by Elon Musk, is unquestionably the industry leader, currently operating the largest fleet of satellites in orbit—about 50% of the global total.
The company has already completed 62 missions this year, surpassing any other company or nation, and operates thousands of internet-beaming Starlink spacecraft that provide global internet connectivity.
Starlink customers receive a small satellite dish that self-orients itself to align with Starlink’s low-Earth-orbit satellites.
| Owner | Total | Share | Country |
|---|---|---|---|
| SpaceX | 3,395 | 50% | USA |
| OneWeb Satellites | 502 | 7% | UK |
| Chinese Government | 369 | 5% | China |
| U.S. Government | 306 | 4% | USA |
| Planet Labs, Inc. | 195 | 3% | USA |
| Russian Federation | 137 | 2% | Russia |
| Spire Global Inc. | 127 | 2% | USA |
| Swarm Technologies | 84 | 1% | USA |
| Iridium Communications, Inc. | 75 | 1% | USA |
| Other | 1,528 | 23% |
Percentages may not add to 100 due to rounding.
In second place is a lesser-known company, British OneWeb Satellites. The company, headquartered in London, counts the UK government among its investors and provides high-speed internet services to governments, businesses, and communities.
Like many other satellite operators, OneWeb relies on SpaceX to launch its satellites.
Despite Starlink’s dominance in the industry, the company is set to face intense competition in the coming years. Amazon’s Project Kuiper plans to deploy 3,236 satellites by 2029 to compete with SpaceX’s network. The first of the fleet could launch as early as 2024.
The Rise of China’s Space Program
After the top private companies, governments also own a significant portion of satellites orbiting the Earth. The U.S. remains the leader in total satellites, when adding those owned by both companies and government agencies together.
American expenditures on space programs reached $62 billion in 2022, five times more than the second one, China.
China, however, has sped up its space program over the last 20 years and currently has the highest number of satellites in orbit belonging directly to government agencies. Most of these are used for Earth observation, communications, defense, and technology development.
Satellite Demand to Rise Over the Decade
Despite the internet being taken for granted in major metropolitan areas and developed countries, one out of every three people worldwide has never used the web.
Furthermore, the increasing demand for data and the emergence of new, more cost-effective satellite technologies are expected to present significant opportunities for private space companies.
In this context, satellite demand is projected to quadruple over the next decade.

-

 Brands6 days ago
How Tech Logos Have Evolved Over Time
-

 Demographics2 weeks ago
The Smallest Gender Wage Gaps in OECD Countries
-

 Economy2 weeks ago
Where U.S. Inflation Hit the Hardest in March 2024
-

 Green2 weeks ago
Top Countries By Forest Growth Since 2001
-

 United States2 weeks ago
Ranked: The Largest U.S. Corporations by Number of Employees
-

 Maps2 weeks ago
The Largest Earthquakes in the New York Area (1970-2024)
-

 Green2 weeks ago
Ranked: The Countries With the Most Air Pollution in 2023
-

 Green2 weeks ago
Ranking the Top 15 Countries by Carbon Tax Revenue