


Technology, Business, Maps
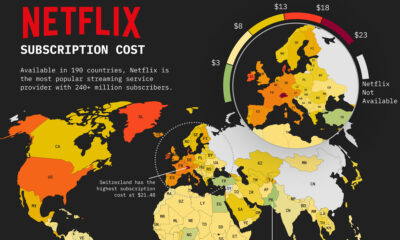

This map of Netflix price by country shows how much a basic subscription package costs around the world.
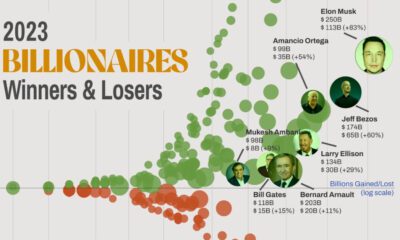

Billionaire wealth soared in 2023, but not everyone shared in these gains. This graphic shows how fortunes changed over last year.
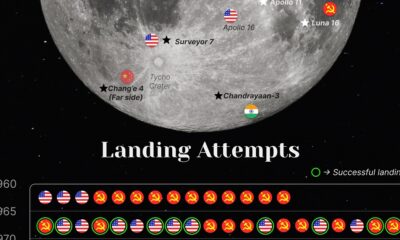

Since the beginning of the space race, only four countries have successfully accomplished missions to the moon.
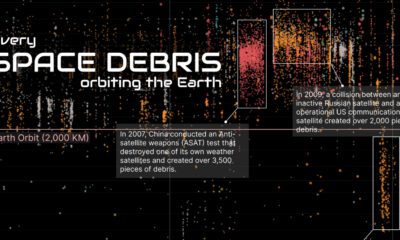

This visual breaks down just how much space debris is currently orbiting the Earth, and the nations responsible for it.
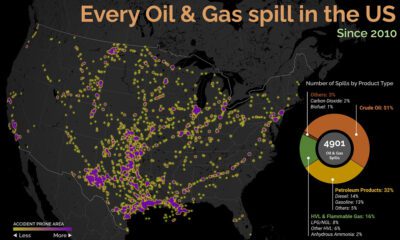

Oil and gas spills can be messy, but where are they most likely to occur? This graphic looks at oil and gas spills in the U.S....
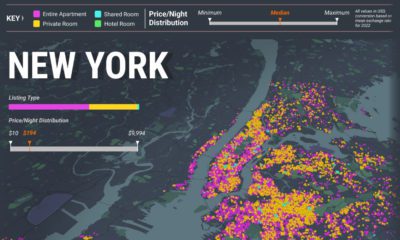

How expansive has the Airbnb landscape become? Here’s a look at every active Airbnb listing in New York, London, and Paris in Sept 2022.