Technology
Mapped: A Snapshot of the Airbnb Landscape in Three Megacities
Article/Editing:
Visualizing the Airbnb Landscape in Three Megacities
Since its inception in 2008, Airbnb has grown into one of the most popular travel and short-term accommodation apps on the market.
In 2021 alone, there were more than 300 million bookings (for both accommodation and experiences) made through the app.
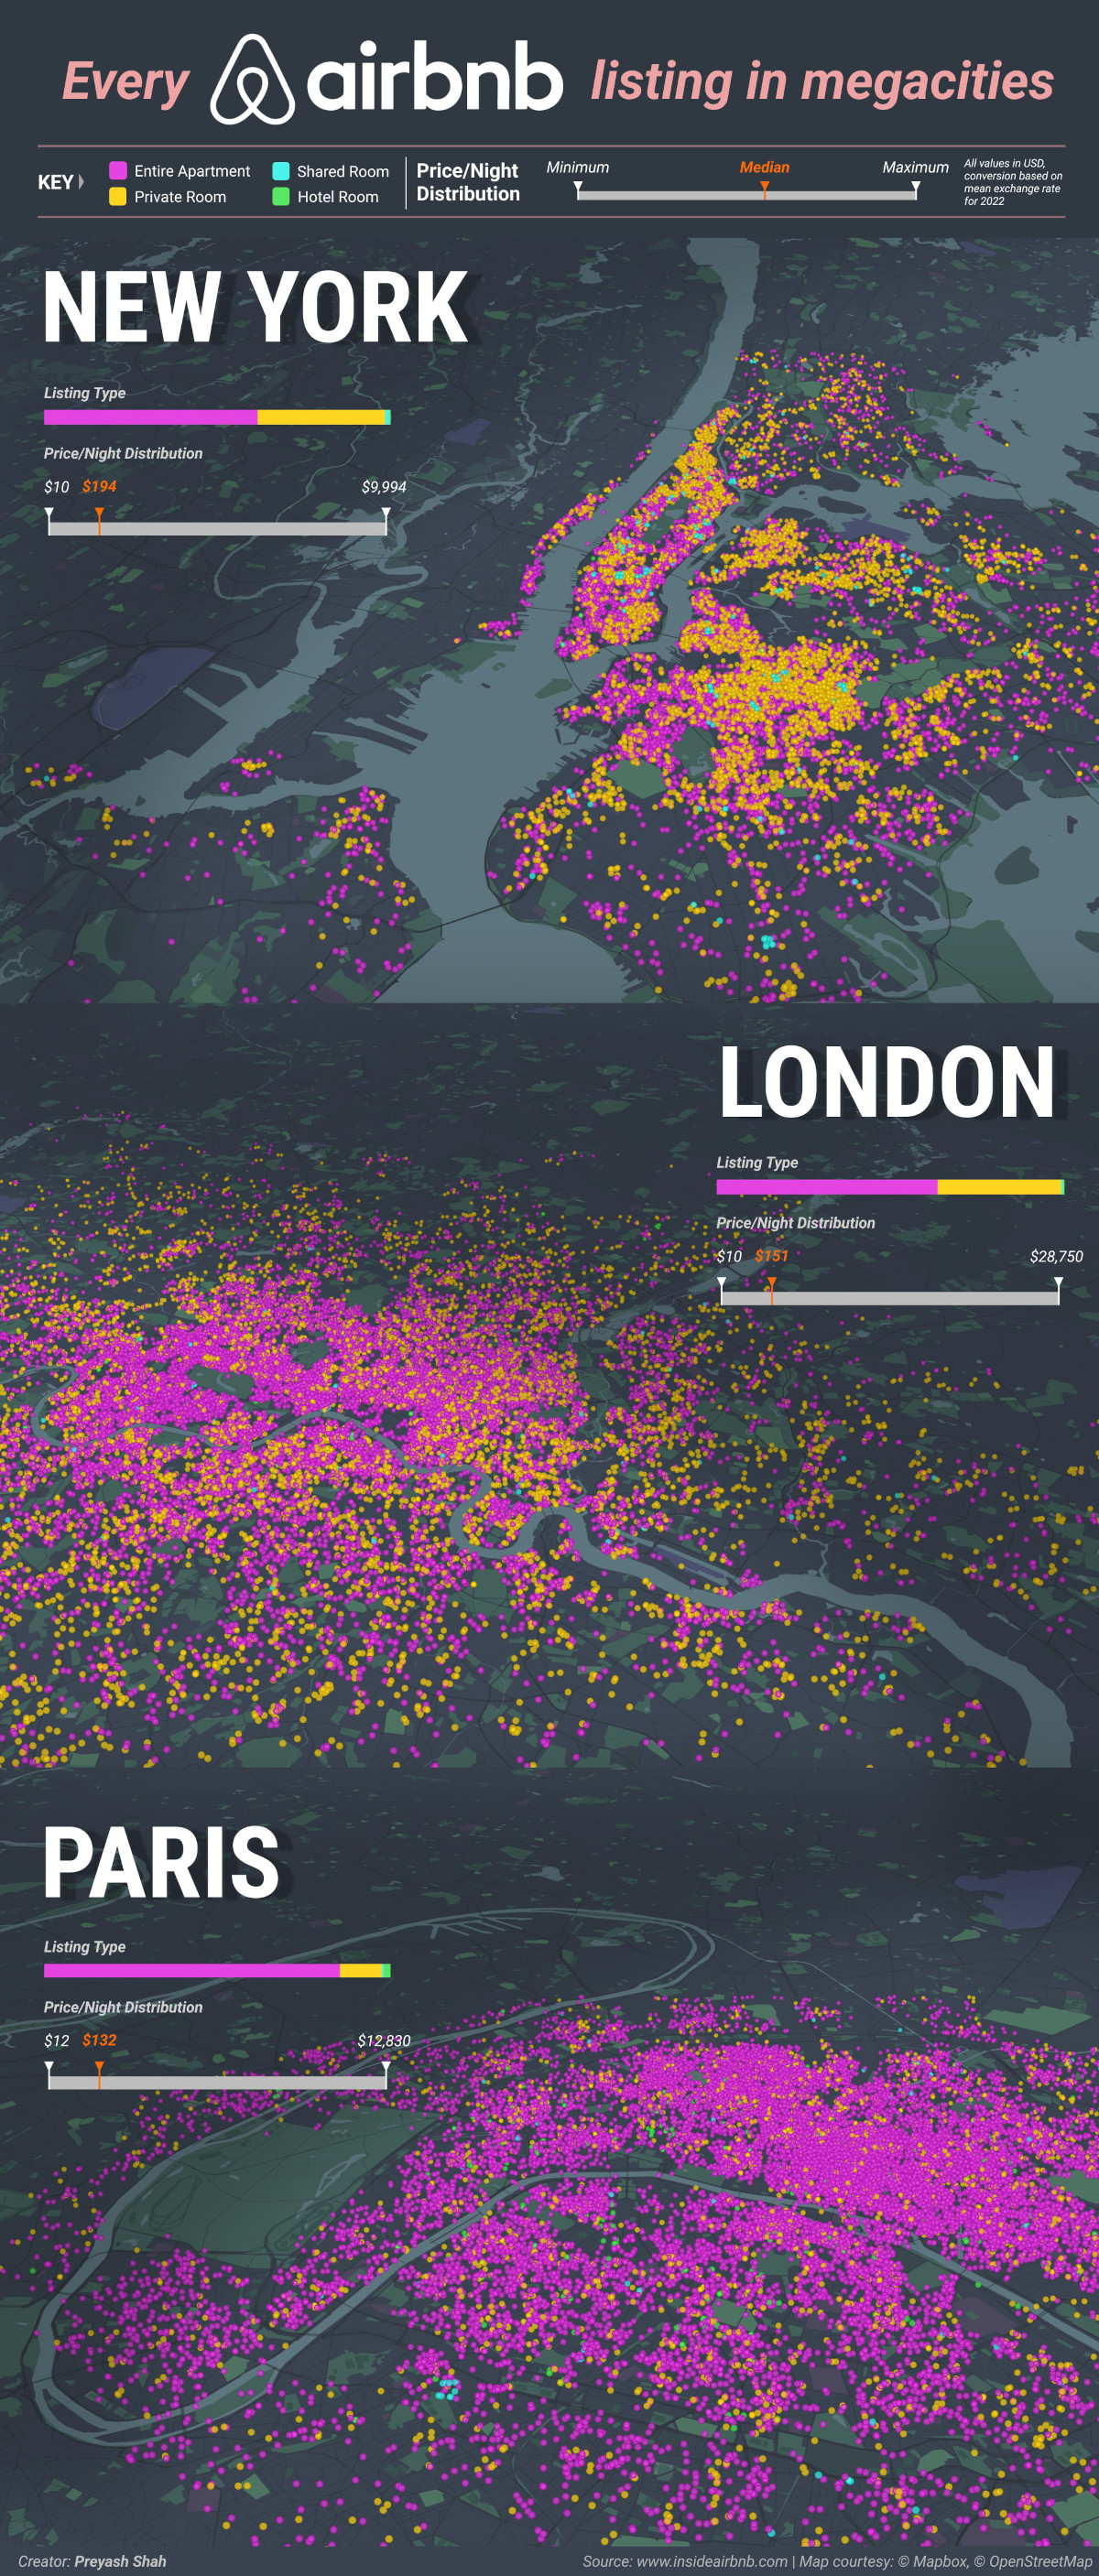
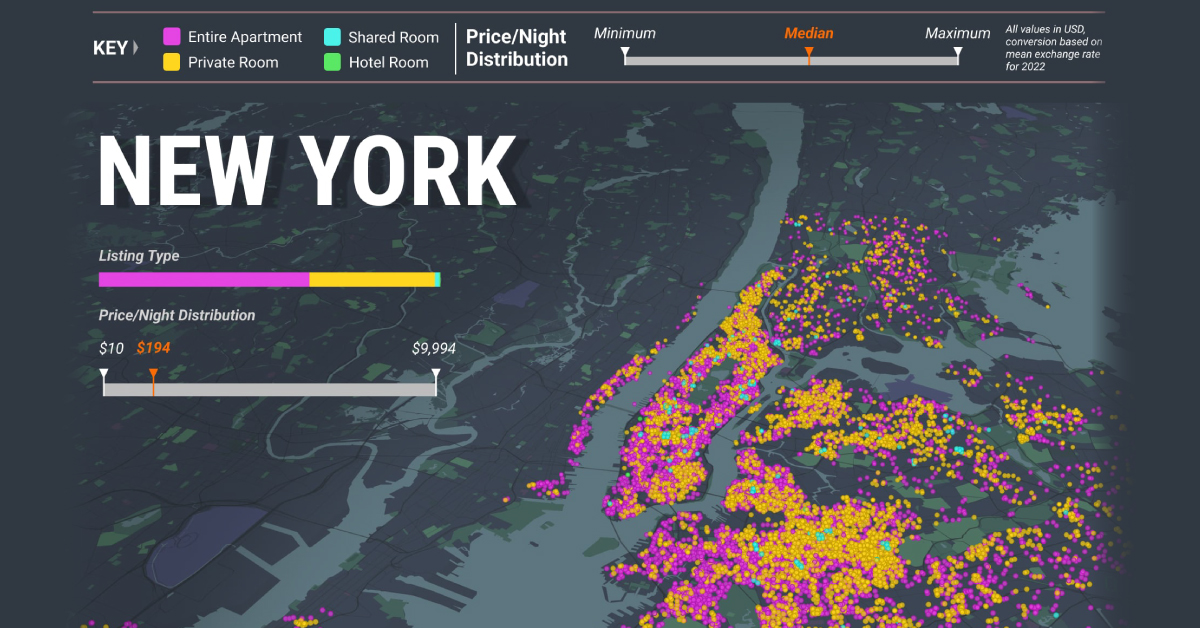
To visualize just how massive the Airbnb landscape has become in major cities, this graphic by Preyash Shah shows every single listing in New York, London, and Paris.
About the Data
To make this graphic, Shah used September 2022 data from insideairbnb.com, a website that pulls data directly from the Airbnb app. Once collected, the raw data was then cleaned to include active listings only fitting a few key parameters:
- Any listing that did not have a review in 2022 was removed
- The most expensive listings were individually checked to ensure the listing price matched the actual historical price and removed if there was a major discrepancy. This is due to inactive listings that are extremely marked up instead of de-listed
After scrubbing the data, each city’s immediate metro area was left with roughly 20,000 listings.
As the data shows, a majority of these listings were for entire apartments. Paris had the biggest share, with about 85% of listings for entire apartments rather than private or shared rooms.
This is especially interesting considering that Paris has extremely strict regulations around short-term rentals and Airbnb usage, one being that an Airbnb rental must be someone’s primary residence.
Airbnb’s Beginnings
Two co-founders of Airbnb include Brian Chesky and Joe Gebbia, two roommates in San Francisco.
In an act of desperation, they decided to set up and rent out a few air mattresses on the floor of their apartment to help pay their rent. Free breakfast was included with the stay, and after getting $80 a night for each mattress, Chesky and Gebbia knew they were onto something.
Yet, while Airbnb has shown great success over the last decade, it’s received its fair share of criticism from skeptics. Because of concerns over housing supply and price gouging, many cities have put restrictions around the use of Airbnb, or even outright banned the platform.
Like other technology companies, Airbnb has had a challenging year in the stock market. Once valued at $113 billion in 2021, the company is currently sitting closer to a $60 billion market capitalization today.

This article was published as a part of Visual Capitalist's Creator Program, which features data-driven visuals from some of our favorite Creators around the world.


Technology
Visualizing AI Patents by Country
See which countries have been granted the most AI patents each year, from 2012 to 2022.


Visualizing AI Patents by Country
This was originally posted on our Voronoi app. Download the app for free on iOS or Android and discover incredible data-driven charts from a variety of trusted sources.
This infographic shows the number of AI-related patents granted each year from 2010 to 2022 (latest data available). These figures come from the Center for Security and Emerging Technology (CSET), accessed via Stanford University’s 2024 AI Index Report.
From this data, we can see that China first overtook the U.S. in 2013. Since then, the country has seen enormous growth in the number of AI patents granted each year.
| Year | China | EU and UK | U.S. | RoW | Global Total |
|---|---|---|---|---|---|
| 2010 | 307 | 137 | 984 | 571 | 1,999 |
| 2011 | 516 | 129 | 980 | 581 | 2,206 |
| 2012 | 926 | 112 | 950 | 660 | 2,648 |
| 2013 | 1,035 | 91 | 970 | 627 | 2,723 |
| 2014 | 1,278 | 97 | 1,078 | 667 | 3,120 |
| 2015 | 1,721 | 110 | 1,135 | 539 | 3,505 |
| 2016 | 1,621 | 128 | 1,298 | 714 | 3,761 |
| 2017 | 2,428 | 144 | 1,489 | 1,075 | 5,136 |
| 2018 | 4,741 | 155 | 1,674 | 1,574 | 8,144 |
| 2019 | 9,530 | 322 | 3,211 | 2,720 | 15,783 |
| 2020 | 13,071 | 406 | 5,441 | 4,455 | 23,373 |
| 2021 | 21,907 | 623 | 8,219 | 7,519 | 38,268 |
| 2022 | 35,315 | 1,173 | 12,077 | 13,699 | 62,264 |
In 2022, China was granted more patents than every other country combined.
While this suggests that the country is very active in researching the field of artificial intelligence, it doesn’t necessarily mean that China is the farthest in terms of capability.
Key Facts About AI Patents
According to CSET, AI patents relate to mathematical relationships and algorithms, which are considered abstract ideas under patent law. They can also have different meaning, depending on where they are filed.
In the U.S., AI patenting is concentrated amongst large companies including IBM, Microsoft, and Google. On the other hand, AI patenting in China is more distributed across government organizations, universities, and tech firms (e.g. Tencent).
In terms of focus area, China’s patents are typically related to computer vision, a field of AI that enables computers and systems to interpret visual data and inputs. Meanwhile America’s efforts are more evenly distributed across research fields.
Learn More About AI From Visual Capitalist
If you want to see more data visualizations on artificial intelligence, check out this graphic that shows which job departments will be impacted by AI the most.

-

 Markets1 week ago
U.S. Debt Interest Payments Reach $1 Trillion
-

 Real Estate2 weeks ago
Ranked: The Most Valuable Housing Markets in America
-

 Money2 weeks ago
Which States Have the Highest Minimum Wage in America?
-

 AI2 weeks ago
Ranked: Semiconductor Companies by Industry Revenue Share
-

 Markets2 weeks ago
Ranked: The World’s Top Flight Routes, by Revenue
-

 Demographics2 weeks ago
Population Projections: The World’s 6 Largest Countries in 2075
-

 Markets2 weeks ago
The Top 10 States by Real GDP Growth in 2023
-

 Money2 weeks ago
The Smallest Gender Wage Gaps in OECD Countries