Money
Billionaire Wealth: The Biggest Winners and Losers in 2023
Article/Editing:
![]() See this visualization first on the Voronoi app.
See this visualization first on the Voronoi app.
Billionaire Wealth: The Biggest Winners and Losers in 2023
This was originally posted on our Voronoi app. Download the app for free on iOS or Android and discover incredible data-driven charts from a variety of trusted sources.
In early February, Mark Zuckerberg added $28 billion to his wealth in a matter of hours as Meta’s shares soared after the company announced its first dividend payout.
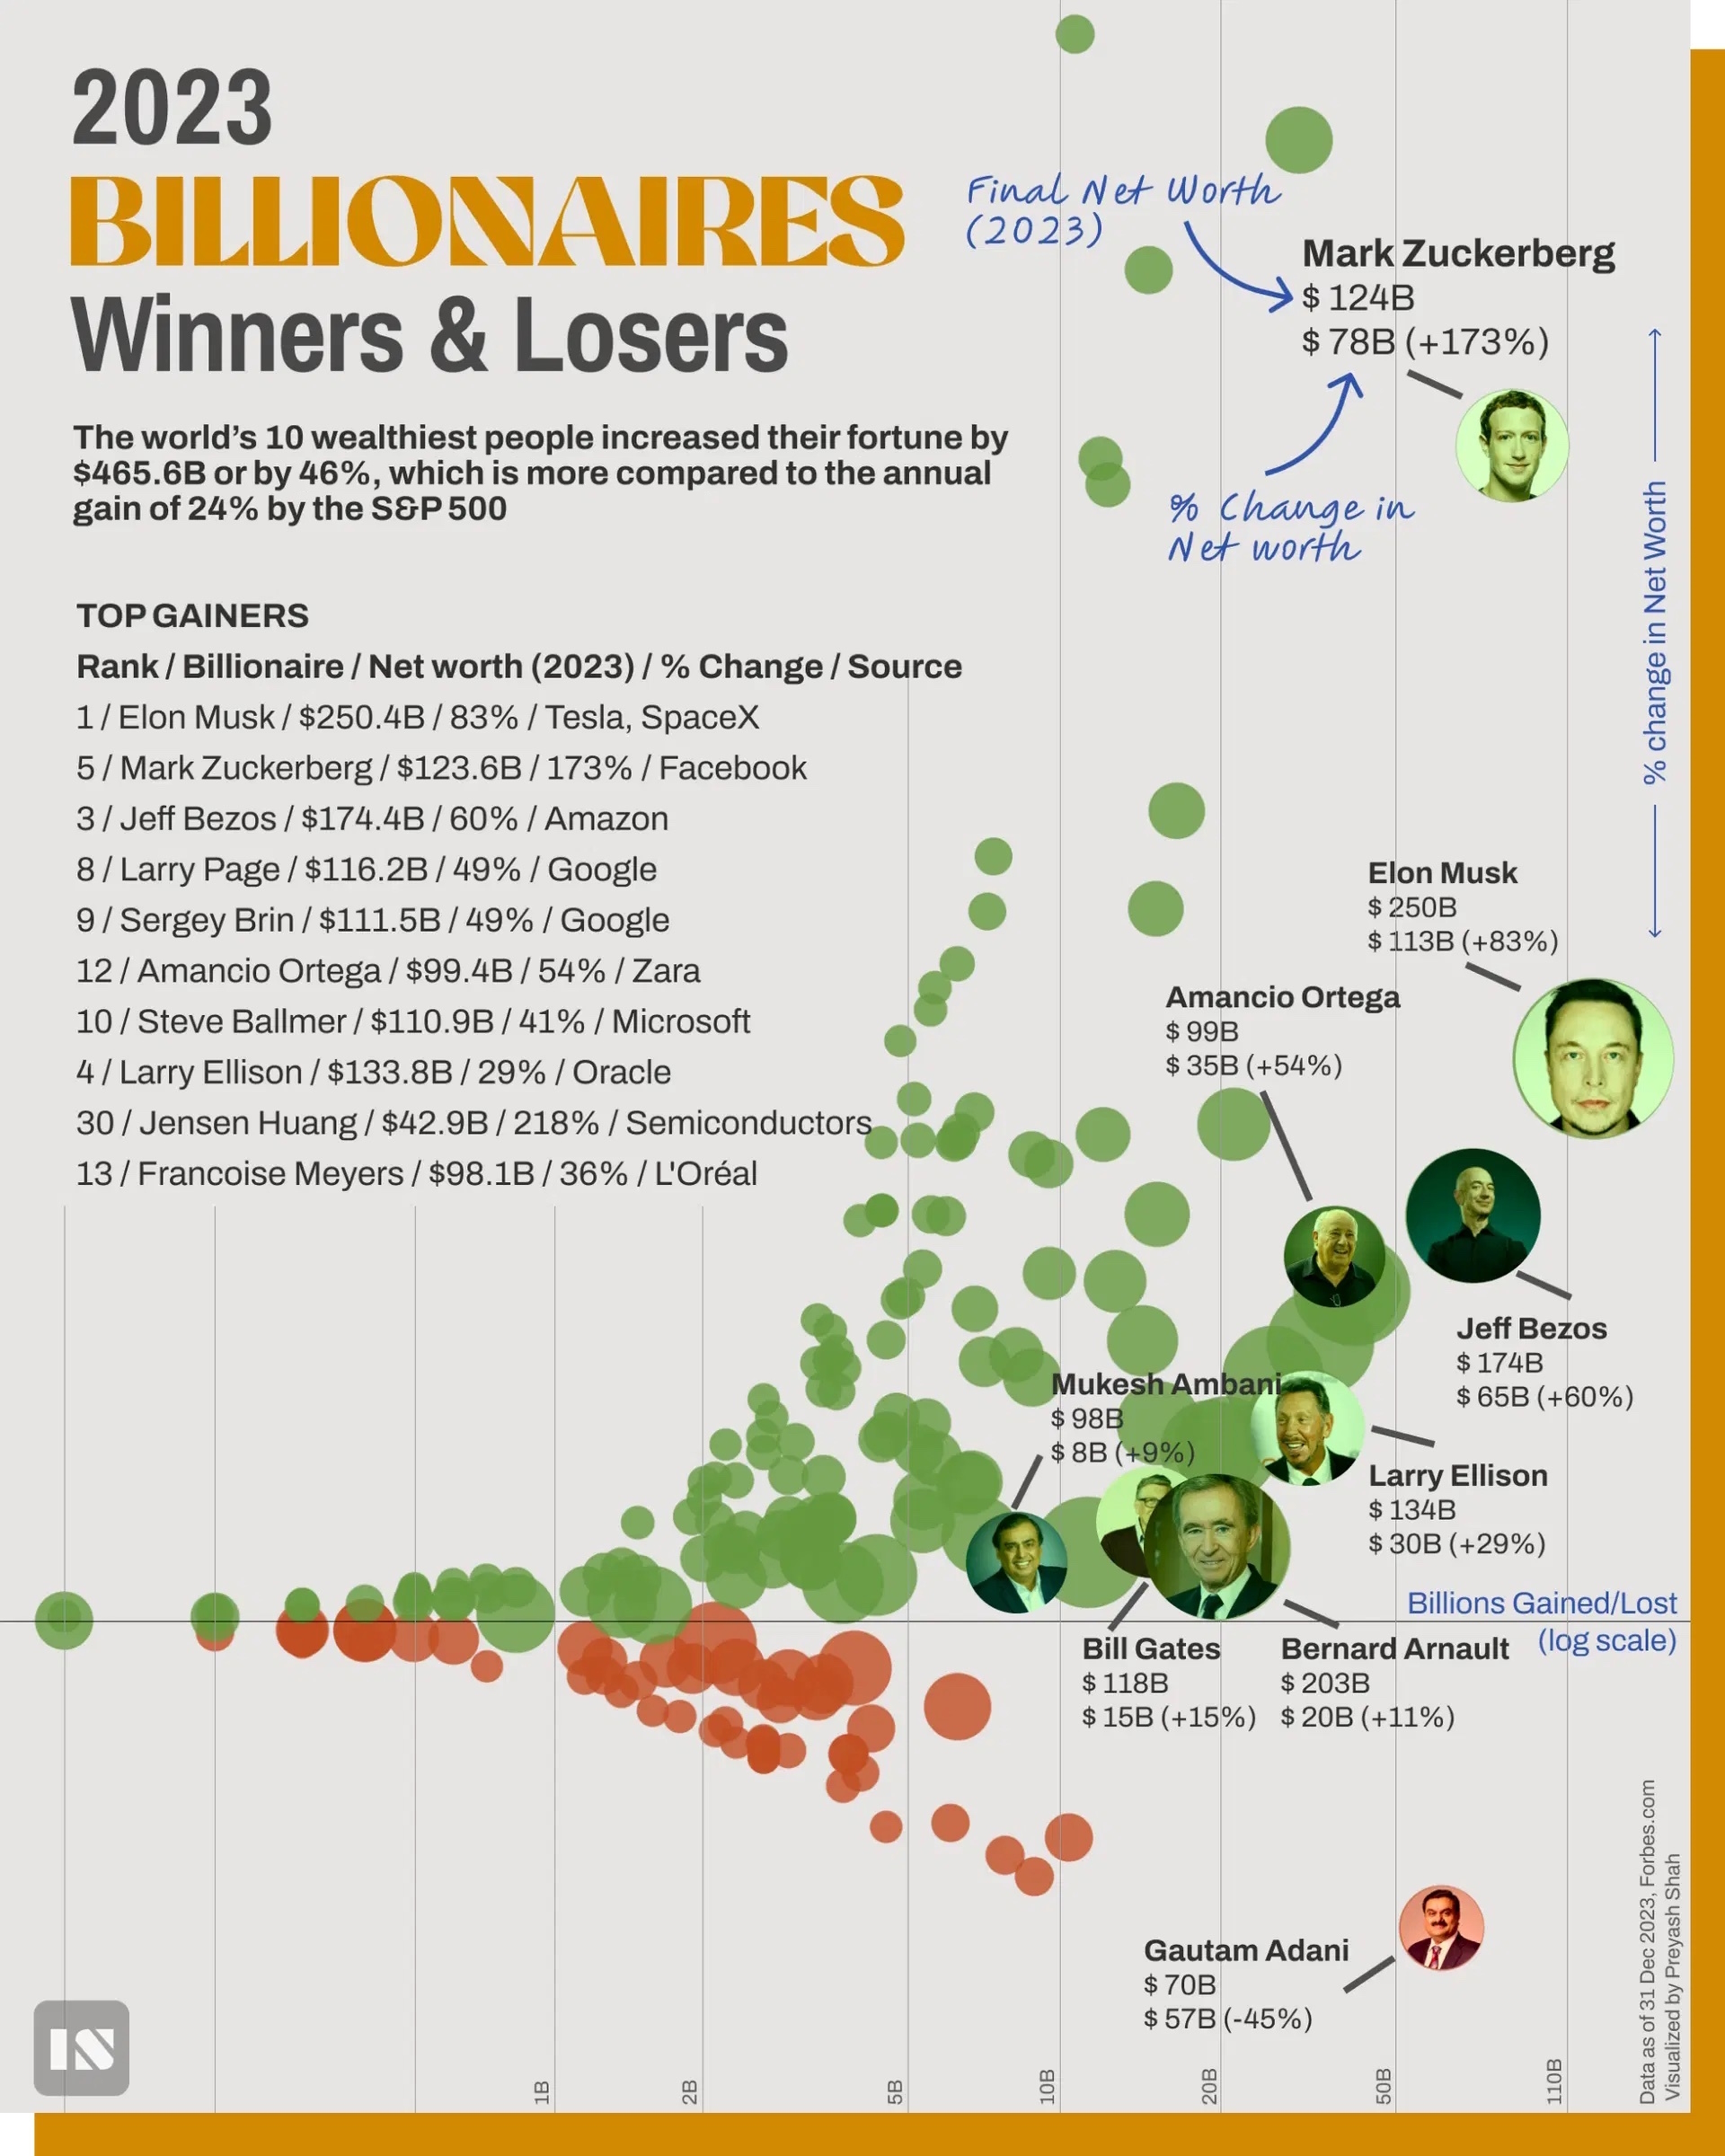
This follows a banner year for the Facebook founder, who saw his wealth surge 173% in 2023. Like Zuckerberg, many tech billionaires added huge sums to their wealth as the stock market rebounded.
This graphic, from Preyash Shah, shows the biggest winners and losers in billionaire wealth in 2023.
The Top Risers and Fallers
Below, we rank the world’s top 50 billionaires by their net change in wealth:
| Ranking | Name | Net Worth 2024 | Annual Change | % Growth |
|---|---|---|---|---|
| 1 | Elon Musk | $250.4B | $113.5B | +83% |
| 2 | Mark Zuckerberg | $123.6B | $78.3B | +173% |
| 3 | Jeff Bezos | $174.4B | $65.3B | +60% |
| 4 | Prajogo Pangestu | $54.6B | $49.5B | +971% |
| 5 | Larry Page | $116.2B | $38.1B | +49% |
| 6 | Sergey Brin | $111.5B | $36.6B | +49% |
| 7 | Amancio Ortega | $99.4B | $34.8B | +54% |
| 8 | Steve Ballmer | $110.9B | $32.4B | +41% |
| 9 | Larry Ellison | $133.8B | $30.0B | +29% |
| 10 | Jensen Huang | $42.9B | $29.4B | +218% |
| 11 | Françoise Bettencourt Meyers & family | $98.1B | $26.1B | +36% |
| 12 | Colin Huang | $51.6B | $21.8B | +73% |
| 13 | Carlos Slim Helu & family | $102.9B | $21.0B | +26% |
| 14 | Bernard Arnault & family | $203.2B | $20.2B | +11% |
| 15 | Michael Bloomberg | $96.3B | $19.5B | +25% |
| 16 | Reinhold Wuerth & family | $30.7B | $16.7B | +119% |
| 17 | Michael Dell | $67.9B | $15.4B | +29% |
| 18 | MacKenzie Scott | $40.8B | $15.3B | +60% |
| 19 | Gianluigi & Rafaela Aponte | $29.7B | $15.2B | +105% |
| 20 | Bill Gates | $118.3B | $15.1B | +15% |
| 21 | Dieter Schwarz | $48.8B | $14.3B | +41% |
| 22 | Stephen Schwarzman | $37.7B | $12.6B | +50% |
| 23 | Warren Buffett | $118.8B | $11.1B | +10% |
| 24 | Shiv Nadar | $32.5B | $8.6B | +36% |
| 25 | Mukesh Ambani | $97.8B | $8.0B | +9% |
| 26 | David Thomson & family | $59.7B | $6.8B | +13% |
| 27 | Tadashi Yanai & family | $37.8B | $6.5B | +21% |
| 28 | Ken Griffin | $37.7B | $6.4B | +20% |
| 29 | Klaus-Michael Kuehne | $34.1B | $5.2B | +18% |
| 30 | Giovanni Ferrero | $40.0B | $5.2B | +15% |
| 31 | Rob Walton | $64.3B | $4.2B | +7% |
| 32 | Jim Walton | $65.0B | $3.6B | +6% |
| 33 | Gerard Wertheimer | $36.3B | $3.1B | +9% |
| 34 | Alain Wertheimer | $36.3B | $3.1B | +9% |
| 35 | Jim Simons | $30.7B | $2.6B | +9% |
| 36 | Li Ka-shing | $35.6B | $2.2B | +7% |
| 37 | Zhong Shanshan | $65.4B | $2.0B | -3% |
| 38 | Julia Koch & family | $59.2B | $1.5B | +3% |
| 39 | Phil Knight & family | $46.8B | $1.3B | +3% |
| 40 | Alice Walton | $60.0B | $0.8B | +1% |
| 41 | Miriam Adelson & family | $32.2B | $0.1B | +0% |
| 42 | Jacqueline Mars | $38.2B | -$0.4B | -1% |
| 43 | John Mars | $38.2B | -$0.4B | -1% |
| 44 | Jeff Yass | $28.9B | -$1.1B | -4% |
| 45 | Len Blavatnik | $31.5B | -$2.2B | -7% |
| 46 | François Pinault & family | $31.8B | -$2.8B | -8% |
| 47 | Ma Huateng | $34.0B | -$3.3B | -9% |
| 48 | Charles Koch | $53.9B | -$3.8B | -7% |
| 49 | Zhang Yiming | $43.4B | -$6.1B | -12% |
| 50 | Gautam Adani | $69.7B | -$56.5B | -45% |
Adding $113.5 billion to his fortune, Elon Musk saw the biggest gains across the group as Tesla shares doubled in price in 2023.
This marks a sharp reversal from the previous year, when Musk lost more money than any other billionaire. In a record year, Tesla delivered 1.8 million vehicles—a 38% year-over-year increase.
Mark Zuckerberg, with the second-highest gains, raked in $78.3 billion as Meta’s shares skyrocketed. Last year, Facebook saw 5 million new users in North America. Adding to this, users’ time spent on Instagram has increased 40% since mid-2020 when Reels was launched.
As the fastest riser across the top 50, Indonesia’s energy billionaire Prajogo Pangestu saw his wealth climb an incredible 971%. The majority of gains were driven from Barito Renewables, his geothermal power company, going public in October 2023.
By contrast, India’s Gautam Adani saw the steepest decline in wealth. After a Hindenburg report accused the Adani Group of operating several shell companies to manipulate stock prices and launder money, Adani saw his wealth decline by $56.5 billion, cutting it by almost half.
Along with Adani, Zhang Yiming, the founder of ByteDance—known for its social media app TikTok—lost $6.1 billion while major Republican donor Charles Koch lost $3.8 billion over the year.
Rapidly Changing Wealth
So far, the U.S. stock market has hit record highs in 2024, boosting the fortunes of many of the world’s billionaires.
In fact, Meta recently added $196 billion to its market cap in one day, the biggest gain in the history of Wall Street. Year-to-date, Zuckerberg’s wealth has increased by $38.2 billion as of February 5. Additionally, Jeff Bezos has added $18 billion to his net worth in just over a month as Amazon shares have jumped nearly 14%.
In 2024, Warren Buffett’s net worth has already climbed by $9.9 billion.
Other billionaires have not fared as well, in particular Elon Musk, whose wealth has plummeted $55.8 billion after issuing recalls for 3.8 million vehicles. Tesla’s shares have slumped 27% year-to-date given production headwinds and a host of other setbacks, including legal troubles and increasing competition in the electric vehicle market.

This article was published as a part of Visual Capitalist's Creator Program, which features data-driven visuals from some of our favorite Creators around the world.


Money
Charted: Which City Has the Most Billionaires in 2024?
Just two countries account for half of the top 20 cities with the most billionaires. And the majority of the other half are found in Asia.


Charted: Which Country Has the Most Billionaires in 2024?
This was originally posted on our Voronoi app. Download the app for free on iOS or Android and discover incredible data-driven charts from a variety of trusted sources.
Some cities seem to attract the rich. Take New York City for example, which has 340,000 high-net-worth residents with investable assets of more than $1 million.
But there’s a vast difference between being a millionaire and a billionaire. So where do the richest of them all live?
Using data from the Hurun Global Rich List 2024, we rank the top 20 cities with the highest number of billionaires in 2024.
A caveat to these rich lists: sources often vary on figures and exact rankings. For example, in last year’s reports, Forbes had New York as the city with the most billionaires, while the Hurun Global Rich List placed Beijing at the top spot.
Ranked: Top 20 Cities with the Most Billionaires in 2024
The Chinese economy’s doldrums over the course of the past year have affected its ultra-wealthy residents in key cities.
Beijing, the city with the most billionaires in 2023, has not only ceded its spot to New York, but has dropped to #4, overtaken by London and Mumbai.
| Rank | City | Billionaires | Rank Change YoY |
|---|---|---|---|
| 1 | 🇺🇸 New York | 119 | +1 |
| 2 | 🇬🇧 London | 97 | +3 |
| 3 | 🇮🇳 Mumbai | 92 | +4 |
| 4 | 🇨🇳 Beijing | 91 | -3 |
| 5 | 🇨🇳 Shanghai | 87 | -2 |
| 6 | 🇨🇳 Shenzhen | 84 | -2 |
| 7 | 🇭🇰 Hong Kong | 65 | -1 |
| 8 | 🇷🇺 Moscow | 59 | No Change |
| 9 | 🇮🇳 New Delhi | 57 | +6 |
| 10 | 🇺🇸 San Francisco | 52 | No Change |
| 11 | 🇹🇭 Bangkok | 49 | +2 |
| 12 | 🇹🇼 Taipei | 45 | +2 |
| 13 | 🇫🇷 Paris | 44 | -2 |
| 14 | 🇨🇳 Hangzhou | 43 | -5 |
| 15 | 🇸🇬 Singapore | 42 | New to Top 20 |
| 16 | 🇨🇳 Guangzhou | 39 | -4 |
| 17T | 🇮🇩 Jakarta | 37 | +1 |
| 17T | 🇧🇷 Sao Paulo | 37 | No Change |
| 19T | 🇺🇸 Los Angeles | 31 | No Change |
| 19T | 🇰🇷 Seoul | 31 | -3 |
In fact all Chinese cities on the top 20 list have lost billionaires between 2023–24. Consequently, they’ve all lost ranking spots as well, with Hangzhou seeing the biggest slide (-5) in the top 20.
Where China lost, all other Asian cities—except Seoul—in the top 20 have gained ranks. Indian cities lead the way, with New Delhi (+6) and Mumbai (+3) having climbed the most.
At a country level, China and the U.S combine to make up half of the cities in the top 20. They are also home to about half of the world’s 3,200 billionaire population.
In other news of note: Hurun officially counts Taylor Swift as a billionaire, estimating her net worth at $1.2 billion.

-

 Sports1 week ago
The Highest Earning Athletes in Seven Professional Sports
-

 Countries2 weeks ago
Population Projections: The World’s 6 Largest Countries in 2075
-

 Markets2 weeks ago
The Top 10 States by Real GDP Growth in 2023
-

 Demographics2 weeks ago
The Smallest Gender Wage Gaps in OECD Countries
-

 United States2 weeks ago
Where U.S. Inflation Hit the Hardest in March 2024
-

 Green2 weeks ago
Top Countries By Forest Growth Since 2001
-

 United States2 weeks ago
Ranked: The Largest U.S. Corporations by Number of Employees
-

 Maps2 weeks ago
The Largest Earthquakes in the New York Area (1970-2024)