Green
Mapped: Carbon Pricing Initiatives Around the World
Article/Editing:
Click to view this graphic in a higher-resolution.
Mapped: Carbon Pricing Initiatives Around the World
Over the past two decades, governments around the world have responded to climate change through various initiatives and policies, with carbon pricing at the forefront.
A recent example is the Canadian province of Ontario’s Emissions Performance Standards program, first launched in 2022. The program sets annual carbon emissions limits for industrial facilities, with a fee on excess carbon emitted.
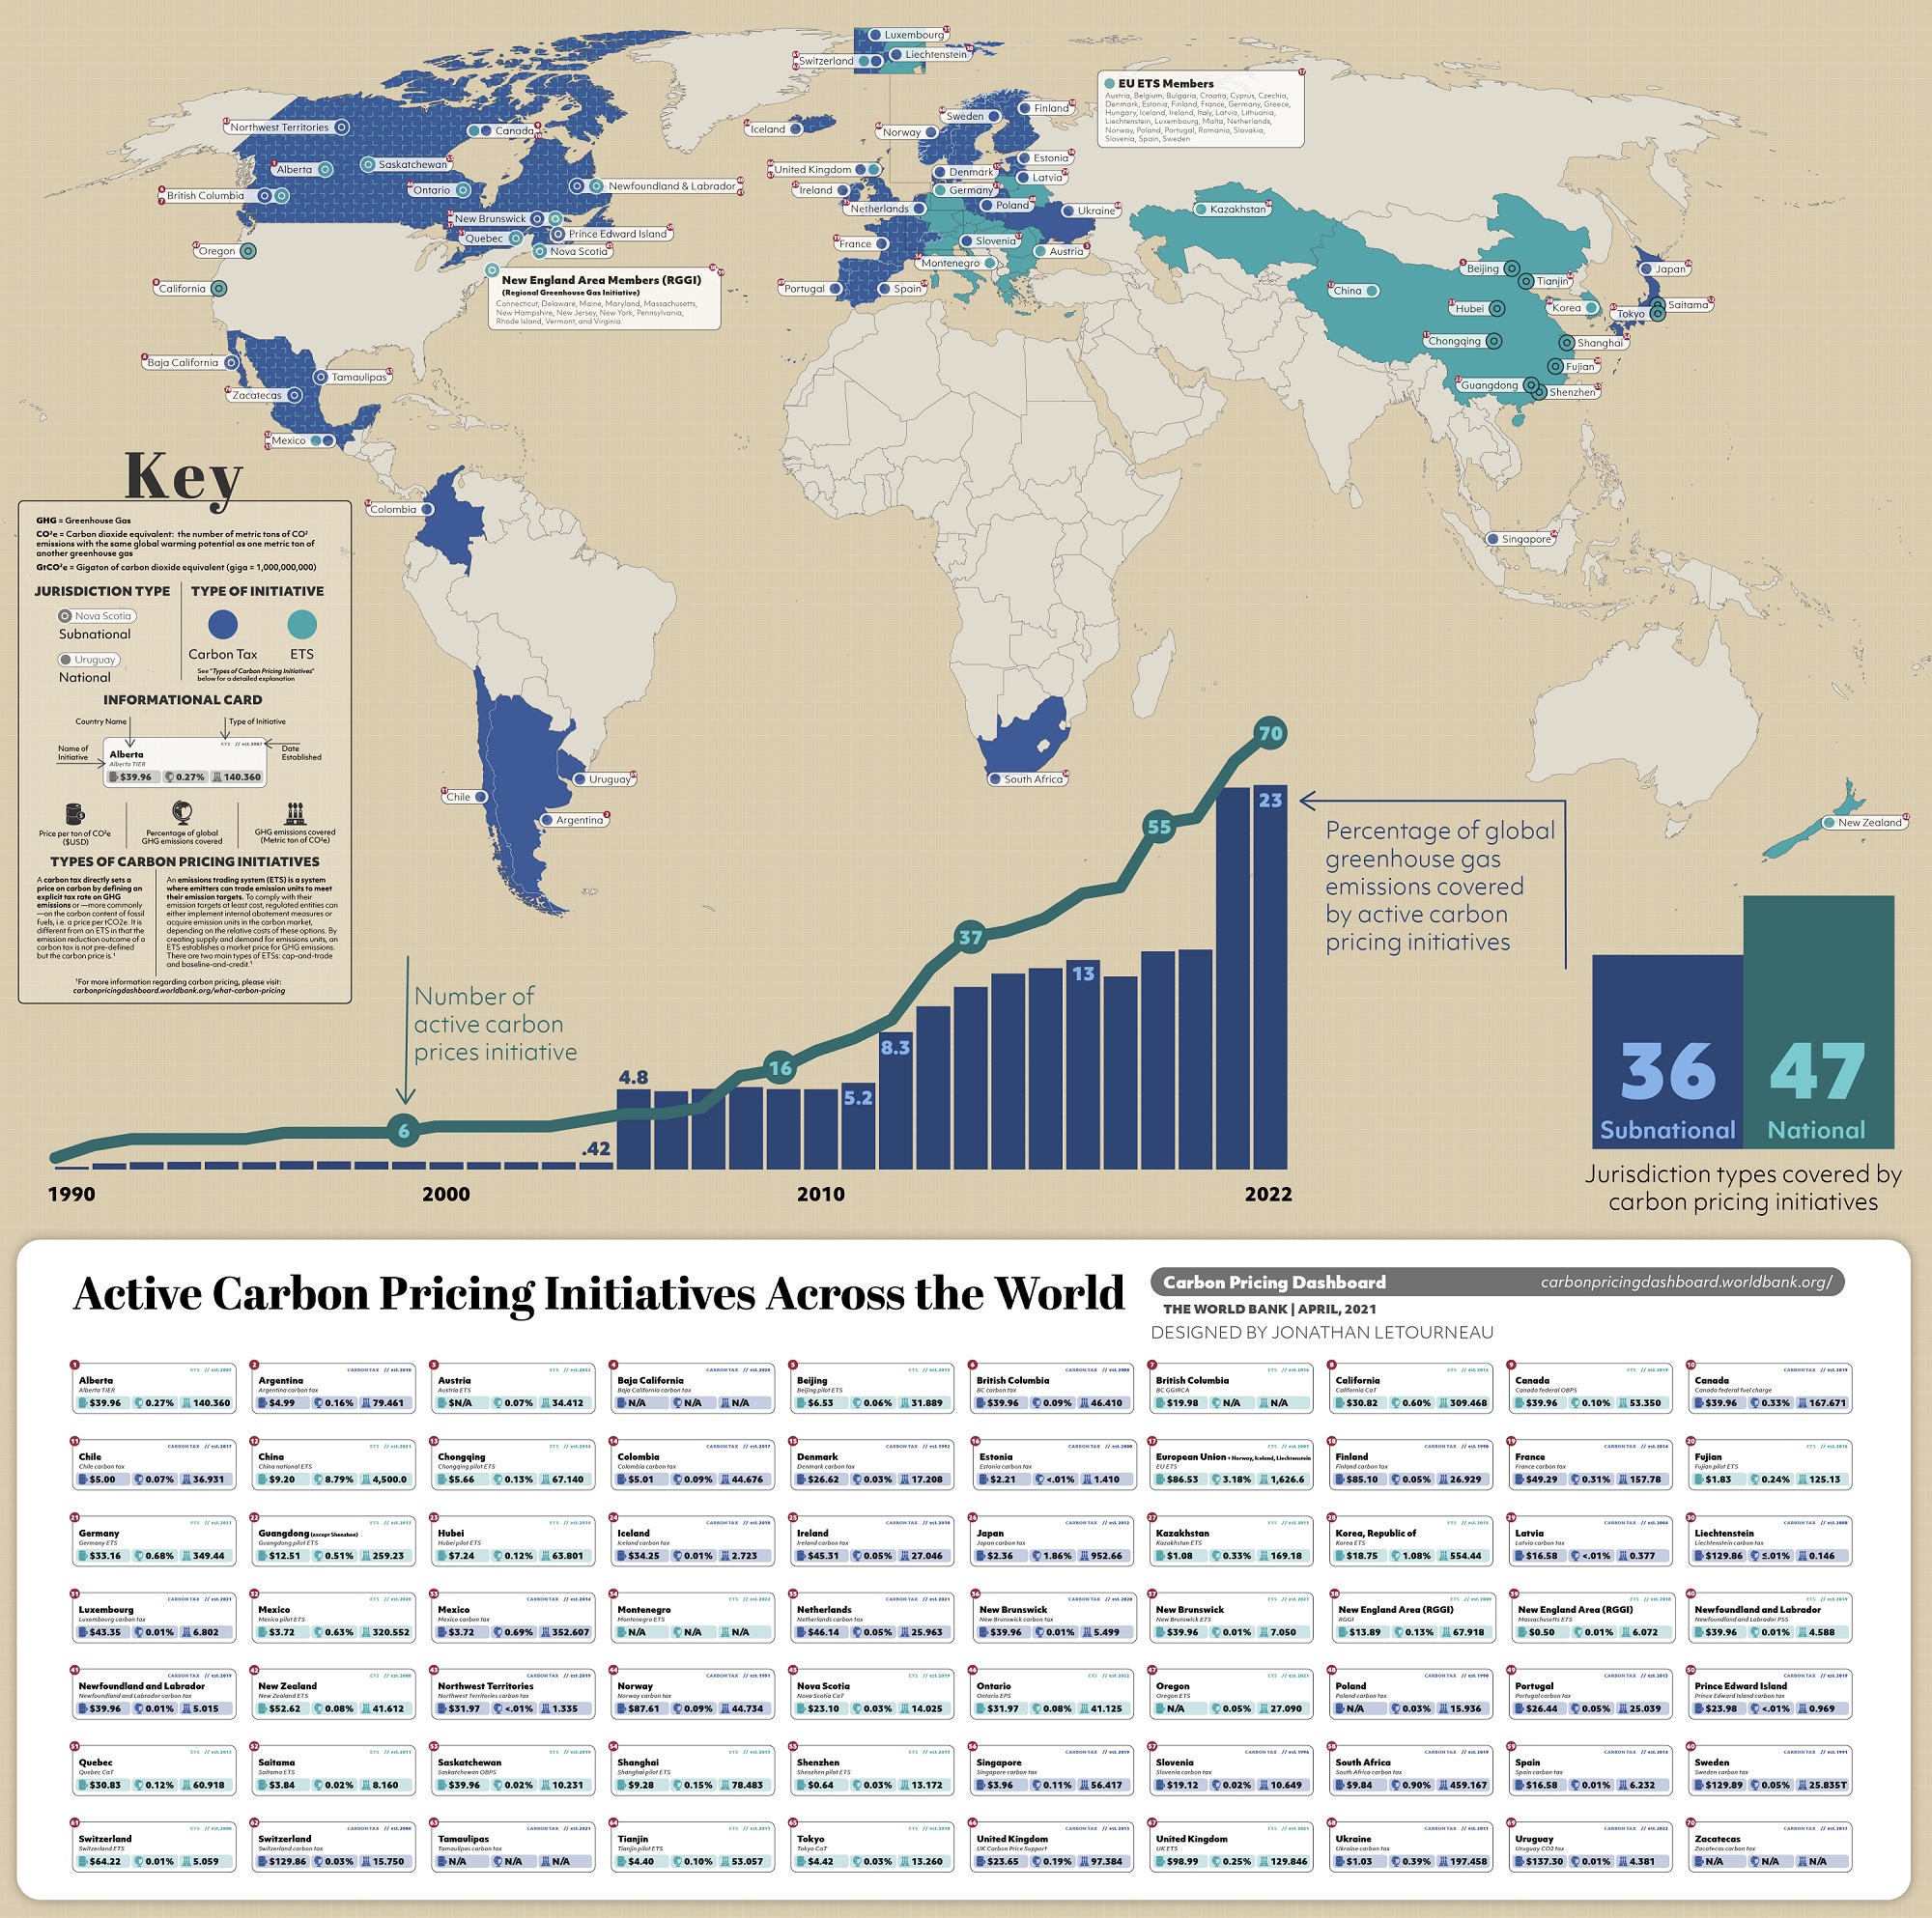
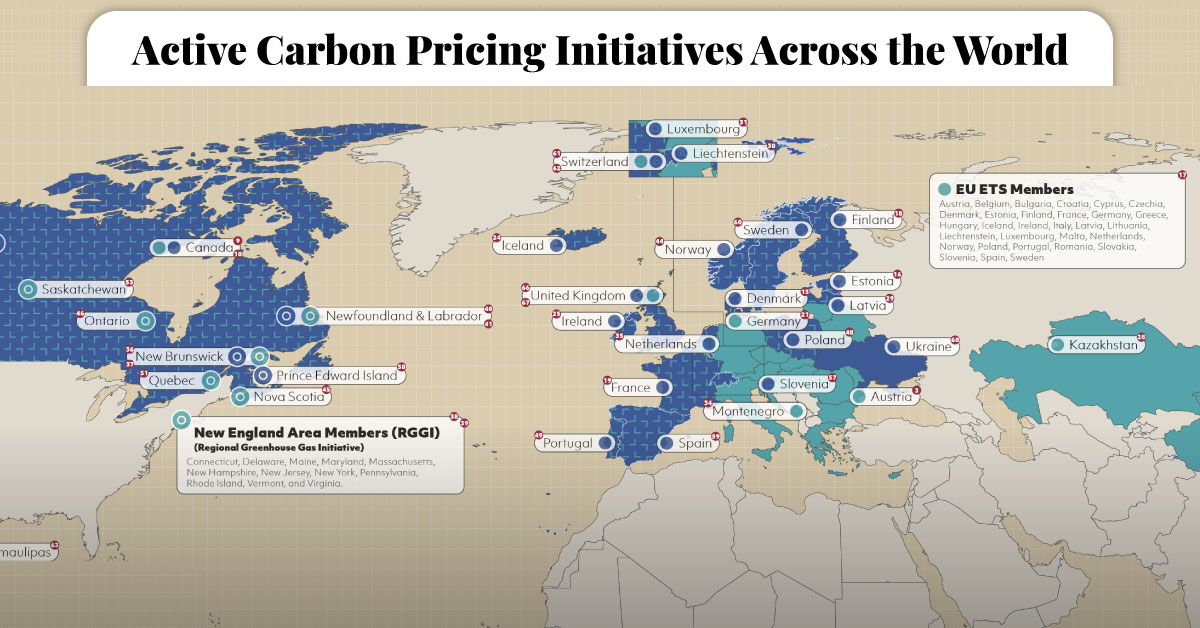
This graphic by Jonathan Letourneau maps 70 active carbon pricing initiatives around the world and highlights their global impact as seen in the 2022 World Bank report.
But first, let’s look at the different types of carbon pricing:
Carbon Tax vs. ETS
Broadly speaking, carbon pricing gives emission generating organizations a choice between reducing their carbon emissions and paying for them.
The two typical initiatives used to offer this choice are carbon taxes and emissions trading systems (ETS):
- Carbon tax: This tax or levy is directly applied to the production of carbon emissions or fuels that release greenhouse gases. This makes products or services that release substantial carbon more expensive than greener alternatives (or reducing emissions).
- Emissions Trading System (ETS): Also called the cap-and-trade system, ETS puts a cap on the total level of greenhouse gases a licensed industry can emit. Companies with low emissions can sell their unused emission allowance with larger emitters that have exceeded the cap.
The World’s Carbon Pricing Initiatives
As of the end of 2022, Europe was home to 24 of the 70 active carbon pricing initiatives in the world.
| Location | Carbon Pricing Type | CO2e Price Per Tonne (USD) | Emissions Covered (Tonnes) |
|---|---|---|---|
| 🇦🇷 Argentina | Carbon tax | $4.99 | 79.46 |
| 🇦🇹 Austria | ETS | N/A | 34.41 |
| 🇨🇦 Canada | ETS | $39.96 | 53.35 |
| 🇨🇦 Canada | Carbon tax | $39.96 | 167.67 |
| 🇨🇦 Canada - Alberta | ETS | $39.96 | 140.36 |
| 🇨🇦 Canada - British Columbia | ETS | $19.98 | N/A |
| 🇨🇦 Canada - British Columbia | Carbon tax | $39.96 | 46.41 |
| 🇨🇦 Canada - New Brunswick | ETS | $39.96 | 7.05 |
| 🇨🇦 Canada - New Brunswick | Carbon tax | $39.96 | 5.50 |
| 🇨🇦 Canada - Newfoundland and Labrador | ETS | $39.96 | 4.59 |
| 🇨🇦 Canada - Newfoundland and Labrador | Carbon tax | $39.96 | 5.01 |
| 🇨🇦 Canada - Northwest Territories | Carbon tax | $31.97 | 1.33 |
| 🇨🇦 Canada - Nova Scotia | ETS | $23.10 | 14.02 |
| 🇨🇦 Canada - Ontario | ETS | $31.97 | 41.12 |
| 🇨🇦 Canada - Prince Edward Island | Carbon tax | $23.98 | 0.97 |
| 🇨🇦 Canada - Quebec | ETS | $30.83 | 60.92 |
| 🇨🇦 Canada - Saskatchewan | ETS | $39.96 | 10.23 |
| 🇨🇱 Chile | Carbon tax | $5.00 | 36.93 |
| 🇨🇳 China | ETS | $9.20 | 4,500.00 |
| 🇨🇳 China - Beijing | ETS | $6.53 | 31.89 |
| 🇨🇳 China - Chongqing | ETS | $5.66 | 67.14 |
| 🇨🇳 China - Fujian | ETS | $1.83 | 125.13 |
| 🇨🇳 China - Guangdong (except Shenzhen) | ETS | $12.51 | 259.23 |
| 🇨🇳 China - Hubei | ETS | $7.24 | 63.80 |
| 🇨🇳 China - Shanghai | ETS | $9.28 | 78.48 |
| 🇨🇳 China - Shenzhen | ETS | $0.64 | 13.17 |
| 🇨🇳 China - Tianjin | ETS | $4.40 | 53.08 |
| 🇨🇴 Colombia | Carbon tax | $5.01 | 44.68 |
| 🇩🇰 Denmark | Carbon tax | $26.62 | 17.21 |
| 🇪🇪 Estonia | Carbon tax | $2.21 | 1.41 |
| 🇪🇺 EU - Norway, Iceland, Liechtenstein | ETS | $86.53 | 1,626.60 |
| 🇫🇮 Finland | Carbon tax | $85.10 | 26.93 |
| 🇫🇷 France | Carbon tax | $49.29 | 157.78 |
| 🇩🇪 Germany | ETS | $33.16 | 349.44 |
| 🇮🇸 Iceland | Carbon tax | $34.25 | 2.72 |
| 🇮🇪 Ireland | Carbon tax | $45.31 | 27.05 |
| 🇯🇵 Japan | Carbon tax | $2.36 | 952.66 |
| 🇯🇵 Japan - Saitama | ETS | $3.84 | 8.16 |
| 🇯🇵 Japan - Tokyo | ETS | $4.42 | 13.26 |
| 🇰🇿 Kazakhstan | ETS | $1.08 | 169.18 |
| 🇰🇷 Korea, Republic of | ETS | $18.75 | 554.44 |
| 🇱🇻 Latvia | Carbon tax | $16.58 | 0.38 |
| 🇱🇮 Liechtenstein | Carbon tax | $129.86 | 0.15 |
| 🇱🇺 Luxembourg | Carbon tax | $43.35 | 6.80 |
| 🇲🇽 Mexico | Carbon tax | $3.72 | 352.61 |
| 🇲🇽 Mexico | ETS | $3.72 | 320.55 |
| 🇲🇽 Mexico - Baja California | Carbon tax | N/A | N/A |
| 🇲🇽 Mexico - Tamaulipas | Carbon tax | N/A | N/A |
| 🇲🇽 Mexico - Zacatecas | Carbon tax | N/A | N/A |
| 🇲🇪 Montenegro | ETS | N/A | N/A |
| 🇳🇱 Netherlands | Carbon tax | $46.14 | 25.96 |
| 🇳🇿 New Zealand | ETS | $52.62 | 41.61 |
| 🇳🇴 Norway | Carbon tax | $87.61 | 44.73 |
| 🇵🇱 Poland | Carbon tax | N/A | 15.94 |
| 🇵🇹 Portugal | Carbon tax | $26.44 | 25.04 |
| 🇸🇬 Singapore | Carbon tax | $3.96 | 56.42 |
| 🇸🇮 Slovenia | Carbon tax | $19.12 | 10.65 |
| 🇿🇦 South Africa | Carbon tax | $9.84 | 459.17 |
| 🇪🇸 Spain | Carbon tax | $16.58 | 6.23 |
| 🇸🇪 Sweden | Carbon tax | $129.89 | 25.83 |
| 🇨🇭 Switzerland | ETS | $64.22 | 5.06 |
| 🇨🇭 Switzerland | Carbon tax | $129.86 | 15.75 |
| 🇺🇸 United States - California | ETS | $30.82 | 309.47 |
| 🇺🇸 United States - New England Area (RGGI) | ETS | $13.89 | 67.92 |
| 🇺🇸 United States - New England Area (RGGI) | ETS | $0.50 | 6.07 |
| 🇺🇸 United States - Oregon | ETS | N/A | 27.09 |
| 🇺🇦 Ukraine | Carbon tax | $1.03 | 197.46 |
| 🇬🇧 United Kingdom | Carbon tax | $23.65 | 97.38 |
| 🇬🇧 United Kingdom | ETS | $98.99 | 129.85 |
| 🇺🇾 Uruguay | Carbon tax | $137.30 | 4.38 |
Europe’s position is not surprising given many of its countries have set ambitious carbon neutral goals. The region’s European Union Emissions Trading System (EU ETS) is the world’s largest carbon market, covering 1.8 billion tonnes of emissions annually.
Canada has also implemented numerous regional and national carbon pricing initiatives, with many provinces falling under both main types of carbon pricing. For example, carbon emissions in British Columbia—the first jurisdiction in North America to implement carbon pricing—are priced under both a carbon tax and an ETS.
Meanwhile, the world’s largest emitter of greenhouse gases in 2021, China, implemented its much-awaited national ETS the same year. In just one year, the country’s traded carbon emission allowances crossed 200 million tonnes.
In the U.S., several states have implemented their own carbon pricing initiatives. California’s cap-and-trade initiative covers emissions from electricity, transportation, and industry, while the Regional Greenhouse Gas Initiative sets a cap on emissions from power plants of nine Northeastern states, including New York, Massachusetts, and Pennsylvania.
The Impact of Carbon Pricing
Putting a price on carbon emissions seems to have made an impact in reducing emissions.
In Europe, the EU ETS has helped reduce emissions from the power sector by 43% in the region since its inception in 2005.
Likewise, California’s Cap-and-Trade program has helped the state meet its goal of reducing carbon emissions back to 1990 levels.
In many jurisdictions, including China and Canada, there are plans to double down on carbon pricing plans, either by increasing the cost of carbon or lowering emissions limits.
But while many economists and policy makers have found carbon pricing to be the most efficient tool to curb emissions, they also point out that the programs themselves need to be designed well. Initiatives with limits that are too high or prices that are too low can be ineffectual, as well as giving certain major polluters exemptions from programs.

This article was published as a part of Visual Capitalist's Creator Program, which features data-driven visuals from some of our favorite Creators around the world.


Green
The Carbon Footprint of Major Travel Methods
Going on a cruise ship and flying domestically are the most carbon-intensive travel methods.


The Carbon Footprint of Major Travel Methods
This was originally posted on our Voronoi app. Download the app for free on iOS or Android and discover incredible data-driven charts from a variety of trusted sources.
Did you know that transport accounts for nearly one-quarter of global energy-related carbon dioxide (CO₂) emissions?
This graphic illustrates the carbon footprints of major travel methods measured in grams of carbon dioxide equivalent (CO₂e) emitted per person to travel one kilometer. This includes both CO₂ and other greenhouse gases.
Data is sourced from Our World in Data, the UK Government’s Department for Energy Security and Net Zero, and The International Council on Clean Transportation, as of December 2022.
These figures should be interpreted as approximations, rather than exact numbers. There are many variables at play that determine the actual carbon footprint in any individual case, including vehicle type or model, occupancy, energy mix, and even weather.
Cruise Ships are the Most Carbon-Intensive Travel Method
According to these estimates, taking a cruise ship, flying domestically, and driving alone are some of the most carbon-intensive travel methods.
Cruise ships typically use heavy fuel oil, which is high in carbon content. The average cruise ship weighs between 70,000 to 180,000 metric tons, meaning they require large engines to get moving.
These massive vessels must also generate power for onboard amenities such as lighting, air conditioning, and entertainment systems.
Short-haul flights are also considered carbon-intensive due to the significant amount of fuel consumed during initial takeoff and climbing altitude, relative to a lower amount of cruising.
| Transportation method | CO₂ equivalent emissions per passenger km |
|---|---|
| Cruise Ship | 250 |
| Short-haul flight (i.e. within a U.S. state or European country) | 246 |
| Diesel car | 171 |
| Gas car | 170 |
| Medium-haul flight (i.e. international travel within Europe, or between U.S. states) | 151 |
| Long-haul flight (over 3,700 km, about the distance from LA to NY) | 147 |
| Motorbike | 113 |
| Bus (average) | 96 |
| Plug-in hybrid | 68 |
| Electric car | 47 |
| National rail | 35 |
| Tram | 28 |
| London Underground | 27 |
| Ferry (foot passenger) | 19 |
| Eurostar (International rail) | 4.5 |
Are EVs Greener?
Many experts agree that EVs produce a lower carbon footprint over time versus traditional internal combustion engine (ICE) vehicles.
However, the batteries in electric vehicles charge on the power that comes straight off the electrical grid—which in many places may be powered by fossil fuels. For that reason, the carbon footprint of an EV will depend largely on the blend of electricity sources used for charging.
There are also questions about how energy-intensive it is to build EVs compared to a comparable ICE vehicle.

-

 Science1 week ago
Visualizing the Average Lifespans of Mammals
-

 Markets2 weeks ago
The Top 10 States by Real GDP Growth in 2023
-

 Demographics2 weeks ago
The Smallest Gender Wage Gaps in OECD Countries
-

 United States2 weeks ago
Where U.S. Inflation Hit the Hardest in March 2024
-

 Green2 weeks ago
Top Countries By Forest Growth Since 2001
-

 United States2 weeks ago
Ranked: The Largest U.S. Corporations by Number of Employees
-

 Maps2 weeks ago
The Largest Earthquakes in the New York Area (1970-2024)
-

 Green2 weeks ago
Ranked: The Countries With the Most Air Pollution in 2023