


Systems thinking, Data-informed design, UX
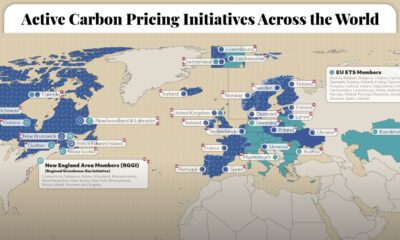

This graphic maps the 70 active carbon pricing initiatives worldwide, their established price of carbon, and the global emissions they cover.
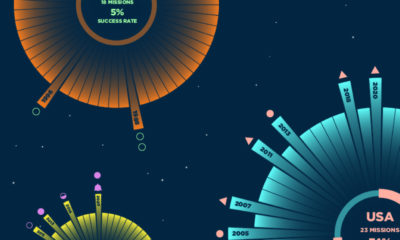

This graphic shows a timeline of every mission to Mars since 1960, highlighting which ones have been successful and which ones haven't.