Race to Net Zero: Carbon Neutral Goals by Country
The following content is sponsored by the National Public Utilities Council
Race to Net Zero: Carbon Neutral Goals by Country
The time to talk about net zero goals is running out, and the time to put them into action is well underway.
At the U.S. Climate Summit in April 2021, U.S. President Biden pressured countries to either speed up carbon neutral pledges, or commit to them in the first place.
It’s a follow-up to the Paris Agreement, which keeps signatories committed to reaching carbon neutrality in emissions in the second half of the 21st century. But 2050–2100 is a wide timeframe, and climate change is becoming both increasingly present and more dire.
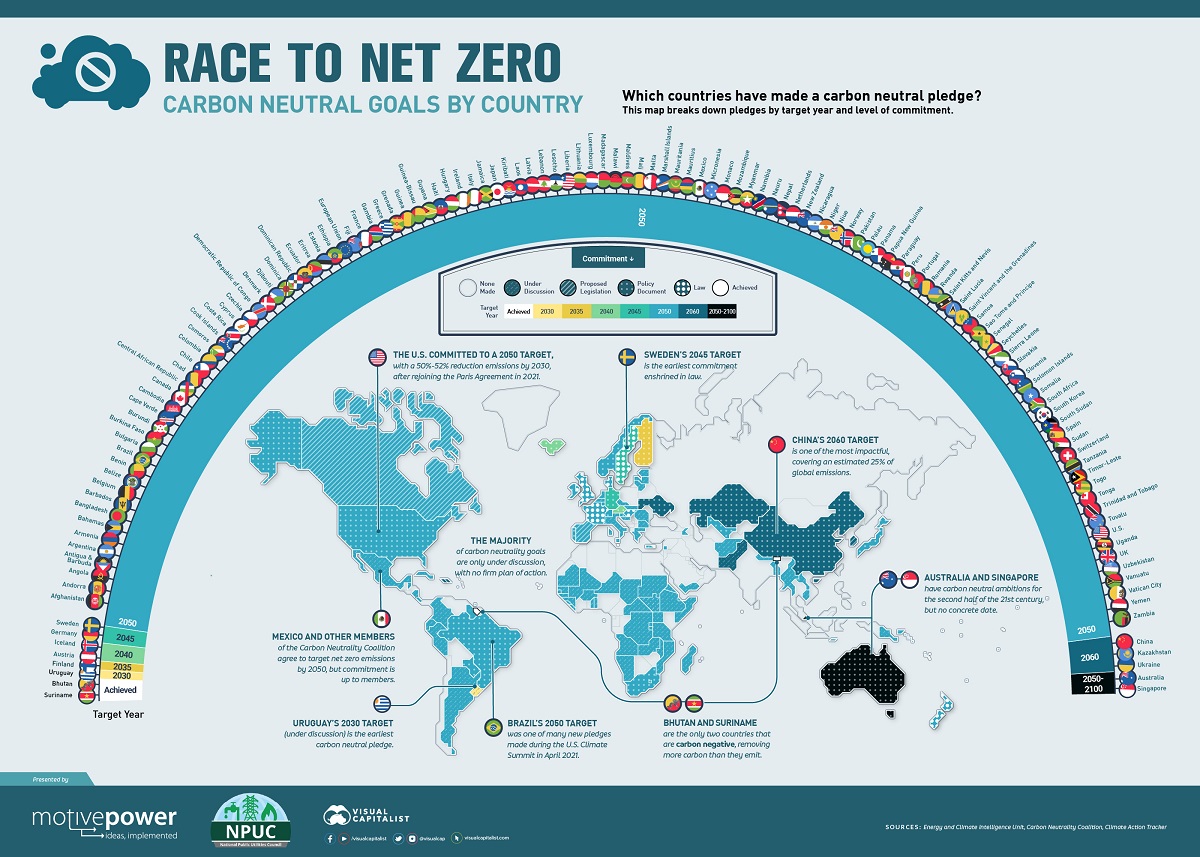
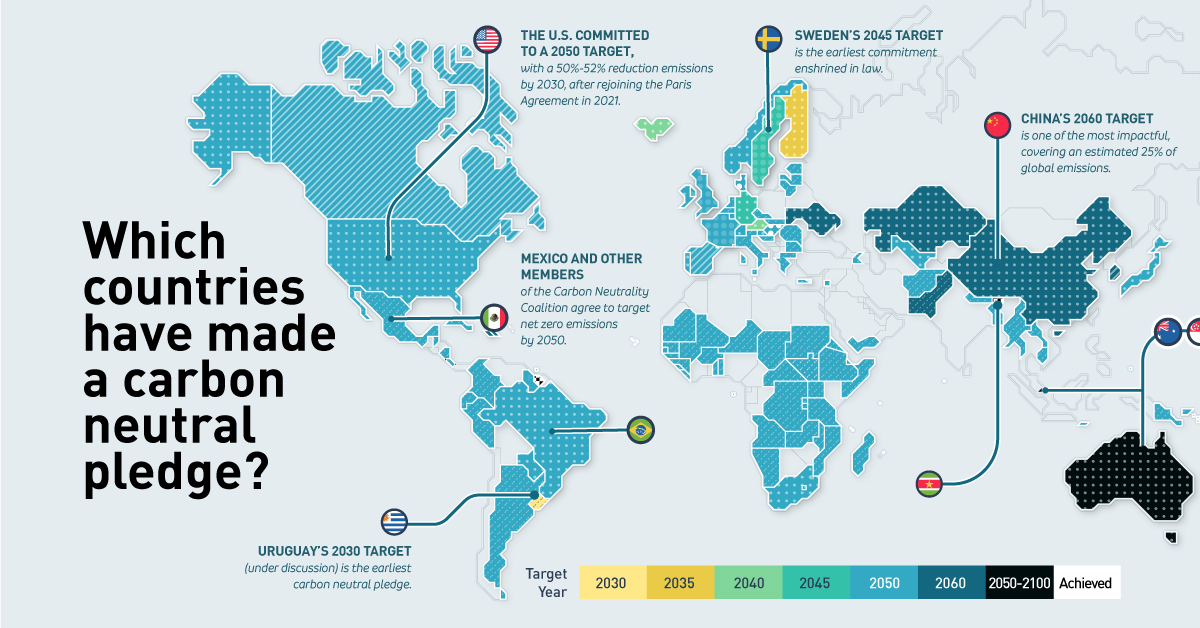
So when are countries committed to reaching net zero carbon emissions, and how serious is their pledge? This infographic from the National Public Utilities Council highlights the world’s carbon neutral pledges.
The Timeline of Carbon Neutral Targets by Country
The first question is how quickly countries are trying to get to net zero.
137 countries have committed to carbon neutrality, as tracked by the Energy and Climate Intelligence Unit and confirmed by pledges to the Carbon Neutrality Coalition and recent policy statements by governments.
But the earlier the pledge, the better, and most of the commitments are centered around 2050.
| Country | Target Year |
|---|---|
| Bhutan | Achieved |
| Suriname | Achieved |
| Uruguay | 2030 |
| Finland | 2035 |
| Austria | 2040 |
| Iceland | 2040 |
| Germany | 2045 |
| Sweden | 2045 |
| Afghanistan | 2050 |
| Andorra | 2050 |
| Angola | 2050 |
| Antigua and Barbuda | 2050 |
| Argentina | 2050 |
| Armenia | 2050 |
| Bahamas | 2050 |
| Bangladesh | 2050 |
| Barbados | 2050 |
| Belgium | 2050 |
| Belize | 2050 |
| Benin | 2050 |
| Brazil | 2050 |
| Bulgaria | 2050 |
| Burkina Faso | 2050 |
| Burundi | 2050 |
| Cabo Verde | 2050 |
| Cambodia | 2050 |
| Canada | 2050 |
| Central African Republic | 2050 |
| Chad | 2050 |
| Chile | 2050 |
| Colombia | 2050 |
| Comoros | 2050 |
| Cook Islands | 2050 |
| Costa Rica | 2050 |
| Croatia | 2050 |
| Cyprus | 2050 |
| Czechia | 2050 |
| Democratic Republic of Congo | 2050 |
| Denmark | 2050 |
| Djibouti | 2050 |
| Dominica | 2050 |
| Dominican Republic | 2050 |
| Ecuador | 2050 |
| Eritrea | 2050 |
| Estonia | 2050 |
| Ethiopia | 2050 |
| European Union | 2050 |
| Fiji | 2050 |
| France | 2050 |
| Gambia | 2050 |
| Greece | 2050 |
| Grenada | 2050 |
| Guinea | 2050 |
| Guinea-Bissau | 2050 |
| Guyana | 2050 |
| Haiti | 2050 |
| Hungary | 2050 |
| Ireland | 2050 |
| Italy | 2050 |
| Jamaica | 2050 |
| Japan | 2050 |
| Kiribati | 2050 |
| Laos | 2050 |
| Latvia | 2050 |
| Lebanon | 2050 |
| Lesotho | 2050 |
| Liberia | 2050 |
| Lithuania | 2050 |
| Luxembourg | 2050 |
| Madagascar | 2050 |
| Malawi | 2050 |
| Maldives | 2050 |
| Mali | 2050 |
| Malta | 2050 |
| Marshall Islands | 2050 |
| Mauritania | 2050 |
| Mauritius | 2050 |
| Mexico | 2050 |
| Micronesia | 2050 |
| Monaco | 2050 |
| Mozambique | 2050 |
| Myanmar | 2050 |
| Namibia | 2050 |
| Nauru | 2050 |
| Nepal | 2050 |
| Netherlands | 2050 |
| New Zealand | 2050 |
| Nicaragua | 2050 |
| Niger | 2050 |
| Niue | 2050 |
| Norway | 2050 |
| Pakistan | 2050 |
| Palau | 2050 |
| Panama | 2050 |
| Papua New Guinea | 2050 |
| Paraguay | 2050 |
| Peru | 2050 |
| Portugal | 2050 |
| Romania | 2050 |
| Rwanda | 2050 |
| Saint Kitts and Nevis | 2050 |
| Saint Lucia | 2050 |
| Saint Vincent and the Grenadines | 2050 |
| Samoa | 2050 |
| Sao Tome and Principe | 2050 |
| Senegal | 2050 |
| Seychelles | 2050 |
| Sierra Leone | 2050 |
| Slovakia | 2050 |
| Slovenia | 2050 |
| Solomon Islands | 2050 |
| Somalia | 2050 |
| South Africa | 2050 |
| South Korea | 2050 |
| South Sudan | 2050 |
| Spain | 2050 |
| Sudan | 2050 |
| Switzerland | 2050 |
| Tanzania | 2050 |
| Timor-Leste | 2050 |
| Togo | 2050 |
| Tonga | 2050 |
| Trinidad and Tobago | 2050 |
| Tuvalu | 2050 |
| U.S. | 2050 |
| Uganda | 2050 |
| United Kingdom | 2050 |
| Uzbekistan | 2050 |
| Vanuatu | 2050 |
| Vatican City | 2050 |
| Yemen | 2050 |
| Zambia | 2050 |
| China | 2060 |
| Kazakhstan | 2060 |
| Ukraine | 2060 |
| Australia | 2050 – 2100 |
| Singapore | 2050 – 2100 |
As far as early achievers go, Bhutan and Suriname are the only two countries that have achieved carbon neutrality and are actually carbon negative (removing more carbon than they emit). Uruguay’s 2030 target is the earliest to try and match that feat, followed by Europe’s Finland, Austria, Iceland, Germany, and Sweden, who are all targeting 2045 or earlier.
Over 90%, or 124 of the 137 countries tracked above, set a target of 2050 for reaching carbon neutrality. This is largely due to membership in the Carbon Neutrality Coalition, which asks member states to target 2050 for their goal but leaves commitment up to them.
Only five countries have net zero pledges set for after 2050, including Australia and Singapore, which haven’t set a firm target yet. Targeting 2060, in addition to Ukraine and Kazakhstan, is the world’s largest emitter, China. The country’s recent pledge is significant, since China accounts for an estimated 25% of global emissions.
In fact, according to the Climate Action Tracker, 73% of global emissions are currently covered by net zero targets.
How Seriously Are Countries Committing to Carbon Neutrality?
Setting a goal is perhaps the easiest step towards carbon neutrality. But the real challenge is in solidifying that goal and starting to make progress towards it. That’s why it’s important to consider how deeply committed each country’s carbon neutral pledge truly is.
The most rigid commitments are enshrined in law, followed by official government policy, though the latter can change alongside governments. Likewise, proposed legislation shows forward momentum in making pledges a reality, but proposals can take a long time to become enacted (or get derailed).
As it turns out, the vast majority of carbon neutral targets are only under discussion, with no formal action being taken to act on them.
| Country | Target Status |
|---|---|
| Bhutan | Achieved |
| Suriname | Achieved |
| Denmark | Law |
| France | Law |
| Hungary | Law |
| New Zealand | Law |
| Sweden | Law |
| United Kingdom | Law |
| Andorra | Policy Document |
| Australia | Policy Document |
| Austria | Policy Document |
| Brazil | Policy Document |
| China | Policy Document |
| Costa Rica | Policy Document |
| Finland | Policy Document |
| Germany | Policy Document |
| Iceland | Policy Document |
| Ireland | Policy Document |
| Japan | Policy Document |
| Kazakhstan | Policy Document |
| Marshall Islands | Policy Document |
| Norway | Policy Document |
| Panama | Policy Document |
| Paraguay | Policy Document |
| Portugal | Policy Document |
| Slovenia | Policy Document |
| South Africa | Policy Document |
| Switzerland | Policy Document |
| U.S. | Policy Document |
| Ukraine | Policy Document |
| Uzbekistan | Policy Document |
| Vatican City | Policy Document |
| Canada | Proposed Legislation |
| Chile | Proposed Legislation |
| European Union | Proposed Legislation |
| Fiji | Proposed Legislation |
| South Korea | Proposed Legislation |
| Spain | Proposed Legislation |
| Afghanistan | Under Discussion |
| Angola | Under Discussion |
| Antigua and Barbuda | Under Discussion |
| Argentina | Under Discussion |
| Armenia | Under Discussion |
| Bahamas | Under Discussion |
| Bangladesh | Under Discussion |
| Barbados | Under Discussion |
| Belgium | Under Discussion |
| Belize | Under Discussion |
| Benin | Under Discussion |
| Bulgaria | Under Discussion |
| Burkina Faso | Under Discussion |
| Burundi | Under Discussion |
| Cabo Verde | Under Discussion |
| Cambodia | Under Discussion |
| Central African Republic | Under Discussion |
| Chad | Under Discussion |
| Colombia | Under Discussion |
| Comoros | Under Discussion |
| Cook Islands | Under Discussion |
| Croatia | Under Discussion |
| Cyprus | Under Discussion |
| Czechia | Under Discussion |
| Democratic Republic of Congo | Under Discussion |
| Djibouti | Under Discussion |
| Dominica | Under Discussion |
| Dominican Republic | Under Discussion |
| Ecuador | Under Discussion |
| Eritrea | Under Discussion |
| Estonia | Under Discussion |
| Ethiopia | Under Discussion |
| Gambia | Under Discussion |
| Greece | Under Discussion |
| Grenada | Under Discussion |
| Guinea | Under Discussion |
| Guinea-Bissau | Under Discussion |
| Guyana | Under Discussion |
| Haiti | Under Discussion |
| Italy | Under Discussion |
| Jamaica | Under Discussion |
| Kiribati | Under Discussion |
| Laos | Under Discussion |
| Latvia | Under Discussion |
| Lebanon | Under Discussion |
| Lesotho | Under Discussion |
| Liberia | Under Discussion |
| Lithuania | Under Discussion |
| Luxembourg | Under Discussion |
| Madagascar | Under Discussion |
| Malawi | Under Discussion |
| Maldives | Under Discussion |
| Mali | Under Discussion |
| Malta | Under Discussion |
| Mauritania | Under Discussion |
| Mauritius | Under Discussion |
| Mexico | Under Discussion |
| Micronesia | Under Discussion |
| Monaco | Under Discussion |
| Mozambique | Under Discussion |
| Myanmar | Under Discussion |
| Namibia | Under Discussion |
| Nauru | Under Discussion |
| Nepal | Under Discussion |
| Netherlands | Under Discussion |
| Nicaragua | Under Discussion |
| Niger | Under Discussion |
| Niue | Under Discussion |
| Pakistan | Under Discussion |
| Palau | Under Discussion |
| Papua New Guinea | Under Discussion |
| Peru | Under Discussion |
| Romania | Under Discussion |
| Rwanda | Under Discussion |
| Saint Kitts and Nevis | Under Discussion |
| Saint Lucia | Under Discussion |
| Saint Vincent and the Grenadines | Under Discussion |
| Samoa | Under Discussion |
| Sao Tome and Principe | Under Discussion |
| Senegal | Under Discussion |
| Seychelles | Under Discussion |
| Sierra Leone | Under Discussion |
| Singapore | Under Discussion |
| Slovakia | Under Discussion |
| Solomon Islands | Under Discussion |
| Somalia | Under Discussion |
| South Sudan | Under Discussion |
| Sudan | Under Discussion |
| Tanzania | Under Discussion |
| Timor-Leste | Under Discussion |
| Togo | Under Discussion |
| Tonga | Under Discussion |
| Trinidad and Tobago | Under Discussion |
| Tuvalu | Under Discussion |
| Uganda | Under Discussion |
| Uruguay | Under Discussion |
| Vanuatu | Under Discussion |
| Yemen | Under Discussion |
| Zambia | Under Discussion |
Uruguay’s 2030 target might be the earliest, but it is not yet set in stone. The earliest commitment actually enshrined in law is Sweden’s 2045 target.
Including Sweden, only six countries have passed their carbon neutral targets into law. They include Denmark, France, Hungary, New Zealand, and the UK.
An additional five countries have proposed legislation in the works, including Canada and South Korea, as well as the entirety of the EU.
Meanwhile, 24 countries have their climate targets set as official policy. They include Brazil, China, Germany and the U.S., some of the world’s largest emitters.
99 of the 137 pledges are only under discussion at this time, or more than 72%. That means that they have no official standing as of yet, and are harder to act on. But as time starts to pass, pressure on countries to act on their carbon neutral pledges is beginning to grow.
The National Public Utilities Council is the go-to resource for all things decarbonization in the utilities industry. Learn more.
-

 Sponsored3 years ago
More Than Precious: Silver’s Role in the New Energy Era (Part 3 of 3)
Long known as a precious metal, silver in solar and EV technologies will redefine its role and importance to a greener economy.
-
 Sponsored7 years ago
The History and Evolution of the Video Games Market
Everything from Pong to the rise of mobile gaming and AR/VR. Learn about the $100 billion video games market in this giant infographic.
-
 Sponsored8 years ago
The Extraordinary Raw Materials in an iPhone 6s
Over 700 million iPhones have now been sold, but the iPhone would not exist if it were not for the raw materials that make the technology...
-
 Sponsored8 years ago
The Industrial Internet, and How It’s Revolutionizing Mining
The convergence of the global industrial sector with big data and the internet of things, or the Industrial Internet, will revolutionize how mining works.