
We visualized the top U.S. companies by employees, revealing the massive scale of retailers like Walmart, Target, and Home Depot.


click for more →


Scan with your phone's camera or QR code app to view
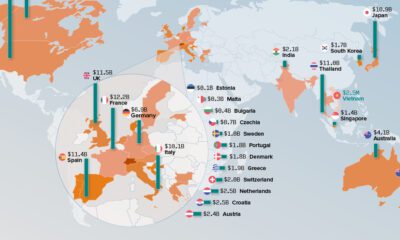

Between 2019 and 2021, consumers enjoyed over $158 billion in combined savings because of the economic impact of online travel agencies.
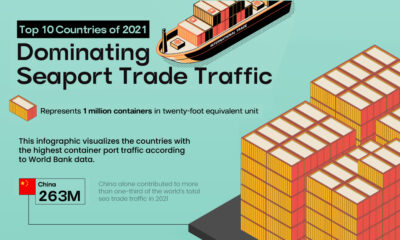

This infographic highlights the countries with the highest container traffic across their ports, thus dominating seaport trade in 2021.
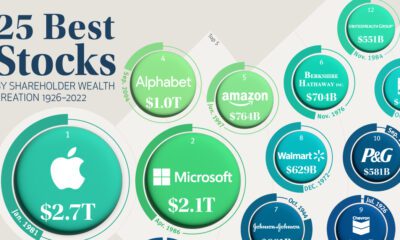

Accounting for just 0.1% of all public U.S. stocks, these companies have created nearly a third of all shareholder wealth since 1926.
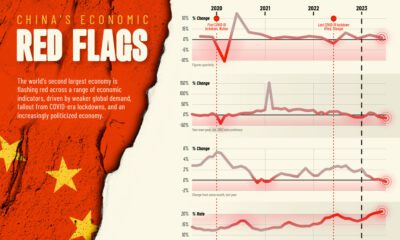

We chart six red flag indicators threatening China's economy and it's post-pandemic recovery, as well as global economic growth
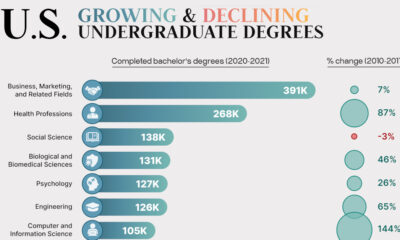

Which degrees have increased in popularity over the last decade? And which disciplines have seen fewer and fewer students?
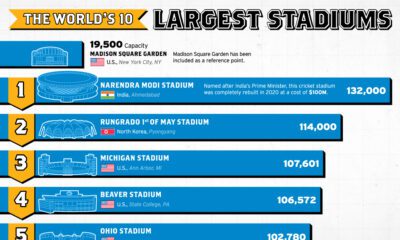

The U.S. is known for its massive arenas, but in a top 10 ranking of the world's largest stadiums, two other countries take the lead.
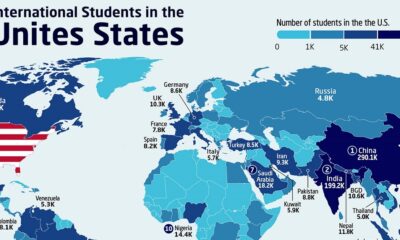

Nearly one million international students are enrolled at U.S. colleges and universities. Where do they all come from?
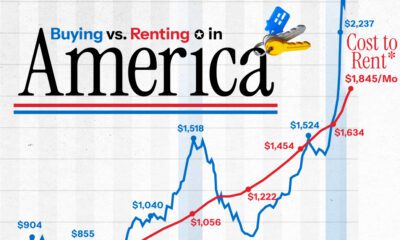

The U.S. has witnessed the biggest numerical gap in the monthly cost between buying a home and renting in over 50 years.
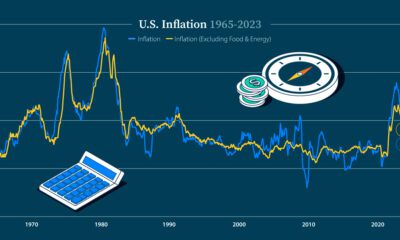

Will the Federal Reserve achieve a soft landing? Here are key factors that play an important role in the direction of the U.S. economy.
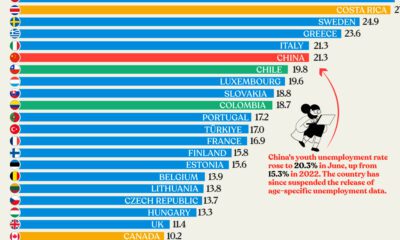

Nearly three years after COVID-19 first hit, youth unemployment in some countries, like China, has risen sharply.
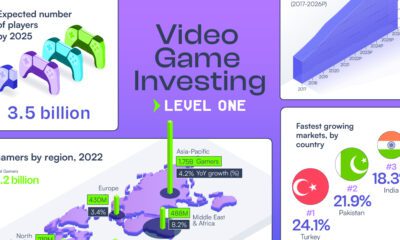

With 3.2 billion global gamers and $227 billion projected revenue in 2023, the video games industry presents diverse investment chances.


Who are the wealthiest people in the United States? This map breaks down the richest billionaires in U.S. states.


The world's millionaire population has more than doubled in the last decade between 2012 and 2022. We visualize these numbers here.
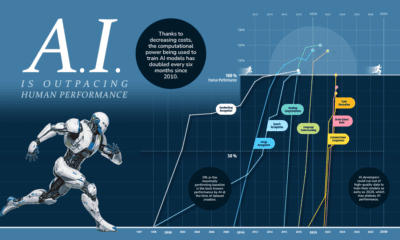

Progress in computation ability, data availability, and algorithm efficiency has led to rapid gains in performance for AI vs humans.
Antarctica's ice extent has reached record lows. This visual details and maps Antarctica sea ice loss over the last two years.


We visualize Earth’s history through the geological timeline to reveal the planet’s many epochs, including the Anthropocene.


The generative AI boom is powered by processors. How have AI chip sales grown over the last two years among Nvidia vs AMD vs Intel?


 Creator Program