
The earthquake that shook buildings across New York in April 2024 was the third-largest quake in the Northeast U.S. over...


click for more →


Scan with your phone's camera or QR code app to view
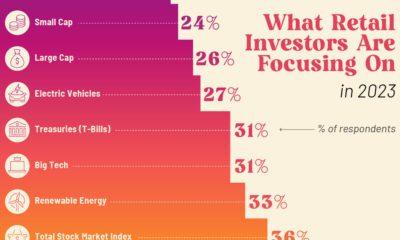

What key themes and strategies are retail investors looking at for the rest of 2023? Preview: AI is a popular choice.
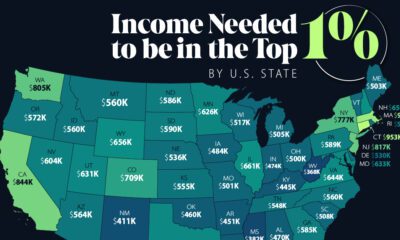

An annual income anywhere between $360,000-$950,000 can grant entry into the top 1%—depending on where you live in America.
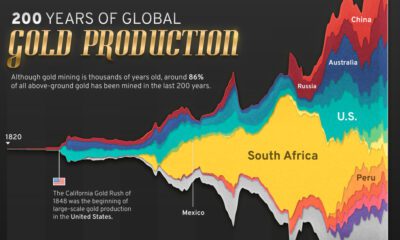

Global gold production has grown exponentially since the 1800s, with 86% of all above-ground gold mined in the last 200 years.
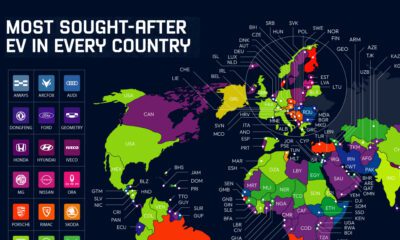

Industry stars, new entrants, and local models all populate this map of the most searched-for electric vehicles by country in 2022.


Despite Starlink’s dominance in the industry, the company is set to face intense competition in the coming years.
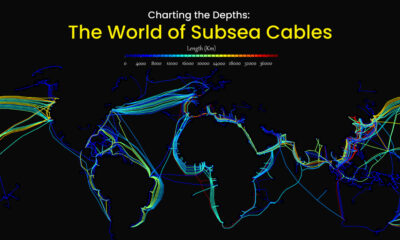

Hidden beneath the waves and sprawling along the ocean floor, subsea cables account for approximately 95% of international data transmitted.
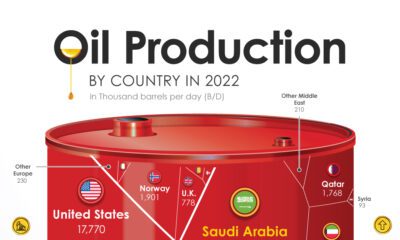

Just three countries—the U.S., Saudi Arabia and Russia—make up the lion’s share of global oil supply. Here are the biggest oil producers in 2022.
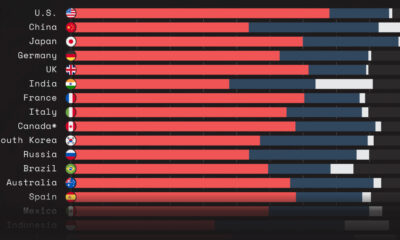

This graphic shows GDP by country, broken down into three main sectors: services, industry, and agriculture.
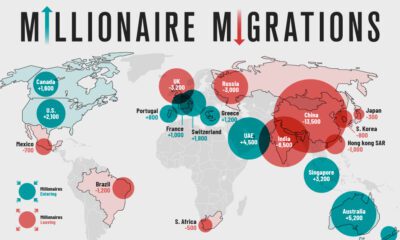

Where do the world's wealthiest people want to live? This map tracks the migration of the world's High Net Worth Individuals (HNWIs).
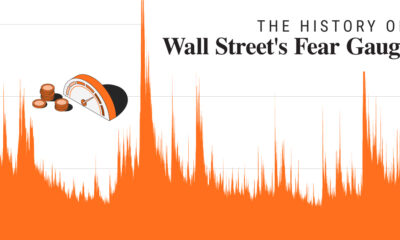

In 2023, market volatility has fallen dramatically. In this graphic, we show how it compares to historical trends.
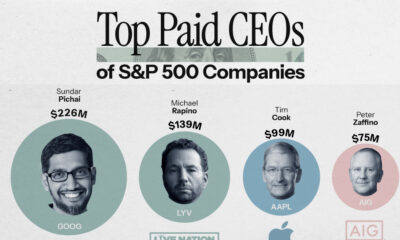

This graphic reveals the top 20 highest paid CEOs in the S&P 500 from Sundar Pichai to Jamie Dimon.


Considering factors like the cost of investment and number of locations, this graphic breaks down the best franchises in the U.S.
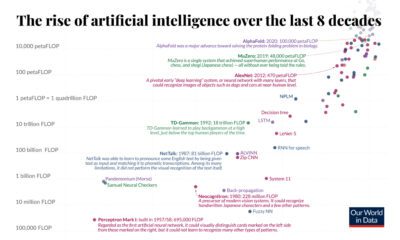

In eight decades, artificial intelligence has moved from purview of science fiction to reality. Here’s a quick history of AI computation.
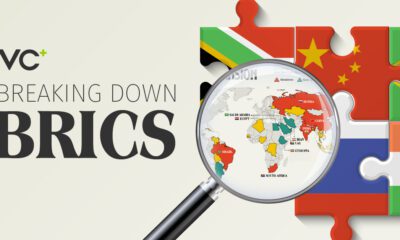

This month's VC+ special dispatches feature a deep dive into BRICS’ history and markets this month.


Check out the Fra Mauro Mappa Mundi (c. 1450s), a historical map that formed a bridge between medieval and renaissance worldviews.
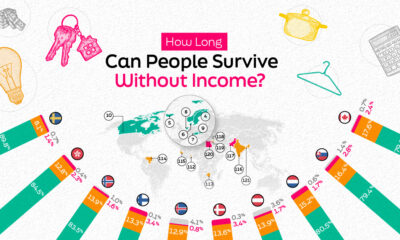

Income security is critical in resilience. In this graphic, we explore how secure people are and how long they could live without income.
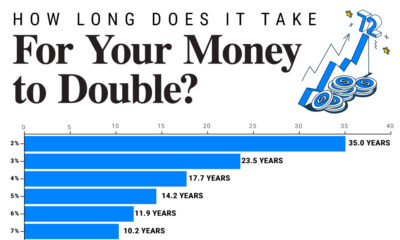

Since 1949, the S&P 500 has doubled in value 10 times. We show how long it takes to double your money across a range of annualized...


 Creator Program