Technology
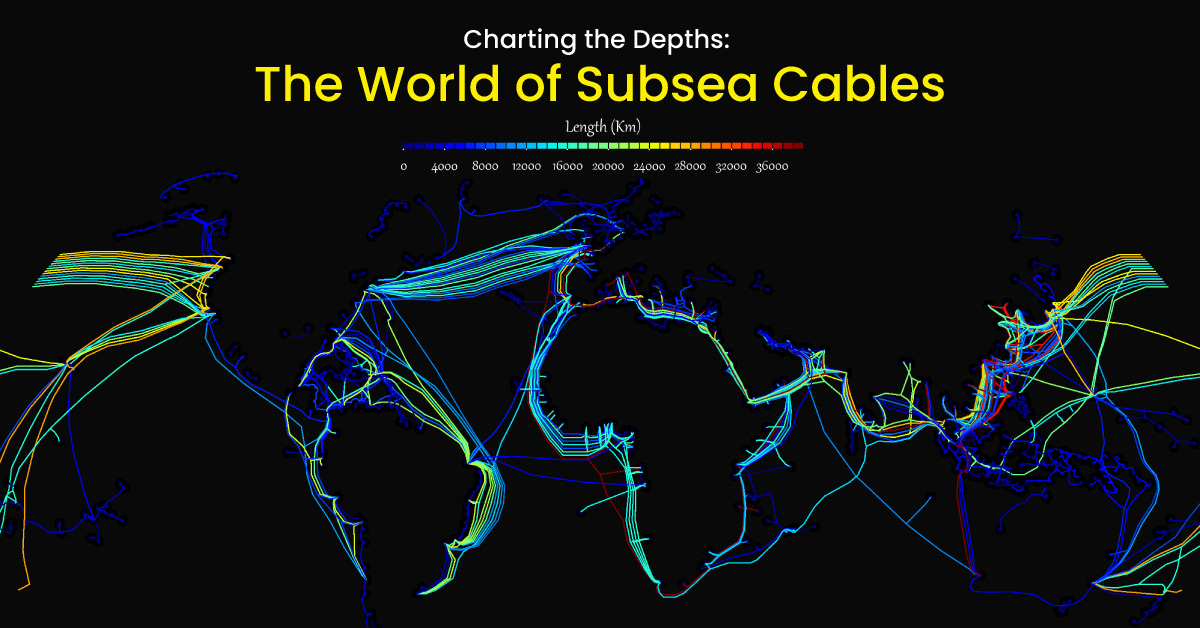
Charting the Depths: The World of Subsea Cables
Article/Editing:
Charting the Depths: The World of Subsea Cables
Data may be stored in the “cloud,” but when it comes to sending and receiving data, a lot of that action is actually happening along the depths of the ocean floor.
Hidden beneath the waves, these subsea cables account for approximately 95% of international data transmission.
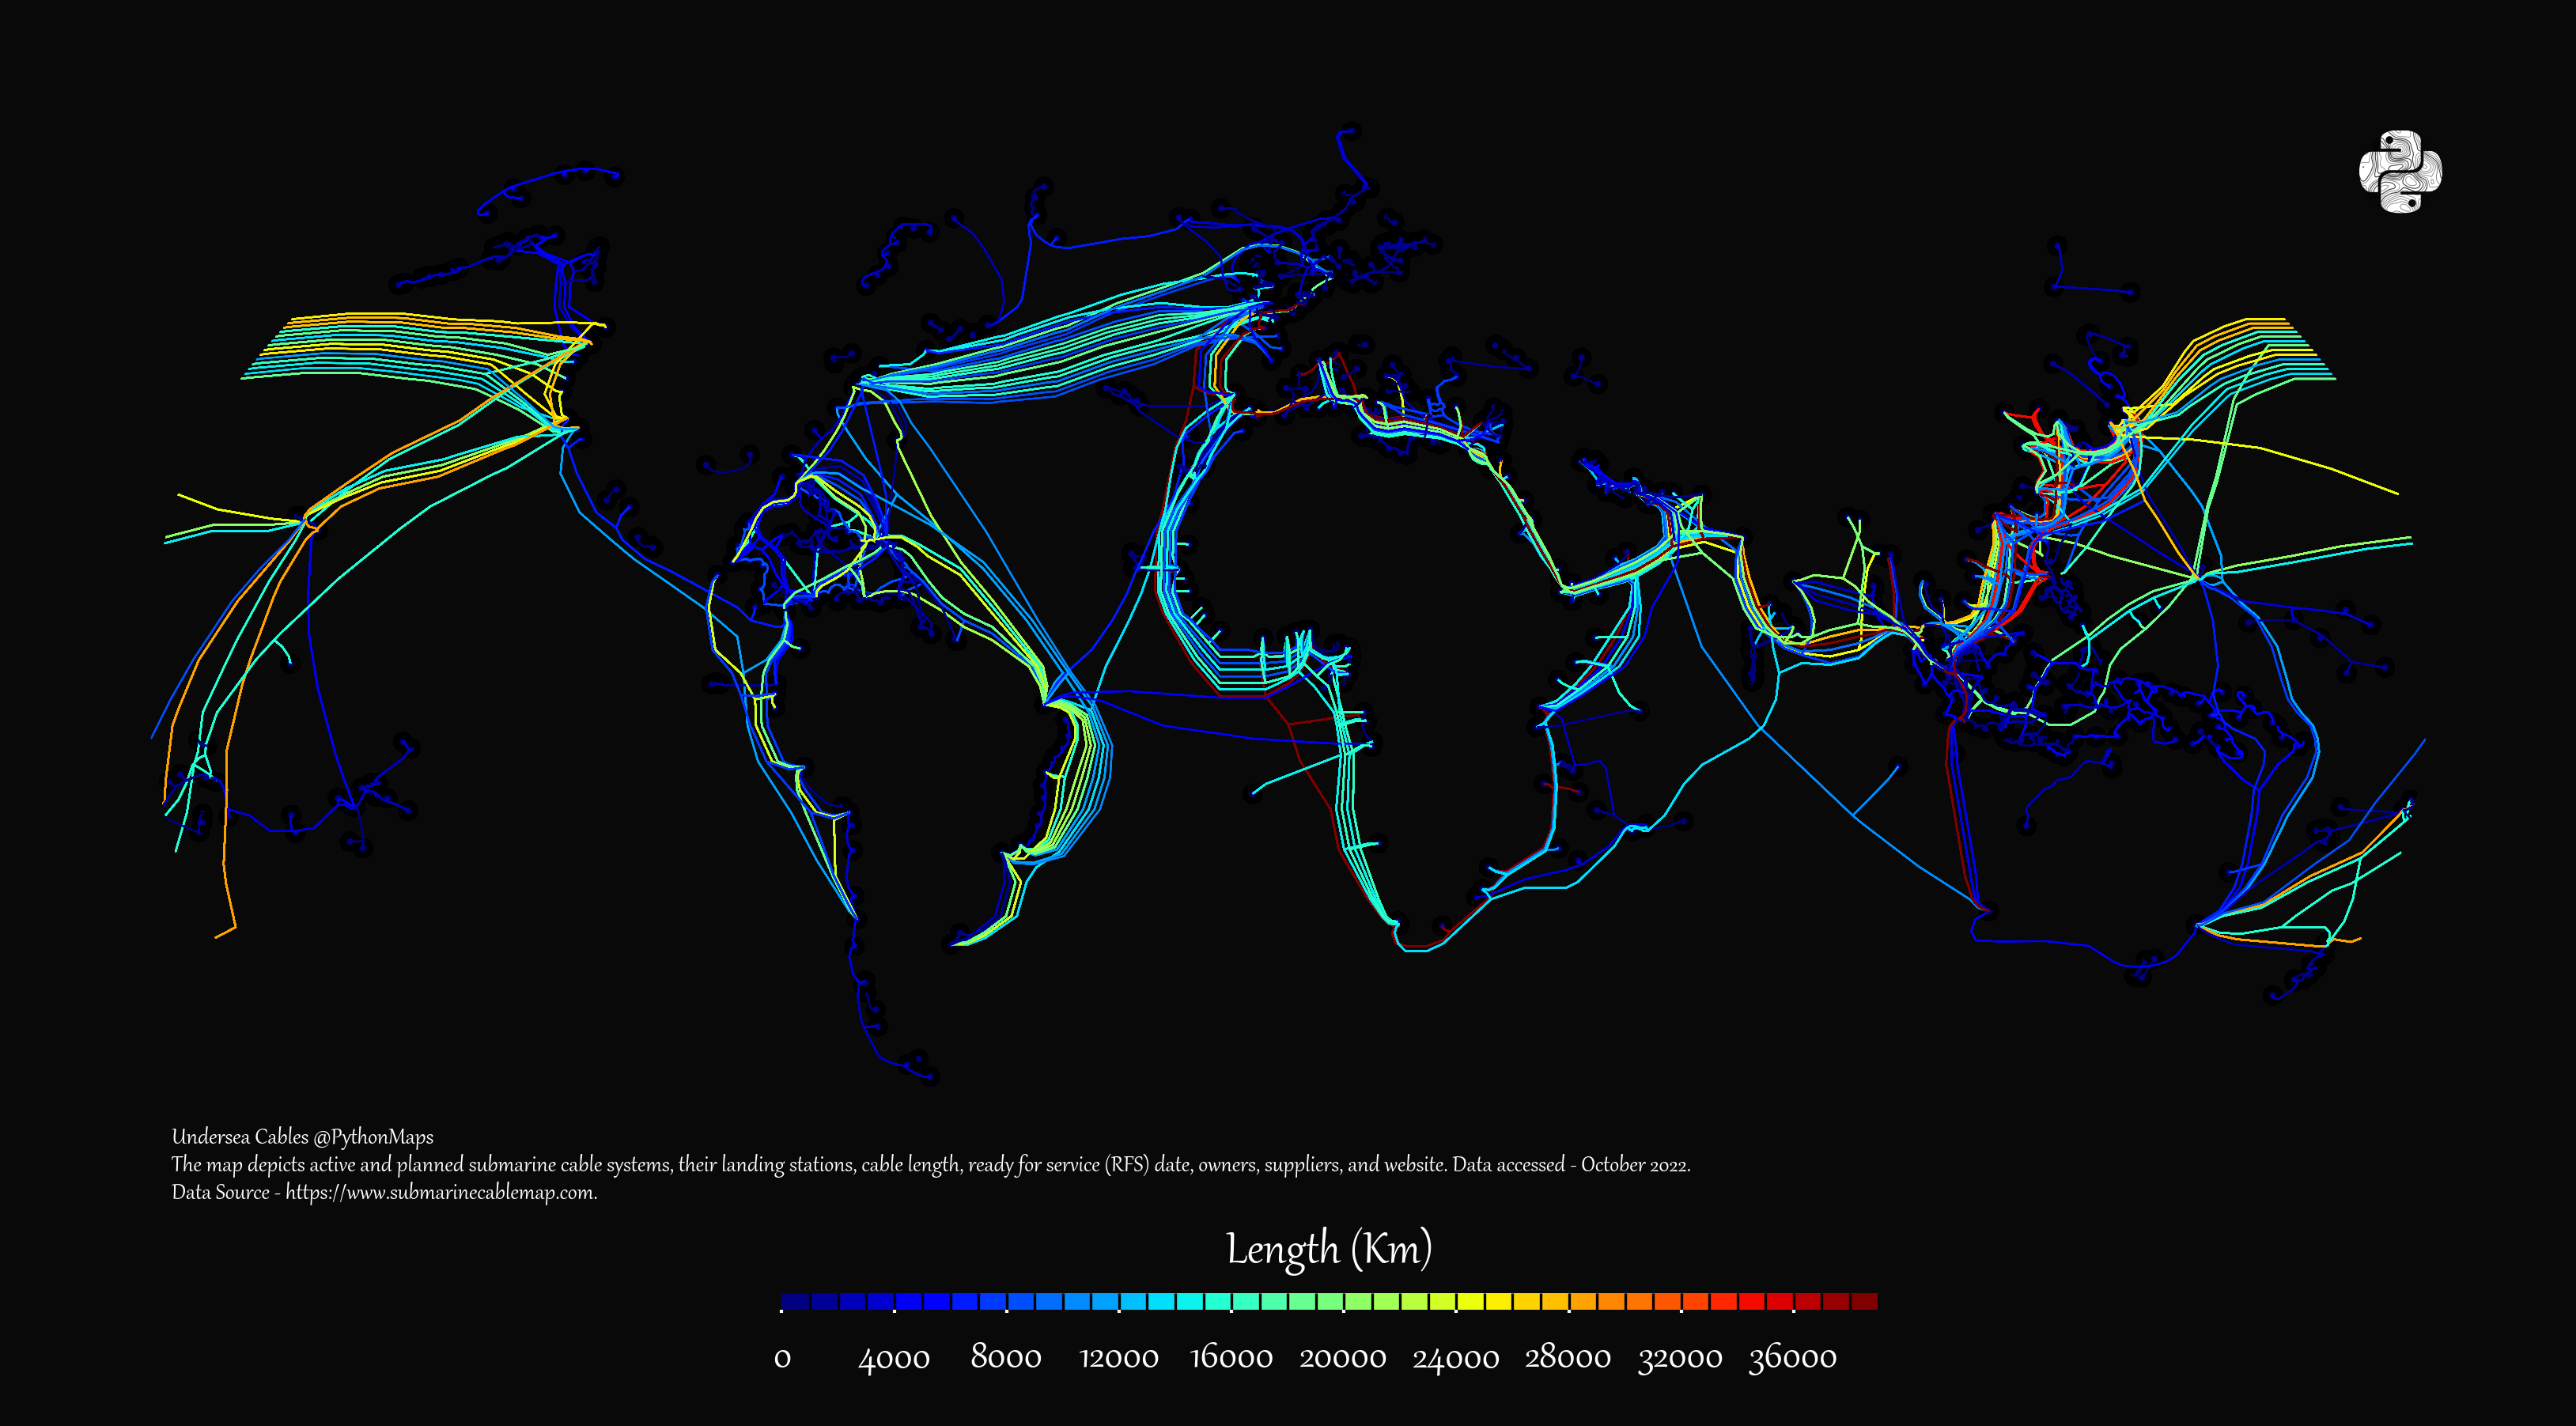
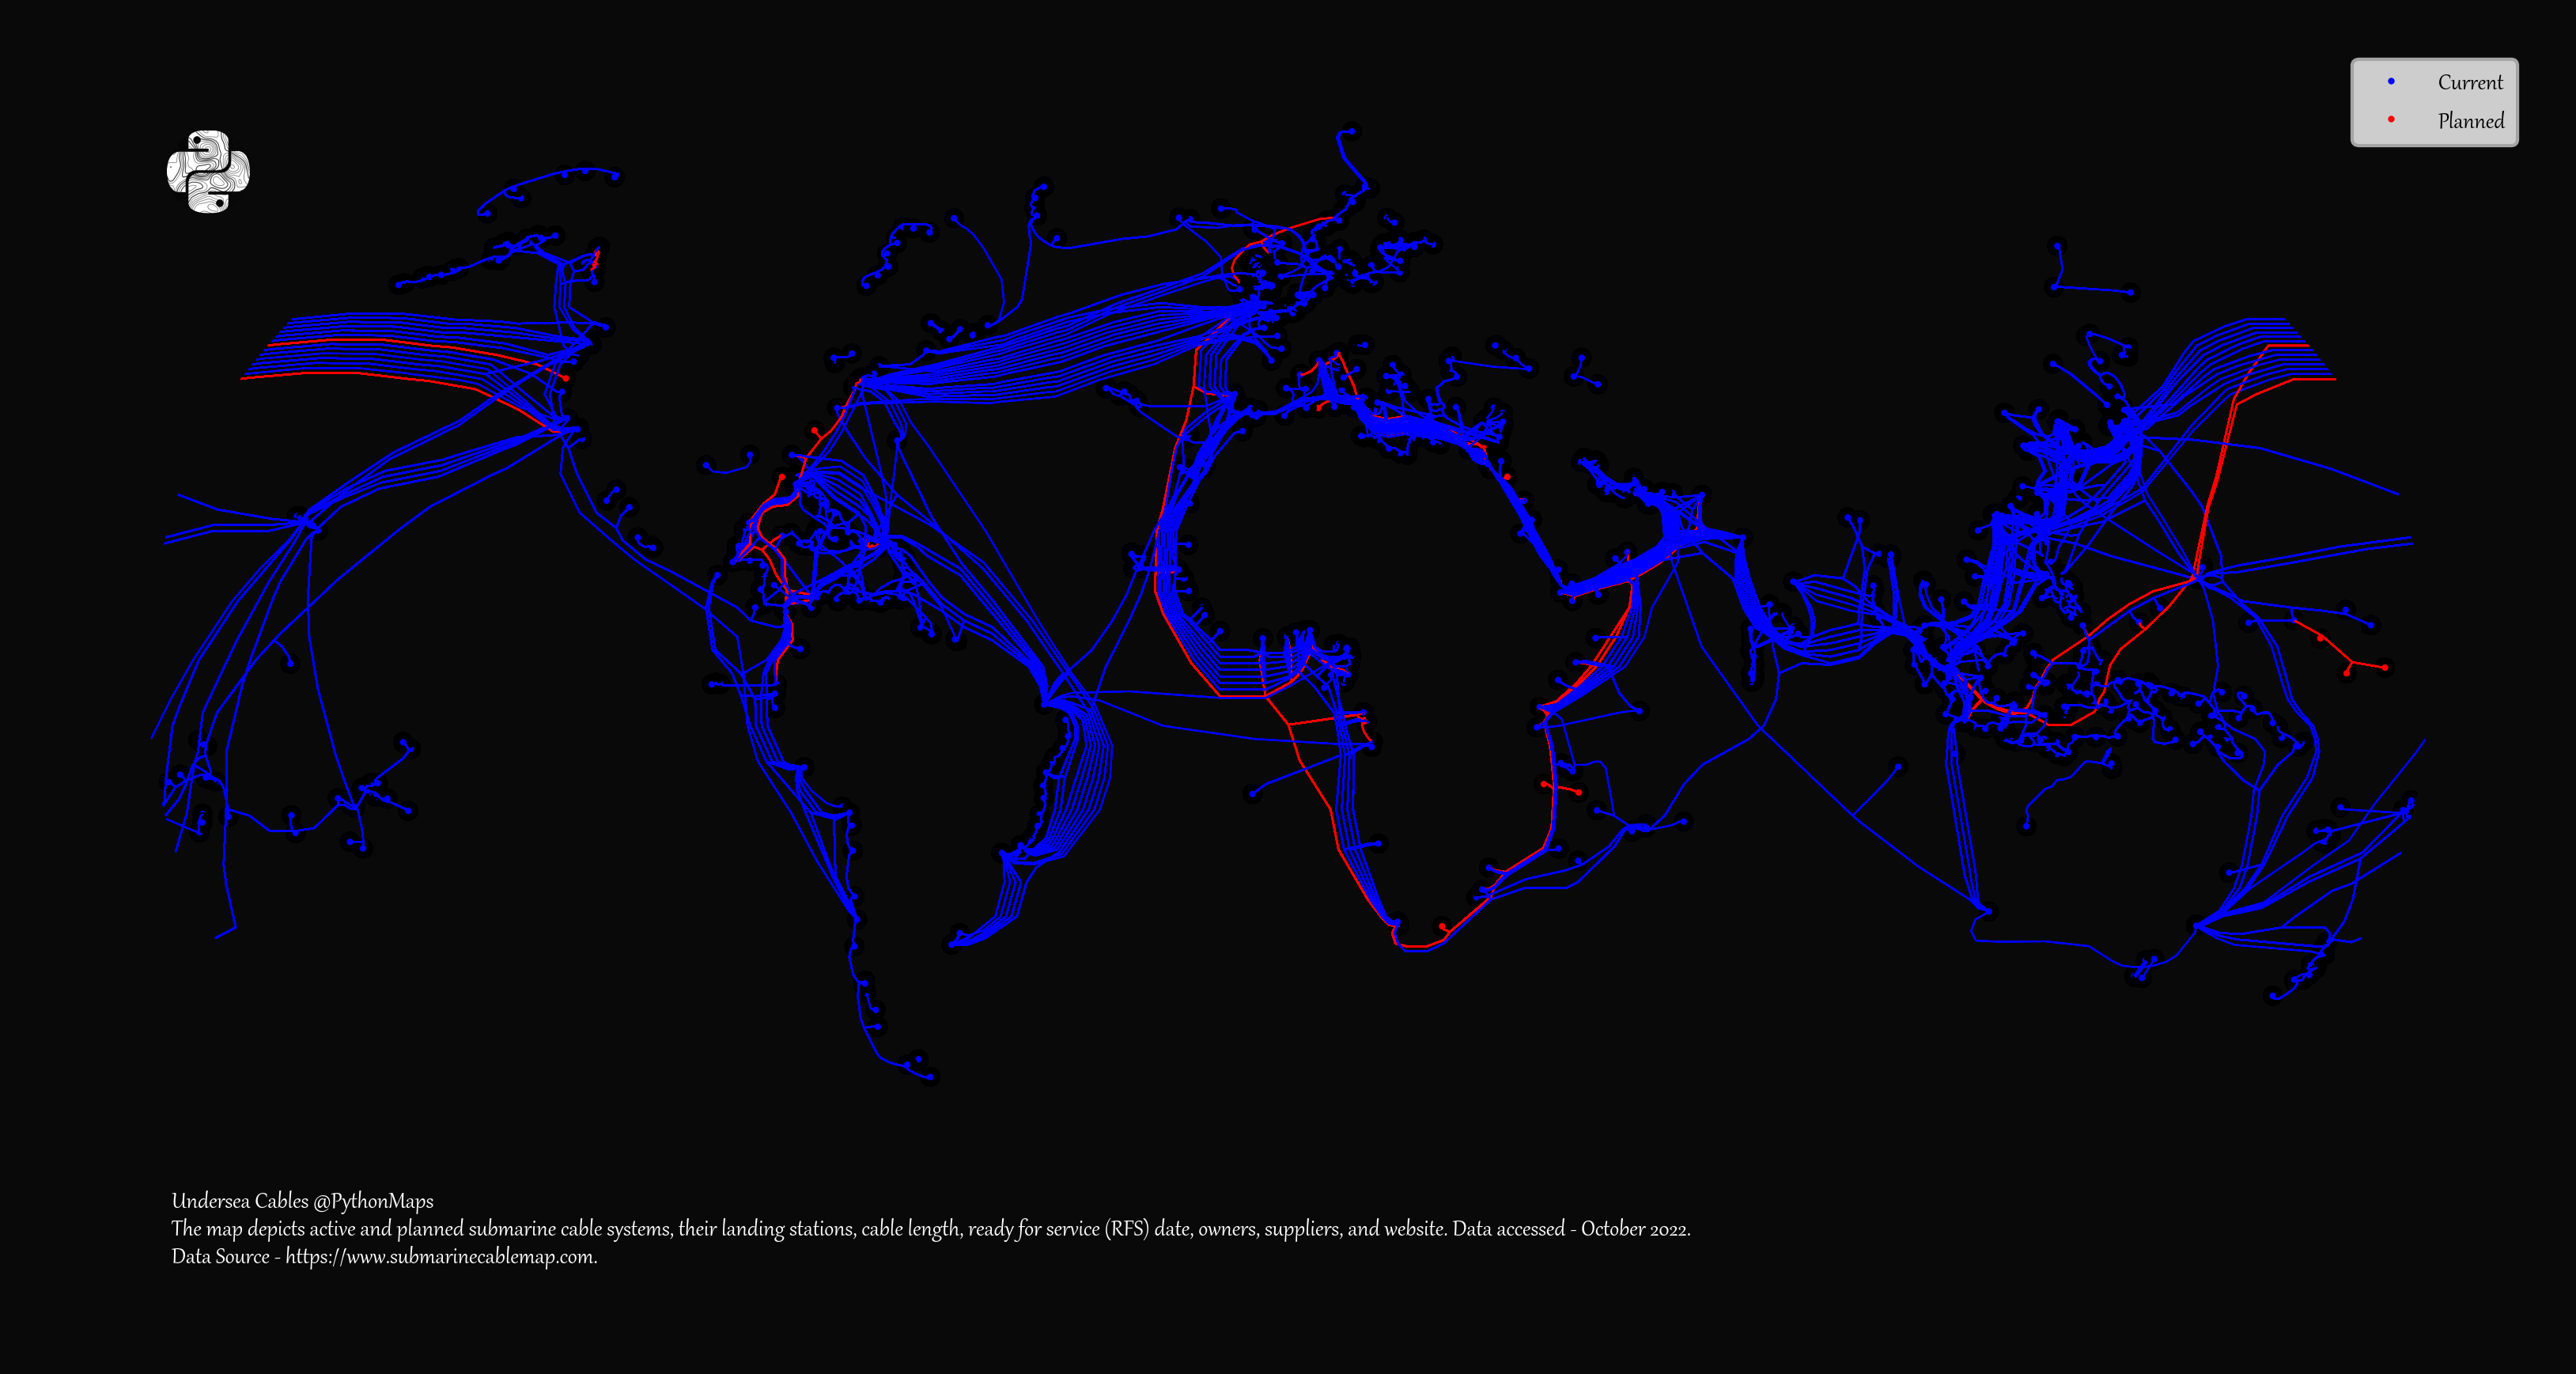
These maps, by Adam Symington, use information from TeleGeography to show the distribution of subsea cables around the planet.
Wired for Connectivity
It’s estimated that there are nearly 1.4 million kilometers (0.9 million miles) of submarine cables in service globally. They ensure emails, content, and calls find their way, linking colossal data centers and facilitating worldwide communication.
Currently, there are 552 active and planned submarine cables:
Submarine cables harness fiber-optic technology, transmitting information via rapid light pulses through glass fibers. These fibers, thinner than human hair, are protected by plastic or even steel wire layers.
Cables usually have the diameter of a garden hose, but often with added armor near the shore. Coastal cables are buried under the seabed, hidden from view on the beach, while deep-sea ones rest on the ocean floor.
Length varies widely, from the 131-kilometer CeltixConnect cable, connecting Dublin, Ireland, and Holyhead, UK, to the sprawling 20,000-kilometer Asia America Gateway cable, connecting San Luis Obispo, California, to Hawaii and Southeast Asia:
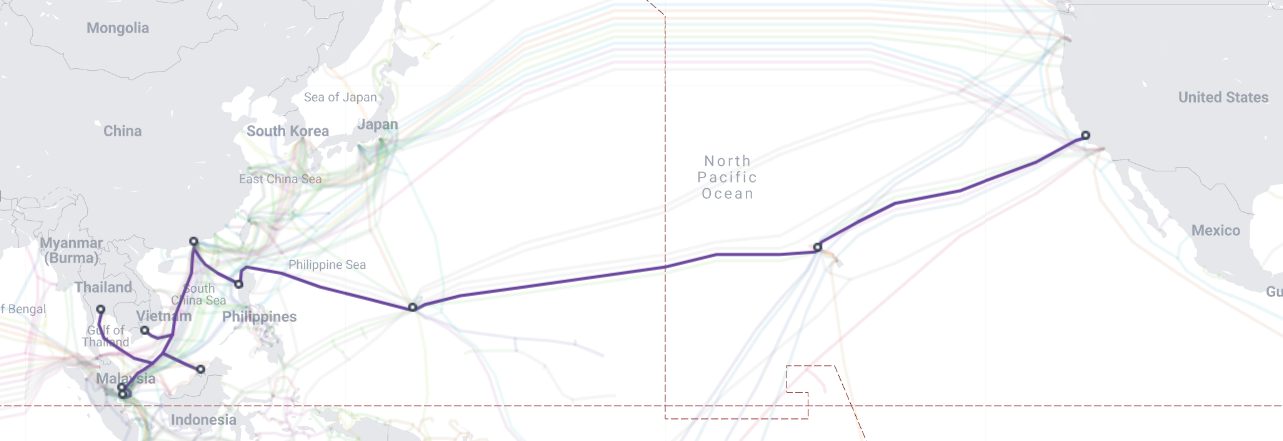
Asia America Gateway. Image: TeleGeography
With the current technology, cables are designed to last 25 years at least but are often replaced because of damage. Nearly two-thirds of cable damage is caused by fishing vessels and ships dragging anchors.
The Bottom Line
Traditionally dominated by telecom carriers, the makeup of the subsea cable market has shifted over more recent decades. Tech giants like Google, Facebook, Microsoft, and Amazon now heavily invest in new cables.
With data demand surging, at least $10 billion is expected to be invested in subsea cables worldwide between 2022 and 2024, driven by cloud service providers and content streaming platforms.
Even with the growth of satellites in telecom, cables still can carry far more data at a much lower cost than satellites. In fact, according to TeleGeography, satellites account for less than 1% of all U.S. international capacity.

This article was published as a part of Visual Capitalist's Creator Program, which features data-driven visuals from some of our favorite Creators around the world.


Technology
All of the Grants Given by the U.S. CHIPS Act
Intel, TSMC, and more have received billions in subsidies from the U.S. CHIPS Act in 2024.


All of the Grants Given by the U.S. CHIPS Act
This was originally posted on our Voronoi app. Download the app for free on iOS or Android and discover incredible data-driven charts from a variety of trusted sources.
This visualization shows which companies are receiving grants from the U.S. CHIPS Act, as of April 25, 2024. The CHIPS Act is a federal statute signed into law by President Joe Biden that authorizes $280 billion in new funding to boost domestic research and manufacturing of semiconductors.
The grant amounts visualized in this graphic are intended to accelerate the production of semiconductor fabrication plants (fabs) across the United States.
Data and Company Highlights
The figures we used to create this graphic were collected from a variety of public news sources. The Semiconductor Industry Association (SIA) also maintains a tracker for CHIPS Act recipients, though at the time of writing it does not have the latest details for Micron.
| Company | Federal Grant Amount | Anticipated Investment From Company |
|---|---|---|
| 🇺🇸 Intel | $8,500,000,000 | $100,000,000,000 |
| 🇹🇼 TSMC | $6,600,000,000 | $65,000,000,000 |
| 🇰🇷 Samsung | $6,400,000,000 | $45,000,000,000 |
| 🇺🇸 Micron | $6,100,000,000 | $50,000,000,000 |
| 🇺🇸 GlobalFoundries | $1,500,000,000 | $12,000,000,000 |
| 🇺🇸 Microchip | $162,000,000 | N/A |
| 🇬🇧 BAE Systems | $35,000,000 | N/A |
BAE Systems was not included in the graphic due to size limitations
Intel’s Massive Plans
Intel is receiving the largest share of the pie, with $8.5 billion in grants (plus an additional $11 billion in government loans). This grant accounts for 22% of the CHIPS Act’s total subsidies for chip production.
From Intel’s side, the company is expected to invest $100 billion to construct new fabs in Arizona and Ohio, while modernizing and/or expanding existing fabs in Oregon and New Mexico. Intel could also claim another $25 billion in credits through the U.S. Treasury Department’s Investment Tax Credit.
TSMC Expands its U.S. Presence
TSMC, the world’s largest semiconductor foundry company, is receiving a hefty $6.6 billion to construct a new chip plant with three fabs in Arizona. The Taiwanese chipmaker is expected to invest $65 billion into the project.
The plant’s first fab will be up and running in the first half of 2025, leveraging 4 nm (nanometer) technology. According to TrendForce, the other fabs will produce chips on more advanced 3 nm and 2 nm processes.
The Latest Grant Goes to Micron
Micron, the only U.S.-based manufacturer of memory chips, is set to receive $6.1 billion in grants to support its plans of investing $50 billion through 2030. This investment will be used to construct new fabs in Idaho and New York.

-

 Science1 week ago
Visualizing the Average Lifespans of Mammals
-

 Demographics2 weeks ago
The Smallest Gender Wage Gaps in OECD Countries
-

 United States2 weeks ago
Where U.S. Inflation Hit the Hardest in March 2024
-

 Green2 weeks ago
Top Countries By Forest Growth Since 2001
-

 United States2 weeks ago
Ranked: The Largest U.S. Corporations by Number of Employees
-

 Maps2 weeks ago
The Largest Earthquakes in the New York Area (1970-2024)
-

 Green2 weeks ago
Ranked: The Countries With the Most Air Pollution in 2023
-

 Green2 weeks ago
Ranking the Top 15 Countries by Carbon Tax Revenue