Economy
The Top 10 Biggest Companies in India
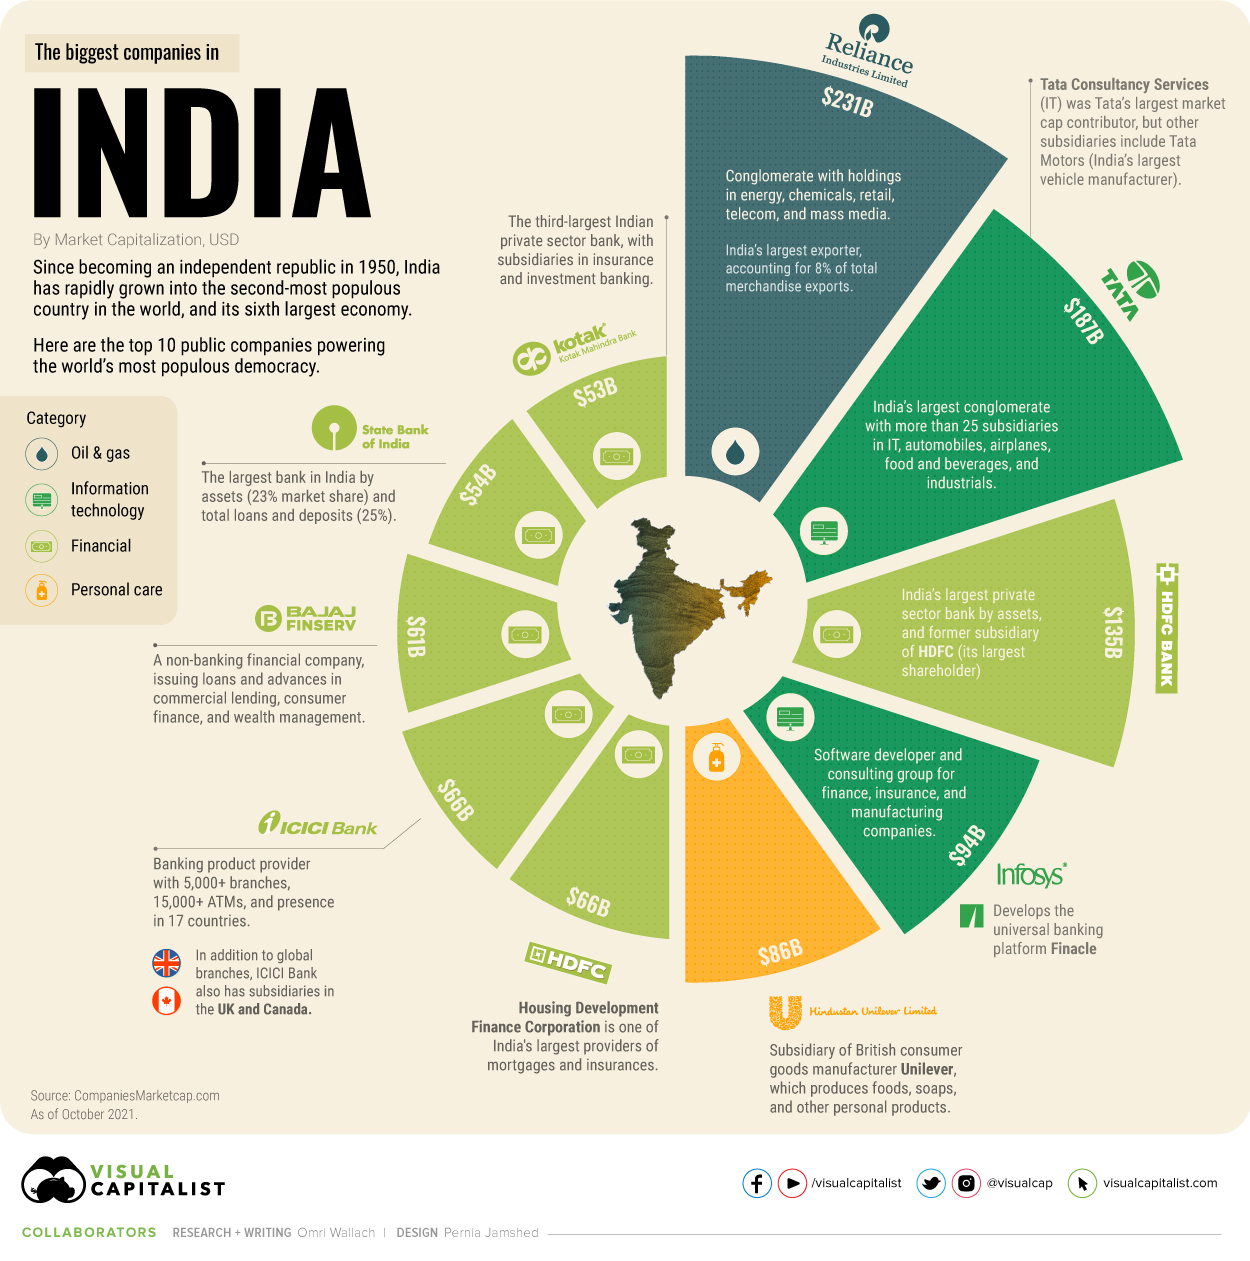
The Top 10 Biggest Companies in India
When India hosted the 13th BRICS summit in September 2021, it was the sixth-largest economy in the world with a GDP of $3.05 trillion.
That’s more than double the GDP it had when the country first joined the group of emerging economies in 2009 (alongside Brazil, Russia, China and later South Africa), at $1.3 trillion.
What are the major industries and companies driving this growth in GDP, and rising alongside it? This time we’re highlighting the top 10 biggest companies in India, the world’s most populous democracy.
What Are the Biggest Public Companies in India?
India’s growth to one of the world’s most powerful economies came extremely quickly, considering it only became a federal republic in 1950.
In 1951, the country was considered relatively impoverished compared to the Western world, with 361 million people, a per-capita income of just $64, and a literacy rate of 17%. By 2021, the population had surged to 1.2 billion, income rose to $1,498, and literacy climbed to 74%.
And most of that growth was fueled internally, as the Indian government was largely protectionist until the 1990s. Today, its free market policies and wide cultural reach help bolster the country’s massive industrial, agricultural, and telecommunications industries.
Here are India’s biggest public companies by market capitalization in October 2021:
| Top 10 Indian Companies | Category | Market Cap (USD) |
|---|---|---|
| Reliance Industries | Oil and Gas | $230.7B |
| Tata Group | Information Technology | $186.7B |
| HDFC Bank | Financial | $135.1B |
| Infosys | Information Technology | $94.4B |
| Hindustan Unilever | Personal Care | $85.6B |
| Housing Development Finance Corporation (HDFC) | Financial | $66.0B |
| ICICI Bank | Financial | $65.7B |
| Bajaj Finance | Financial | $61.7B |
| State Bank of India | Financial | $54.3B |
| Kotak Mahindra Bank | Financial | $53.3B |
Topping the charts are two massive conglomerates, Reliance Industries with a market cap of $231 billion and Tata Group with a market cap of $187 billion.
Reliance started in textile production before a string of oil discoveries and purchases saw it overtake state-owned oil enterprises in revenue. Now the conglomerate also has holdings in petrochemicals, retail, telecom, and mass media, making chairman and largest shareholder Mukesh Ambani the richest person in Asia with a net worth of $100 billion.
But India’s largest conglomerate is Tata Group, with more than 25 subsidiaries in IT (its largest income source), airplanes, food and beverages, and industrials. Tata Motors is India’s largest vehicle manufacturer, and the owner of South Korea’s Daewoo and the UK’s Jaguar Land Rover.
India’s Top 10 Biggest Companies Mainly in Financials
Outside of major conglomerates and a well-known subsidiary, India’s top 10 biggest companies are concentrated in the financial sector.
One of those is HDFC Bank with a market cap of $135.1 billion. An offshoot of the #6 ranked company Housing Development Finance Corporation, HDFC Bank is India’s largest private sector bank by assets.
In total, financials make up six of India’s 10 biggest companies. In addition to HDFC, they include banking provider ICICI Bank (which also has subsidiaries in the UK and Canada), commercial lending company Bajaj Finance, and banks Kotak Mahindra Bank and State Bank of India (the country’s first national bank and its largest).
But there were two non-financial companies bigger than most of India’s banks; Financial software developer and consultant Infosys and personal products company Hindustan Unilever, a subsidiary of British consumer goods giant Unilever.
India is also an agricultural powerhouse—the world’s largest producer of milk and second largest of tea—but most of it is consumed internally by its sizable population. Agriculture accounts for 18.1% of the country’s GDP, behind services at 55.6% and the industrial sector at 26.3%.
With more rapid economic growth on the horizon, India’s biggest companies list might shift over time. What other companies or industries do you associate with India?


Copper
Brass Rods: The Secure Choice
This graphic shows why brass rods are the secure choice for precision-machined and forged parts.


Brass Rods: The Secure Choice
The unique combination of machinability and recyclability makes brass rods the secure choice for manufacturers seeking future-proof raw material solutions.
This infographic, from the Copper Development Association, shows three ways brass rods give manufacturers greater control and a license to grow in the competitive market for precision-machined and forged products.
Future-Proof Investments in New Machine Tools
A material’s machinability directly impacts machine throughput, which typically has the largest impact on machine shop profitability.
The high-speed machining capabilities of brass rods maximize machine tool performance, allowing manufacturers to run the material faster and longer without sacrificing tool life, chip formation, or surface quality.
The high machining efficiency of brass leads to reduced per-part costs, quicker return on investment (ROI) for new machine tools, and expanded production capacity for new projects.
Supply Security Through Closed Loop Recycling
Brass, like its parent element copper, can be infinitely recycled.
In 2022, brass- and wire-rod mills accounted for the majority of the 830,000 tonnes of copper recycled from scrap in the United States.
Given that scrap ratios for machined parts typically range from 60-70% by weight, producing mills benefit from a secure and steady supply of clean scrap returned directly from customers, which is recycled to create new brass rods.
The high residual value of brass scrap creates a strong recycling incentive. Scrap buy back programs give manufacturers greater control over raw material net costs as scrap value is often factored into supplier purchase agreements.
Next Generation Alloys for a Lead-Free Future
Increasingly stringent global regulations continue to pressure manufacturers to minimize the use of materials containing trace amounts of lead and other harmful impurities.
The latest generation of brass-rod alloys is engineered to meet the most demanding criteria for lead leaching in drinking water and other sensitive applications.
Seven brass-rod alloys passed rigorous testing to become the only ‘Acceptable Materials’ against lower lead leaching criteria recently adopted in the national U.S. drinking water quality standard, NSF 61.
Learn more about the advantages of brass rods solutions.

-

 Base Metals1 year ago
Ranked: The World’s Largest Copper Producers
Many new technologies critical to the energy transition rely on copper. Here are the world’s largest copper producers.
-

 Silver2 years ago
Mapped: Solar Power by Country in 2021
In 2020, solar power saw its largest-ever annual capacity expansion at 127 gigawatts. Here’s a snapshot of solar power capacity by country.
-

 Batteries5 years ago
Visualizing Copper’s Role in the Transition to Clean Energy
A clean energy transition is underway as wind, solar, and batteries take center stage. Here’s how copper plays the critical role in these technologies.
-

 Science5 years ago
Everything You Need to Know on VMS Deposits
Deep below the ocean’s waves, VMS deposits spew out massive amounts of minerals like copper, zinc, and gold, making them a key source of the metals…
-
 Copper5 years ago
How Much Copper is in an Electric Vehicle?
Have you ever wondered how much copper is in an electric vehicle? This infographic shows the metal’s properties as well as the quantity of copper used.
-
 Copper6 years ago
Copper: Driving the Green Energy Revolution
Renewable energy is set to fuel a new era of copper demand – here’s how much copper is used in green applications from EVs to photovoltaics.


-

 Green2 weeks ago
Ranked: Top Countries by Total Forest Loss Since 2001
-

 Travel1 week ago
Ranked: The World’s Top Flight Routes, by Revenue
-

 Technology1 week ago
Ranked: Semiconductor Companies by Industry Revenue Share
-

 Money2 weeks ago
Which States Have the Highest Minimum Wage in America?
-

 Real Estate2 weeks ago
Ranked: The Most Valuable Housing Markets in America
-

 Markets2 weeks ago
Charted: Big Four Market Share by S&P 500 Audits
-

 AI2 weeks ago
The Stock Performance of U.S. Chipmakers So Far in 2024
-

 Automotive2 weeks ago
Almost Every EV Stock is Down After Q1 2024