Markets
Ranked: The World’s 50 Top Countries by GDP, by Sector Breakdown
Article/Editing:
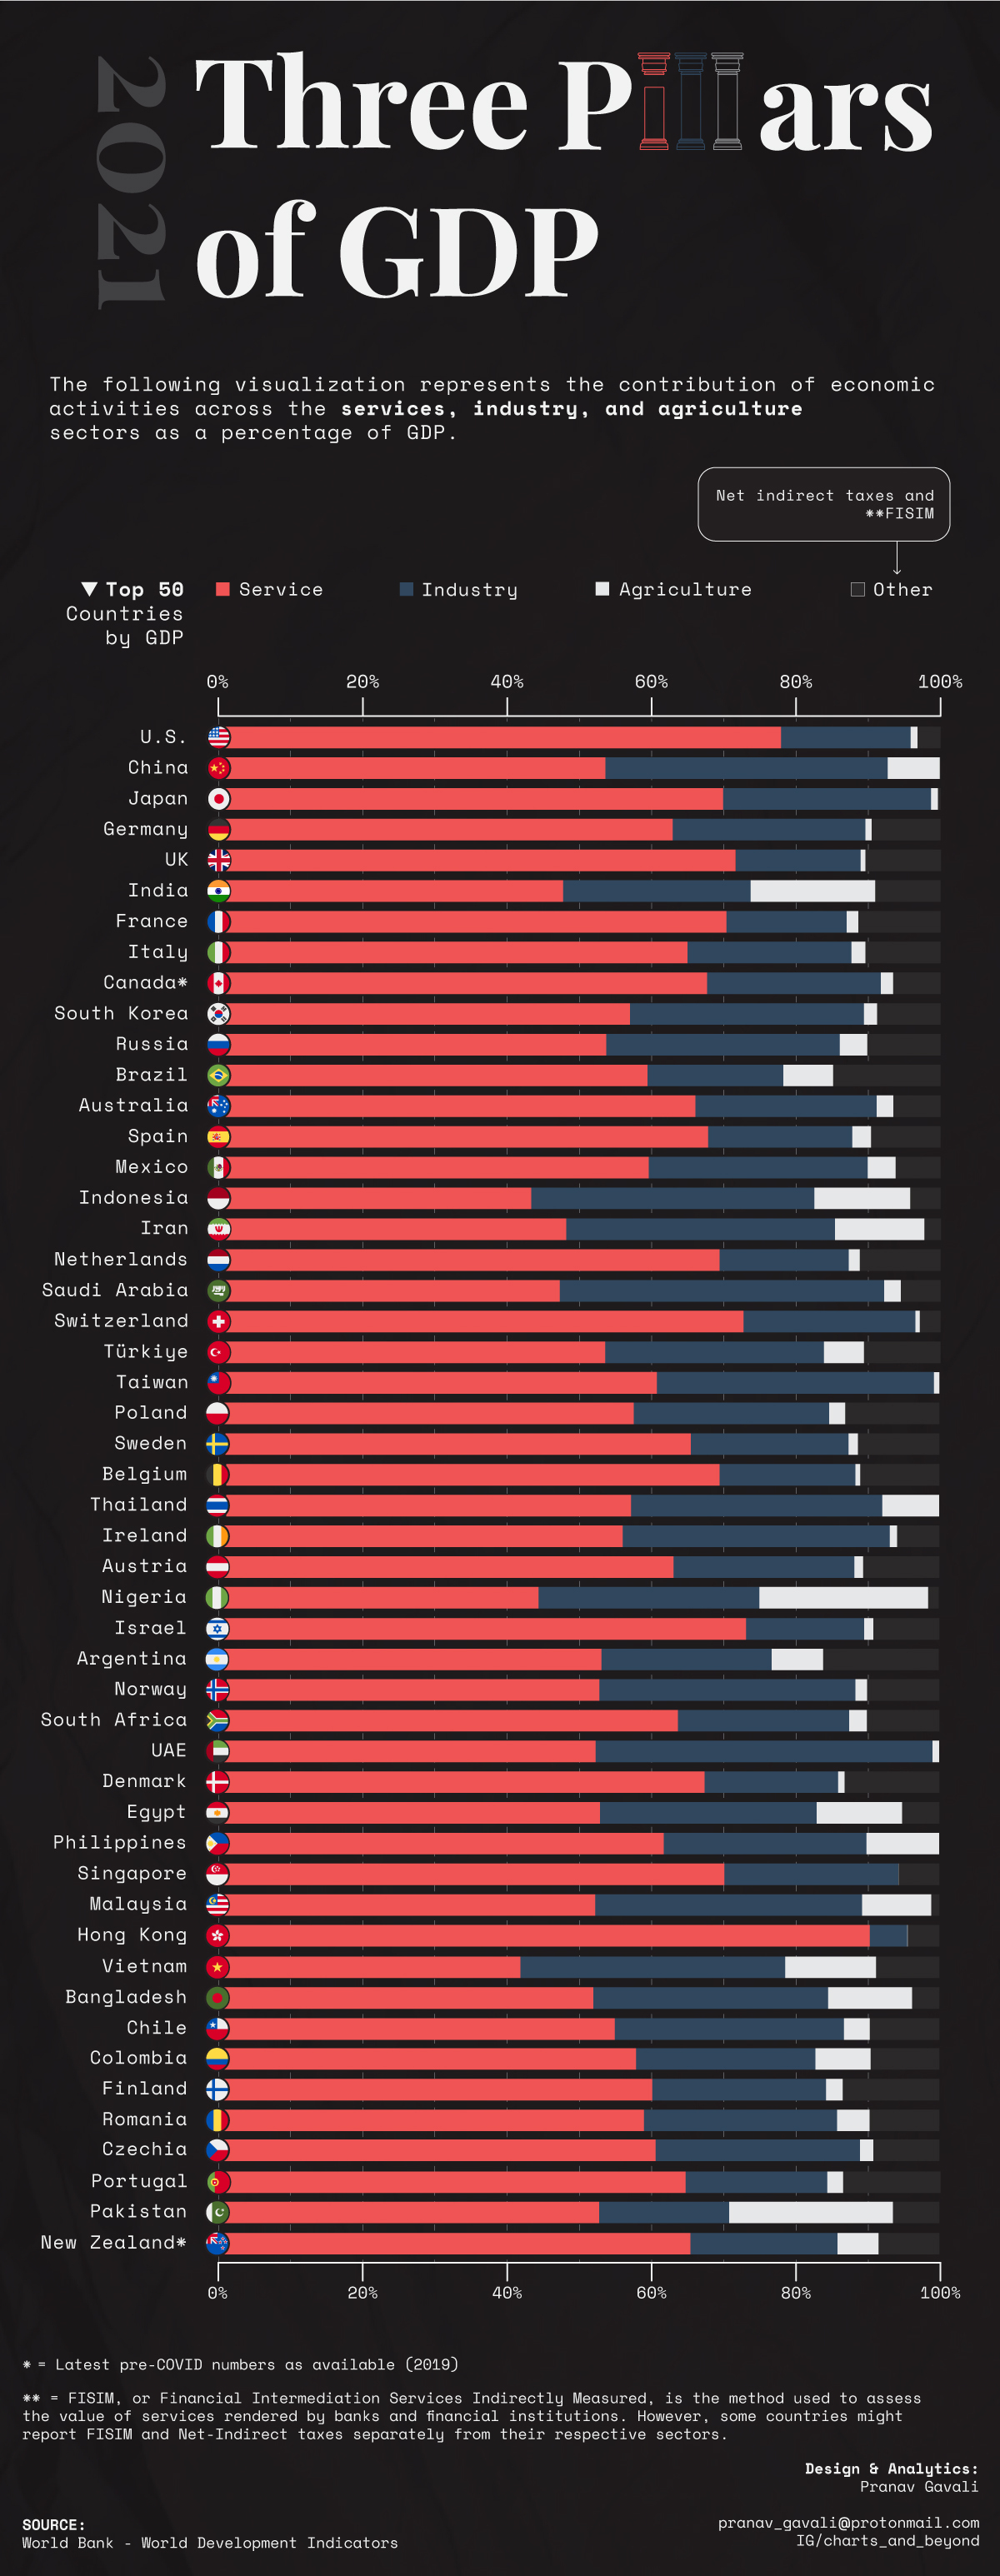
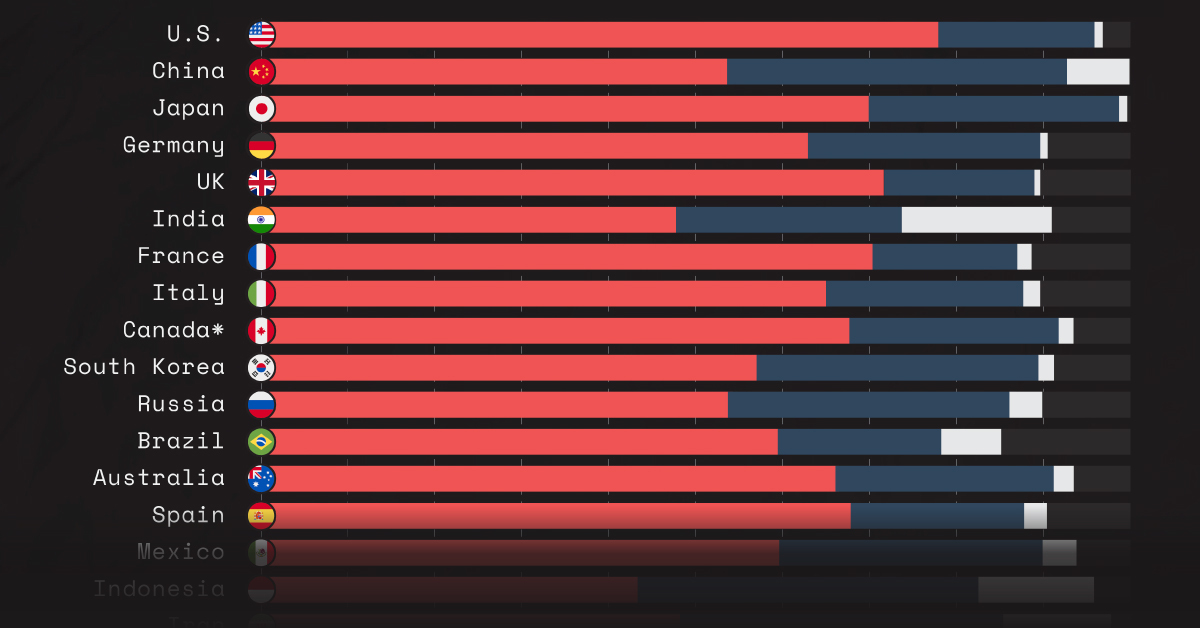
Visualized: The Three Pillars of GDP, by Country
Over the last several decades, the service sector has fueled the economic activity of the world’s largest countries. Driving this trend has been changes in consumption, the easing of trade barriers, and rapid advancements in tech.
We can see this in the gross domestic product (GDP) breakdown of each country, which gets divided into three broad sectors: services, industry, and agriculture.
The above graphic from Pranav Gavali shows GDP by country, and how each sector contributes to an economy’s output, with data from the World Bank.
Drivers of GDP, by Country
As the most important and fastest growing component of GDP, services make up almost 60% of GDP in the world’s 50 largest countries. Following this is the industrial sector which includes the production of raw goods.
Below, we show how each sector contributes to GDP by country as of 2021:
| Country | Services (% GDP) | Industry (% GDP) | Agriculture (% GDP) | Other (% GDP) | GDP (T) |
|---|---|---|---|---|---|
| 🇺🇸 U.S. | 77.6 | 17.9 | 1.0 | 3.6 | $22.9 |
| 🇨🇳 China | 53.5 | 39.3 | 7.2 | 0.0 | $16.9 |
| 🇯🇵 Japan | 69.9 | 28.8 | 1.0 | 0.4 | $5.1 |
| 🇩🇪 Germany | 62.9 | 26.7 | 0.9 | 9.5 | $4.2 |
| 🇬🇧 UK | 71.6 | 17.3 | 0.7 | 10.4 | $3.1 |
| 🇫🇷 France | 70.3 | 16.7 | 1.6 | 11.4 | $2.9 |
| 🇮🇳 India | 47.9 | 26.1 | 17.3 | 8.7 | $2.9 |
| 🇮🇹 Italy | 65.0 | 22.7 | 1.9 | 10.4 | $2.1 |
| 🇨🇦 Canada* | 67.7 | 24.1 | 1.7 | 6.6 | $2.0 |
| 🇰🇷 South Korea | 57.0 | 32.4 | 1.8 | 8.8 | $1.8 |
| 🇧🇷 Brazil | 57.8 | 20.2 | 7.5 | 14.6 | $1.6 |
| 🇦🇺 Australia | 65.7 | 25.5 | 2.3 | 6.5 | $1.6 |
| 🇷🇺 Russia | 54.1 | 31.8 | 3.9 | 10.3 | $1.6 |
| 🇪🇸 Spain | 67.4 | 20.4 | 2.6 | 9.6 | $1.4 |
| 🇲🇽 Mexico | 59.2 | 30.8 | 3.9 | 6.1 | $1.3 |
| 🇮🇩 Indonesia | 42.8 | 39.8 | 13.3 | 4.1 | $1.2 |
| 🇮🇷 Iran | 47.3 | 38.0 | 12.4 | 2.3 | $1.1 |
| 🇳🇱 Netherlands | 69.4 | 17.9 | 1.5 | 11.2 | $1.0 |
| 🇨🇭 Switzerland | 71.9 | 24.6 | 0.6 | 2.8 | $0.8 |
| 🇹🇷 Turkiye | 52.8 | 31.1 | 5.5 | 10.6 | $0.8 |
| 🇹🇼 Taiwan | 60.6 | 38.0 | 1.5 | 0.0 | $0.8 |
| 🇸🇦 Saudi Arabia | 46.5 | 44.7 | 2.7 | 6.1 | $0.8 |
| 🇵🇱 Poland | 56.9 | 27.9 | 2.2 | 13.0 | $0.7 |
| 🇧🇪 Belgium | 68.8 | 19.6 | 0.7 | 10.9 | $0.6 |
| 🇸🇪 Sweden | 65.0 | 22.5 | 1.3 | 11.3 | $0.6 |
| 🇮🇱 Israel | 72.4 | 17.2 | 1.3 | 9.1 | $0.5 |
| 🇦🇷 Argentina | 52.5 | 23.6 | 7.1 | 16.8 | $0.5 |
| 🇦🇹 Austria | 62.4 | 25.8 | 1.2 | 10.5 | $0.5 |
| 🇳🇬 Nigeria | 43.8 | 31.4 | 23.4 | 1.4 | $0.5 |
| 🇹🇭 Thailand | 56.3 | 35.0 | 8.7 | 0.0 | $0.5 |
| 🇮🇪 Ireland | 55.4 | 37.8 | 1.0 | 5.8 | $0.5 |
| 🇭🇰 Hong Kong | 89.7 | 6.0 | 0.1 | 4.3 | $0.4 |
| 🇩🇰 Denmark | 66.7 | 19.3 | 0.9 | 13.1 | $0.4 |
| 🇸🇬 Singapore | 70.3 | 24.4 | 0.0 | 5.3 | $0.4 |
| 🇿🇦 South Africa | 63.0 | 24.5 | 2.5 | 10.0 | $0.4 |
| 🇵🇭 Philippines | 61.0 | 28.9 | 10.1 | 0.0 | $0.4 |
| 🇪🇬 Egypt | 52.5 | 31.2 | 11.4 | 4.9 | $0.4 |
| 🇧🇩 Bangladesh | 51.3 | 33.3 | 11.6 | 3.7 | $0.4 |
| 🇳🇴 Norway | 51.8 | 36.3 | 1.7 | 10.2 | $0.4 |
| 🇻🇳 Vietnam | 41.2 | 37.5 | 12.6 | 8.8 | $0.4 |
| 🇲🇾 Malaysia | 51.6 | 37.8 | 9.6 | 1.1 | $0.4 |
| 🇦🇪 U.A.E. | 51.6 | 47.5 | 0.9 | 0.0 | $0.4 |
| 🇵🇰 Pakistan | 52.1 | 18.8 | 22.7 | 6.4 | $0.3 |
| 🇵🇹 Portugal | 64.7 | 19.6 | 2.2 | 13.5 | $0.3 |
| 🇫🇮 Finland | 60.3 | 24.1 | 2.3 | 13.4 | $0.3 |
| 🇨🇴 Colombia | 58.0 | 24.9 | 7.6 | 9.5 | $0.3 |
| 🇷🇴 Romania | 59.1 | 26.7 | 4.5 | 9.6 | $0.3 |
| 🇨🇿 Czechia | 58.8 | 30.3 | 1.8 | 9.1 | $0.3 |
| 🇨🇱 Chile | 54.4 | 31.3 | 3.6 | 10.6 | $0.3 |
| 🇳🇿 New Zealand* | 65.6 | 20.4 | 5.7 | 8.4 | $0.2 |
Industrial sector includes construction. Agriculture sector includes forestry and fishing. *Data as of 2019.
In the U.S., services make up nearly 78% of GDP. Apart from Hong Kong, it comprises the highest share of GDP across the world’s largest economies. Roughly 80% of American jobs in the private sector are in services, spanning from healthcare and entertainment to finance and logistics.
Like America, a growing share of China’s GDP is from services, contributing to almost 54% of total economic output, up from 44% in 2010. This can be attributed to rising incomes and higher productivity in the sector as the economy has grown and matured, among other factors.
In a departure from the top 10 biggest countries globally, agriculture continues to drive a large portion of India’s GDP. India is the world’s second largest producer of wheat and rice, with agriculture accounting for 44% of the country’s employment.
While the services sector has grown in India, it makes up a greater share in other emerging economies such as Brazil (58%), Mexico (59%), and the Philippines (61%).
Growth Dynamics
Services-led growth has risen faster than manufacturing across many developing nations, underpinned by productivity growth.
This structural shift is seen across economies. In many countries in Africa, for instance, jobs have increasingly moved from agriculture to services and trade, where it now accounts for 42% of jobs.
These growth patterns are supported by rising incomes in developing economies, while innovation in tech is lowering barriers to enabling service growth. As the industrial sector makes up a lower share of trade and economic activity, the service sector is projected to make up 77% of global GDP by 2035.

This article was published as a part of Visual Capitalist's Creator Program, which features data-driven visuals from some of our favorite Creators around the world.


Economy
Economic Growth Forecasts for G7 and BRICS Countries in 2024
The IMF has released its economic growth forecasts for 2024. How do the G7 and BRICS countries compare?


G7 & BRICS Real GDP Growth Forecasts for 2024
The International Monetary Fund’s (IMF) has released its real gross domestic product (GDP) growth forecasts for 2024, and while global growth is projected to stay steady at 3.2%, various major nations are seeing declining forecasts.
This chart visualizes the 2024 real GDP growth forecasts using data from the IMF’s 2024 World Economic Outlook for G7 and BRICS member nations along with Saudi Arabia, which is still considering an invitation to join the bloc.
Get the Key Insights of the IMF’s World Economic Outlook
Want a visual breakdown of the insights from the IMF’s 2024 World Economic Outlook report?
This visual is part of a special dispatch of the key takeaways exclusively for VC+ members.
Get the full dispatch of charts by signing up to VC+.
Mixed Economic Growth Prospects for Major Nations in 2024
Economic growth projections by the IMF for major nations are mixed, with the majority of G7 and BRICS countries forecasted to have slower growth in 2024 compared to 2023.
Only three BRICS-invited or member countries, Saudi Arabia, the UAE, and South Africa, have higher projected real GDP growth rates in 2024 than last year.
| Group | Country | Real GDP Growth (2023) | Real GDP Growth (2024P) |
|---|---|---|---|
| G7 | 🇺🇸 U.S. | 2.5% | 2.7% |
| G7 | 🇨🇦 Canada | 1.1% | 1.2% |
| G7 | 🇯🇵 Japan | 1.9% | 0.9% |
| G7 | 🇫🇷 France | 0.9% | 0.7% |
| G7 | 🇮🇹 Italy | 0.9% | 0.7% |
| G7 | 🇬🇧 UK | 0.1% | 0.5% |
| G7 | 🇩🇪 Germany | -0.3% | 0.2% |
| BRICS | 🇮🇳 India | 7.8% | 6.8% |
| BRICS | 🇨🇳 China | 5.2% | 4.6% |
| BRICS | 🇦🇪 UAE | 3.4% | 3.5% |
| BRICS | 🇮🇷 Iran | 4.7% | 3.3% |
| BRICS | 🇷🇺 Russia | 3.6% | 3.2% |
| BRICS | 🇪🇬 Egypt | 3.8% | 3.0% |
| BRICS-invited | 🇸🇦 Saudi Arabia | -0.8% | 2.6% |
| BRICS | 🇧🇷 Brazil | 2.9% | 2.2% |
| BRICS | 🇿🇦 South Africa | 0.6% | 0.9% |
| BRICS | 🇪🇹 Ethiopia | 7.2% | 6.2% |
| 🌍 World | 3.2% | 3.2% |
China and India are forecasted to maintain relatively high growth rates in 2024 at 4.6% and 6.8% respectively, but compared to the previous year, China is growing 0.6 percentage points slower while India is an entire percentage point slower.
On the other hand, four G7 nations are set to grow faster than last year, which includes Germany making its comeback from its negative real GDP growth of -0.3% in 2023.
Faster Growth for BRICS than G7 Nations
Despite mostly lower growth forecasts in 2024 compared to 2023, BRICS nations still have a significantly higher average growth forecast at 3.6% compared to the G7 average of 1%.
While the G7 countries’ combined GDP is around $15 trillion greater than the BRICS nations, with continued higher growth rates and the potential to add more members, BRICS looks likely to overtake the G7 in economic size within two decades.
BRICS Expansion Stutters Before October 2024 Summit
BRICS’ recent expansion has stuttered slightly, as Argentina’s newly-elected president Javier Milei declined its invitation and Saudi Arabia clarified that the country is still considering its invitation and has not joined BRICS yet.
Even with these initial growing pains, South Africa’s Foreign Minister Naledi Pandor told reporters in February that 34 different countries have submitted applications to join the growing BRICS bloc.
Any changes to the group are likely to be announced leading up to or at the 2024 BRICS summit which takes place October 22-24 in Kazan, Russia.
Get the Full Analysis of the IMF’s Outlook on VC+
This visual is part of an exclusive special dispatch for VC+ members which breaks down the key takeaways from the IMF’s 2024 World Economic Outlook.
For the full set of charts and analysis, sign up for VC+.

-

 Sports1 week ago
The Highest Earning Athletes in Seven Professional Sports
-

 Countries2 weeks ago
Population Projections: The World’s 6 Largest Countries in 2075
-

 Markets2 weeks ago
The Top 10 States by Real GDP Growth in 2023
-

 Demographics2 weeks ago
The Smallest Gender Wage Gaps in OECD Countries
-

 United States2 weeks ago
Where U.S. Inflation Hit the Hardest in March 2024
-

 Green2 weeks ago
Top Countries By Forest Growth Since 2001
-

 United States2 weeks ago
Ranked: The Largest U.S. Corporations by Number of Employees
-

 Maps2 weeks ago
The Largest Earthquakes in the New York Area (1970-2024)