Mapping the $158 Billion Impact of Online Travel Agencies
Mapping the $158 Billion Impact of Online Travel Agencies
Before the first online travel agency (OTA) came online in 1994, booking a vacation would likely have involved a visit to the local travel agent, where you’d pour over guide books and flight catalogs.
OTAs are web-based marketplaces that connect travelers with vendors, like airlines and hotels. And while we have all benefited from the added convenience they’ve provided, what effect have they had on prices?
In this visualization, for our sponsor Booking.com, we look at the massive impact of online travel agencies in countries around the world.
Adding up the Savings
Can you imagine a world without OTAs?
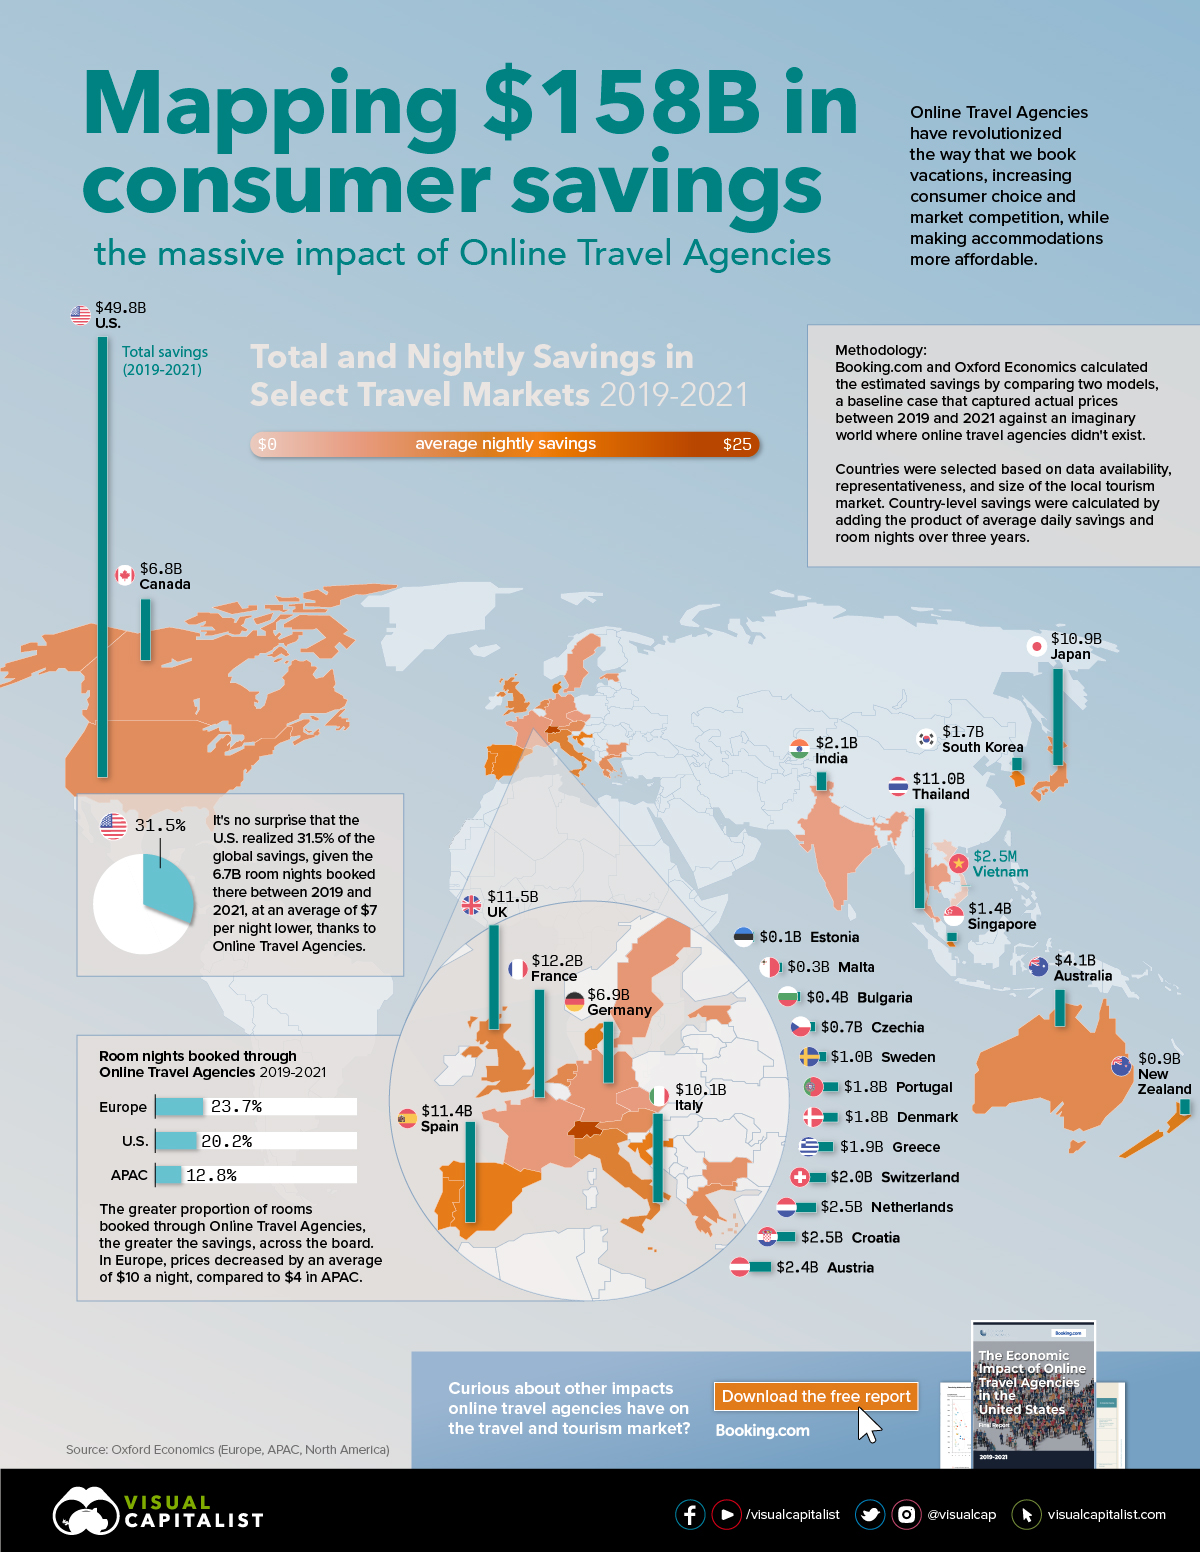
Well, Oxford Economics did just that for Booking.com to quantify the impact of digital platforms on the travel and tourism sector. Researchers compared two models, a baseline case that captured actual prices between 2019 and 2021 and an imaginary world where OTAs didn’t exist. The report selected individual countries based on data availability, representativeness, and overall size of the tourism market.
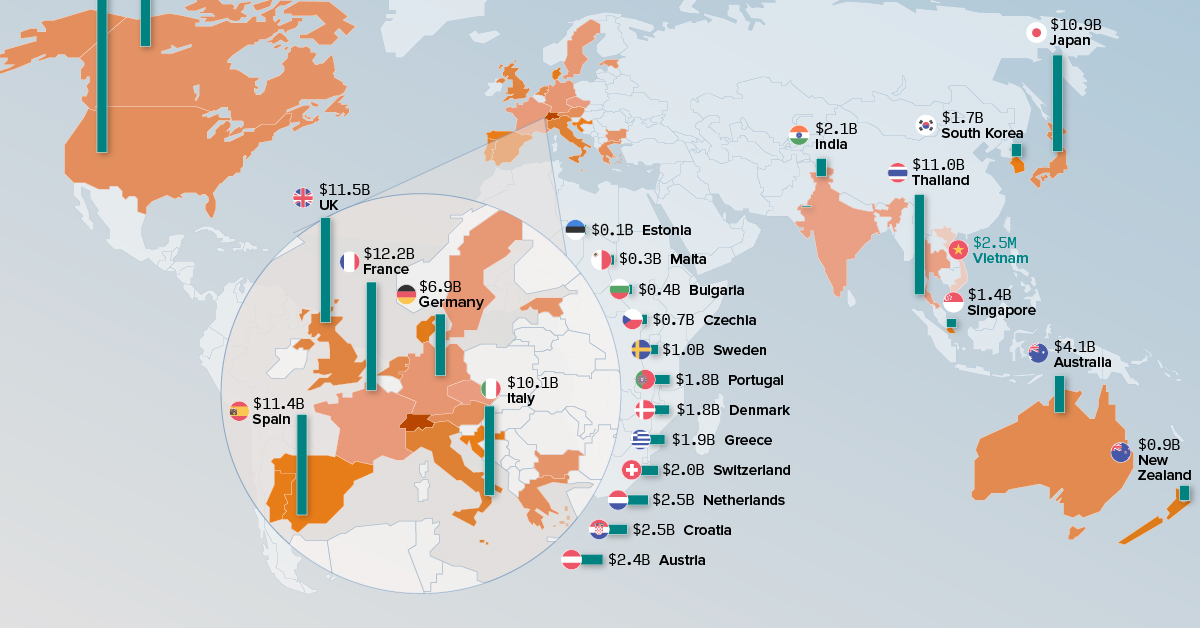
Between 2019 and 2021, consumer savings in the 27 individual countries in Europe, APAC, and North America considered here totaled $158 billion. We calculated total savings by multiplying the number of room nights per country and the savings to the average daily rate, a key industry price metric.
| Country | 2019 (millions) | 2020 (millions) | 2021 (millions) | Total (millions) |
|---|---|---|---|---|
| Australia | $2,520 | $863 | $676 | $4,059 |
| Austria | $1,199 | $638 | $554 | $2,391 |
| Bulgaria | $201 | $77 | $109 | $387 |
| Canada | $3,912 | $1,097 | $1,773 | $6,783 |
| Croatia | $1,181 | $423 | $853 | $2,458 |
| Czechia | $390 | $131 | $144 | $666 |
| Denmark | $906 | $461 | $430 | $1,797 |
| Estonia | $55 | $23 | $28 | $106 |
| France | $6,342 | $2,302 | $3,555 | $12,200 |
| Germany | $3,332 | $1,721 | $1,864 | $6,917 |
| Greece | $995 | $280 | $613 | $1,889 |
| India | $1,179 | $372 | $502 | $2,053 |
| Italy | $4,893 | $1,715 | $3,493 | $10,101 |
| Japan | $6,868 | $2,174 | $1,882 | $10,925 |
| Malta | $224 | $40 | $75 | $338 |
| Netherlands | $1,400 | $513 | $582 | $2,495 |
| New Zealand | $498 | $234 | $218 | $950 |
| Portugal | $862 | $342 | $582 | $1,786 |
| Singapore | $1,254 | $122 | $49 | $1,425 |
| South Korea | $898 | $351 | $446 | $1,694 |
| Spain | $6,315 | $1,652 | $3,397 | $11,364 |
| Sweden | $467 | $215 | $327 | $1,010 |
| Switzerland | $845 | $511 | $643 | $2,000 |
| Thailand | $6,764 | $2,501 | $1,746 | $11,011 |
| U.S. | $21,008 | $10,728 | $18,072 | $49,808 |
| UK | $6,769 | $1,909 | $2,822 | $11,500 |
| Vietnam | $2 | $1 | $0 | $3 |
| Totals | $81,282 | $31,396 | $45,437 | $158,114 |
Given the sheer size of the U.S. market, travelers there reaped the most savings from OTAs, $49.8 billion between 2019 and 2021. However, if you were to count the 17 European countries together as one bloc, their three-year total comes out ahead at $69.4 billion.
The top 10 contains recognizable travel destinations across Western Europe in addition to the U.S. and Canada. Two Asia Pacific countries also made the cut: Thailand with its stunning beaches and islands, and Japan with its rich cultural heritage.
More Bookings, More Savings
The more rooms booked through OTAs in a given market, the greater the overall savings.
For example, in Europe, during 2019 to 2021, OTAs accounted for 23.7% of room-nights booked, which translated into a $9.94 average reduction per night. In Asia, where only 12.8% of rooms were booked via OTAs, prices fell by $4.00 a night on average.
Macroeconomic Impacts
Consumers weren’t the only beneficiaries of the online-travel-agency effect. In addition to the estimated $158 billion in consumer savings, there was also a significant impact on a country’s GDP. Between 2019 and 2021, $51.4 billion, $23.8 billion, and $41.2 billion accrued to European, Asian, and North American economies.
At the same time, OTAs were responsible for significant job creation, nearly one million in the eight Asian countries included in the analysis during 2019 alone. Oxford Economics estimated those figures by looking at incremental economic activity.
The Impact of the COVID-19 Pandemic
The elephant in the room here is the COVID-19 pandemic, which hit the travel industry hard as lockdowns and quarantines came down in country after country.
This drop in international travel—which is still one-fifth below 2019 levels—weakened the impact of OTAs. For example, their contribution to North American GDP fell from $19.9 billion in 2019, to $10.2 billion in 2020. Similarly, the number of incremental jobs fell from 187,000 to 99,000.
And the effect carried over into the annual consumer savings. In 2019, global savings added up to $81 billion dollars, but fell to $31 billion in 2020 before recovering somewhat to $45 billion the following year.
Choice, Transparency, and Savings
So what’s driving all this?
Ultimately, OTAs increase choice and transparency, which puts downward pressure on prices. A more knowledgable consumer forces greater competitions, as accommodations compete to fill their rooms. What a difference a few clicks make?
Download the free report on the Economic Impact of Online Travel Agencies in the U.S. to learn more.

-

 Economy2 days ago
Economic Growth Forecasts for G7 and BRICS Countries in 2024
The IMF has released its economic growth forecasts for 2024. How do the G7 and BRICS countries compare?
-

 United States2 weeks ago
Ranked: The Largest U.S. Corporations by Number of Employees
We visualized the top U.S. companies by employees, revealing the massive scale of retailers like Walmart, Target, and Home Depot.
-

 Economy2 weeks ago
Where U.S. Inflation Hit the Hardest in March 2024
We visualized product categories that saw the highest % increase in price due to U.S. inflation as of March 2024.
-

 Economy1 month ago
G20 Inflation Rates: Feb 2024 vs COVID Peak
We visualize inflation rates across G20 countries as of Feb 2024, in the context of their COVID-19 pandemic peak.
-

 Economy1 month ago
Mapped: Unemployment Claims by State
This visual heatmap of unemployment claims by state highlights New York, California, and Alaska leading the country by a wide margin.
-

 Economy2 months ago
Confidence in the Global Economy, by Country
Will the global economy be stronger in 2024 than in 2023?