shipping
Visualized: Seaport Trade Traffic by Country
Article/Editing:
Visualized: Seaport Trade Traffic by Country
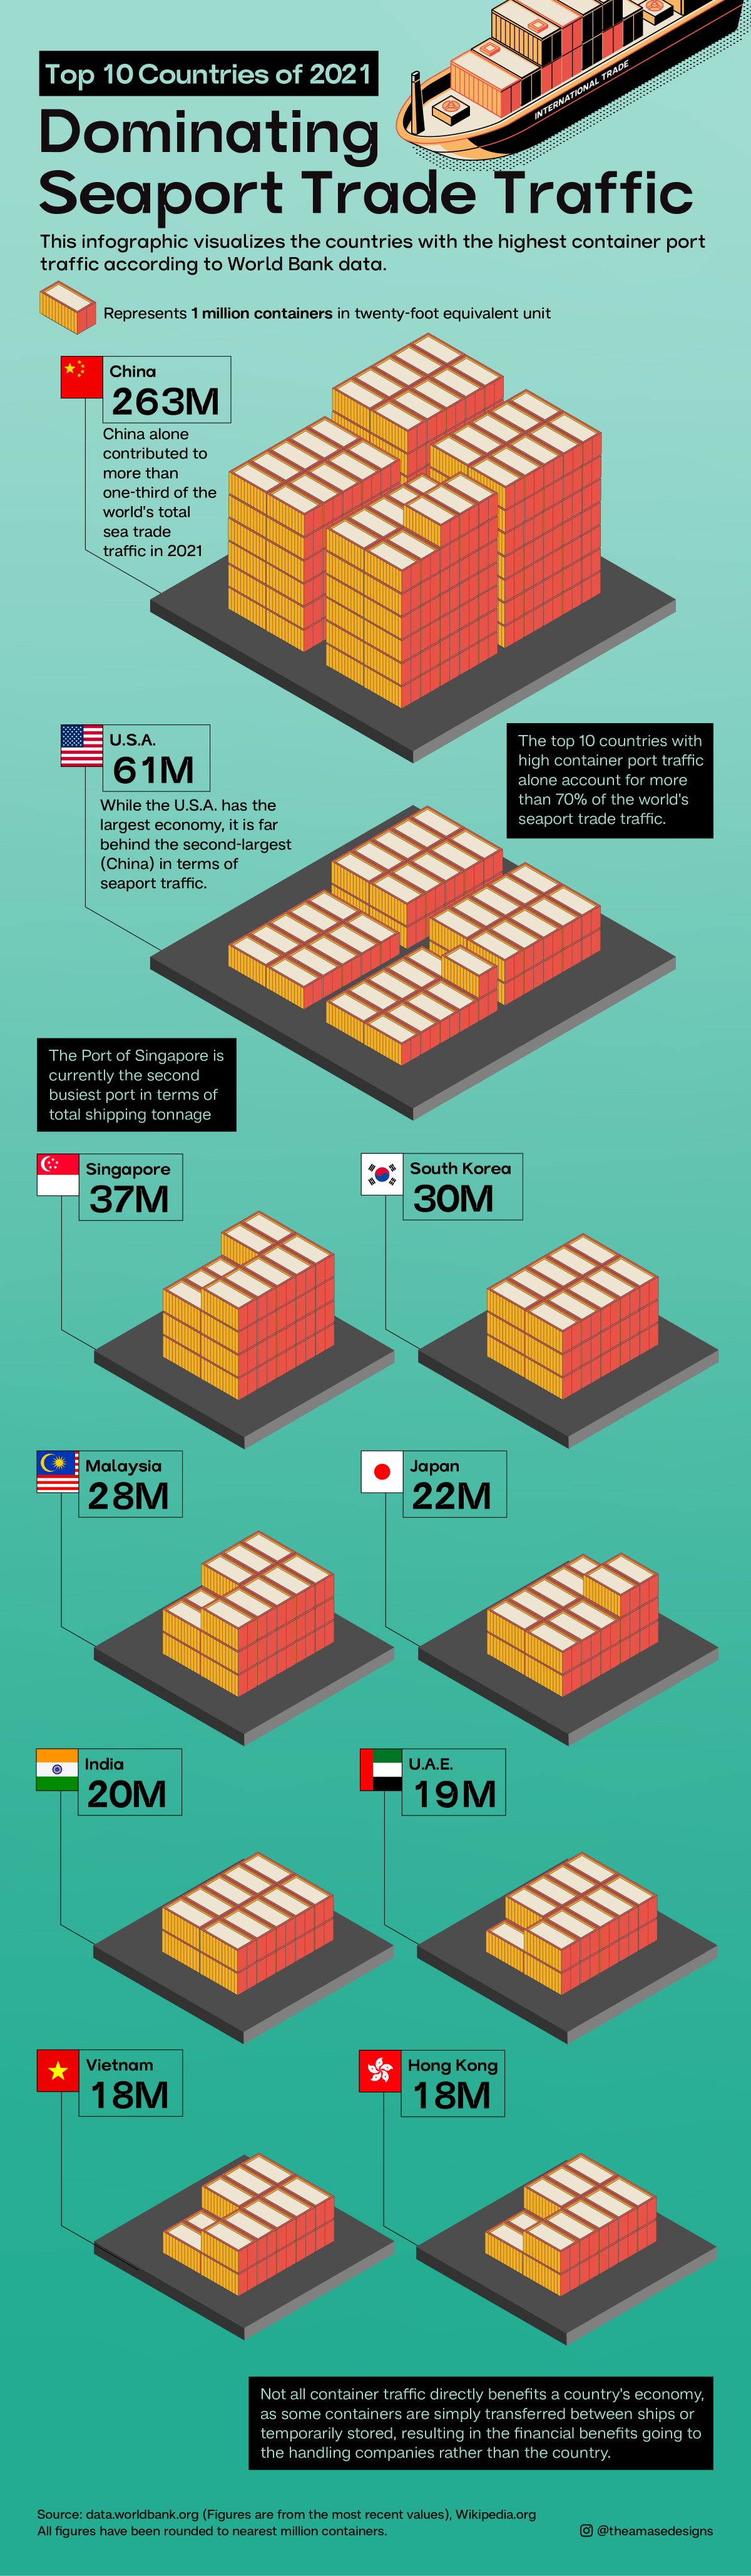
According to the World Bank, global seaport trade traffic reached 841 million TEUs (20-foot container equivalent units) in 2021.
In this infographic, Winifred Amase uses that data to highlight the countries with the highest seaport trade traffic.
China Leads All Seaport Trade Traffic
With a third of the world’s total seaport trade traffic surrounding its many ports, it’s no surprise to see China on top of the list.
In addition to owning seven of the world’s 10 busiest ports, the country also owns close to 100 ports across 63 other countries. This brought the country’s container traffic up to 263 million TEUs in 2021.
| Country | 20-Foot Container Count (2021) |
|---|---|
| 🇨🇳 China | 263M |
| 🇺🇸 United States | 61M |
| 🇸🇬 Singapore | 37M |
| 🇰🇷 South Korea | 30M |
| 🇲🇾 Malaysia | 28M |
| 🇯🇵 Japan | 22M |
| 🇮🇳 India | 20M |
| 🇦🇪 United Arab Emirates | 19M |
| 🇻🇳 Vietnam | 18M |
| 🇭🇰 Hong Kong SAR, China | 18M |
In second place is the United States, which saw container traffic of 61 million TEUs. Massive U.S. ports in Los Angeles and New York are some of the busiest ports on the continent.
Asian countries dominated the rest of the top 10 list, taking up seven of the remaining eight spots.
Singapore came in third with 37 million 20-foot container units passing through in 2021. The port handled 599 million tonnes of freight, making it the busiest single port in total shipping tonnage.
The ports in Dubai and Abu Dhabi make the United Arab Emirates a key player in Middle Eastern trade. With a container traffic of 19 million TEUs, the UAE is seventh on the list of nations with the highest seaport traffic in 2021.

This article was published as a part of Visual Capitalist's Creator Program, which features data-driven visuals from some of our favorite Creators around the world.


Markets
Visualizing 150 Years of Exports for Top Economic Superpowers
Today, China dominates the trade market, accounting for almost 15% of all merchandise.
150 Years of Exports by Economic Superpowers
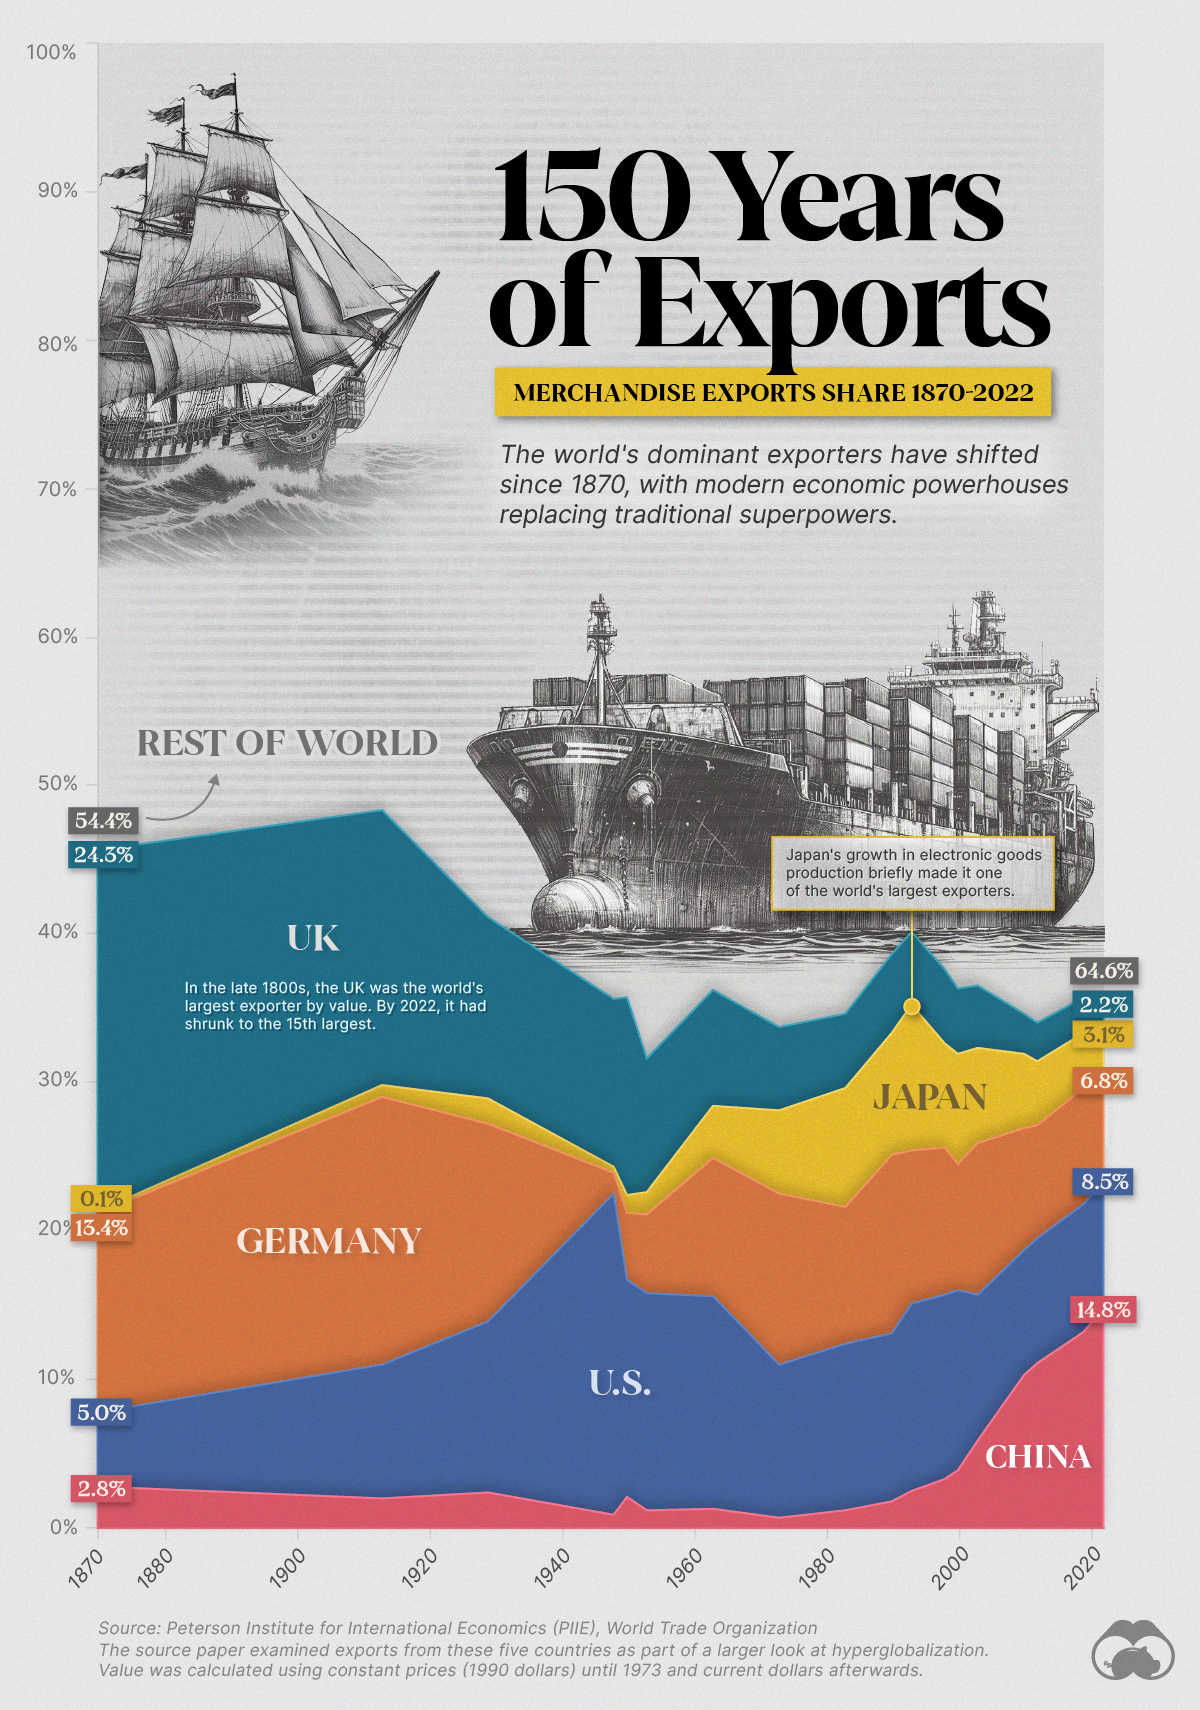
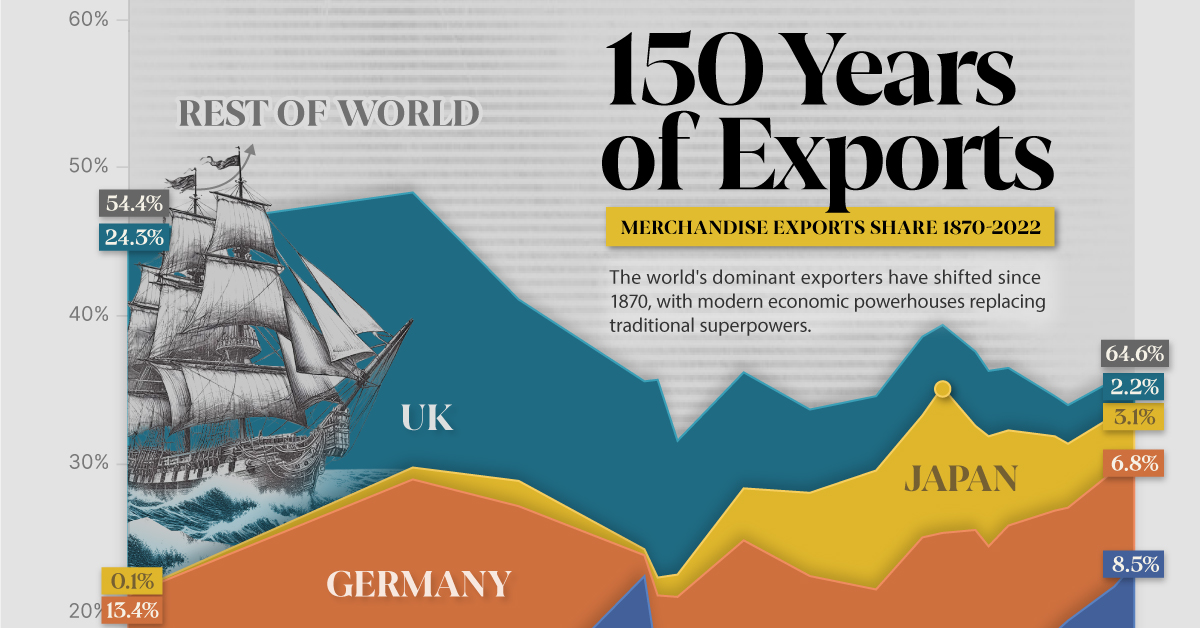
Historically, the biggest economies in the world have also been those that dominate international trade overseas.
This visualization uses data from the Peterson Institute for International Economics (PIIE) and the World Trade Organization to show how global export shares by value have changed over the last 150 years for some of the world’s top powers.
Merchandise Exports Share 1870-2022
During the 19th century, Britain was the world’s richest and most advanced economy. The economy was the most industrialized globally, with one-third of the population employed in manufacturing.
As a result, the UK’s finished goods were produced so efficiently and cheaply that they were widely traded worldwide, and were easily found in almost any other market.
Additionally, the British Empire benefited from its colonies, with India representing 42% of its exports by the end of the century.
During that period, Britain dominated merchandise exports, followed by Germany:
| Year | UK | Germany | U.S. | Japan | China | ROW |
|---|---|---|---|---|---|---|
| 1870 | 24.3% | 13.4% | 5.0% | 0.1% | 2.8% | 54.4% |
| 1913 | 18.5% | 18.0% | 9.0% | 0.8% | 2.0% | 51.7% |
| 1929 | 12.2% | 13.3% | 11.5% | 1.7% | 2.4% | 58.9% |
| 1948 | 11.3% | 1.4% | 21.6% | 0.4% | 0.9% | 64.4% |
| 1950 | 13.3% | 4.5% | 14.6% | 1.2% | 2.1% | 64.3% |
| 1953 | 9.0% | 5.3% | 14.6% | 1.5% | 1.2% | 68.4% |
| 1963 | 7.8% | 9.3% | 14.3% | 3.5% | 1.3% | 63.8% |
| 1973 | 5.6% | 11.5% | 10.3% | 5.6% | 0.7% | 66.3% |
| 1983 | 5.0% | 9.2% | 11.2% | 8.0% | 1.2% | 65.4% |
| 1990 | 5.3% | 12.0% | 11.3% | 8.2% | 1.8% | 61.4% |
| 1993 | 4.9% | 10.3% | 12.6% | 9.8% | 2.5% | 59.9% |
| 1998 | 5.0% | 9.9% | 12.4% | 7.0% | 3.3% | 62.4% |
| 2000 | 4.4% | 8.5% | 12.1% | 7.4% | 3.9% | 63.7% |
| 2003 | 4.2% | 10.2% | 9.8% | 6.4% | 5.9% | 63.5% |
| 2010 | 2.7% | 8.2% | 8.4% | 5.0% | 10.3% | 65.4% |
| 2012 | 2.6% | 7.6% | 8.4% | 4.3% | 11.1% | 66.0% |
| 2019 | 2.4% | 7.8% | 8.6% | 3.7% | 13.2% | 64.3% |
| 2022 | 2.2% | 6.8% | 8.5% | 3.1% | 14.8% | 64.6% |
After World War II, the U.S. overtook British and German export leadership.
Unlike Europe and many other parts of the world that experienced devastation and economic hardship due to the war, the U.S. emerged relatively unscathed in terms of physical destruction and with a significantly strengthened industrial base.
Asian Growth from the 1980s to the Present
During the 1980s and 1990s, Japan experienced rapid export growth, driven by electronics-related goods, and became one of the largest trading partners of the United States.
Today, China dominates the trade market, accounting for almost 15% of all merchandise.
China’s manufacturing industry has become a leader in producing almost anything from commonplace household items to integral pieces in automotive manufacturing. Some staples of Chinese manufacturing are:
- Precision instruments
- Semiconductors
- Industrial machinery for computers and smartphones
Since 1948, global merchandise exports have grown from $59 billion to $24.3 trillion in 2022.

-

 Science1 week ago
Visualizing the Average Lifespans of Mammals
-

 Markets2 weeks ago
The Top 10 States by Real GDP Growth in 2023
-

 Demographics2 weeks ago
The Smallest Gender Wage Gaps in OECD Countries
-

 United States2 weeks ago
Where U.S. Inflation Hit the Hardest in March 2024
-

 Green2 weeks ago
Top Countries By Forest Growth Since 2001
-

 United States2 weeks ago
Ranked: The Largest U.S. Corporations by Number of Employees
-

 Maps2 weeks ago
The Largest Earthquakes in the New York Area (1970-2024)
-

 Green2 weeks ago
Ranked: The Countries With the Most Air Pollution in 2023