Politics
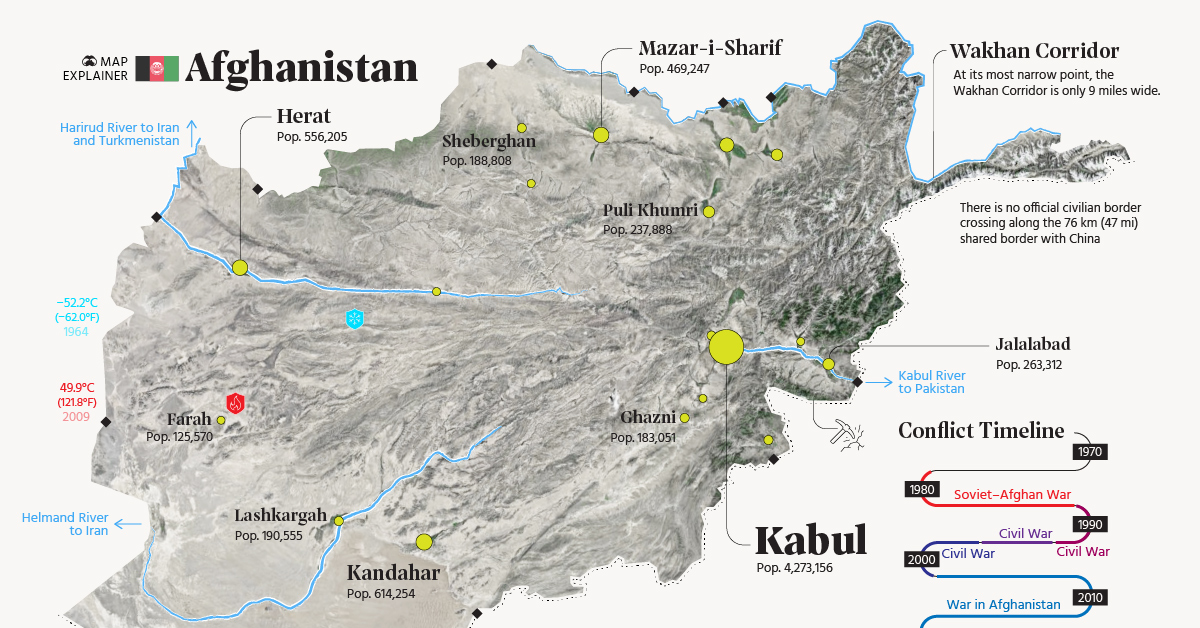
Map Explainer: Key Facts About Afghanistan
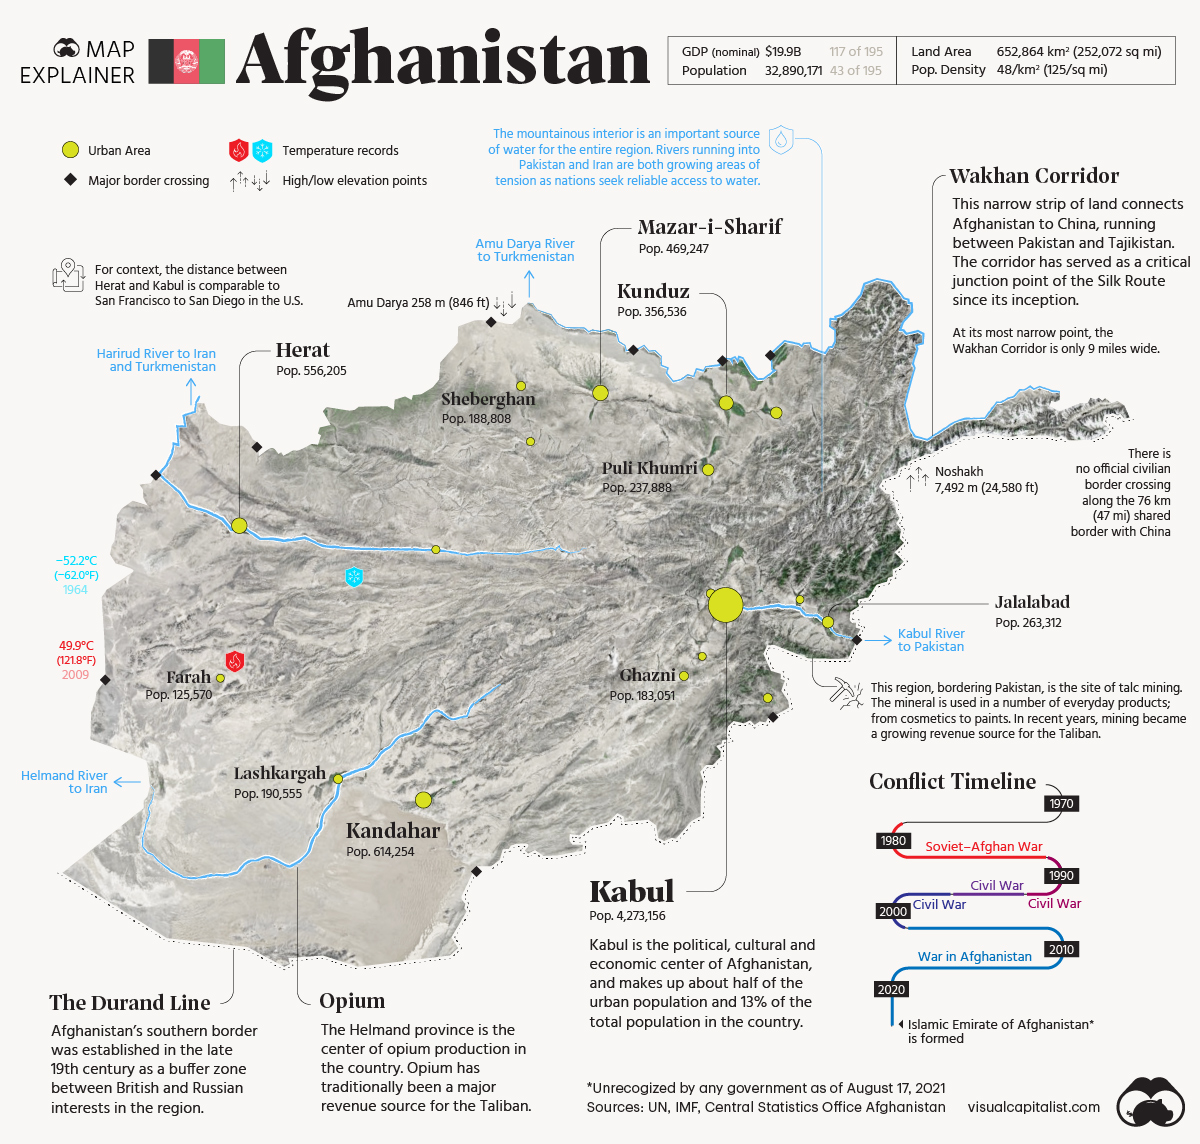


Map Explainer: Key Facts About Afghanistan
The country of Afghanistan has a long and complicated history of domination by foreign powers and conflict between factions within the country.
While Afghanistan is well covered in headlines and news stories, the lion’s share of this coverage is directly related to conflict. As a result, Afghanistan is viewed by many in Western countries as a war-torn desert, with conflict, ideology, and geopolitical power obscuring more practical information about the country and its people.
In the Afghanistan map graphic above, we step back and examine Afghanistan from a structural point of view. How does its unique landscape influence population patterns? How does this geography influence the economy and relationships with neighboring nations? Let’s dive in.
Mountain High, Valley Low
Afghanistan’s rugged landscape is defined by towering snow-capped mountains, fertile valleys, and expansive deserts.
First, the country has a wide variety of climate extremes. There is more than 100ºC (180ºF) separating the record high and low temperatures.
The extremes don’t stop at temperature though. Afghanistan has the sixth-highest elevation span in the world, with 7,234m (23,734 ft) between its highest and lowest point. Afghanistan is one of 44 landlocked nations in the world, which helps explain why its lowest point is so much higher than sea level.
For those living in North America, the country’s terrain has been compared to Colorado, with Kabul sharing similarities with Denver.
Where Do People Live in Afghanistan?
Settlement patterns in Afghanistan are similar to other countries in the region; people cluster where there is access to fresh water.
As the cartogram below demonstrates, a large portion of the country’s population is located around Kabul, and the region adjacent to the Kabul River.
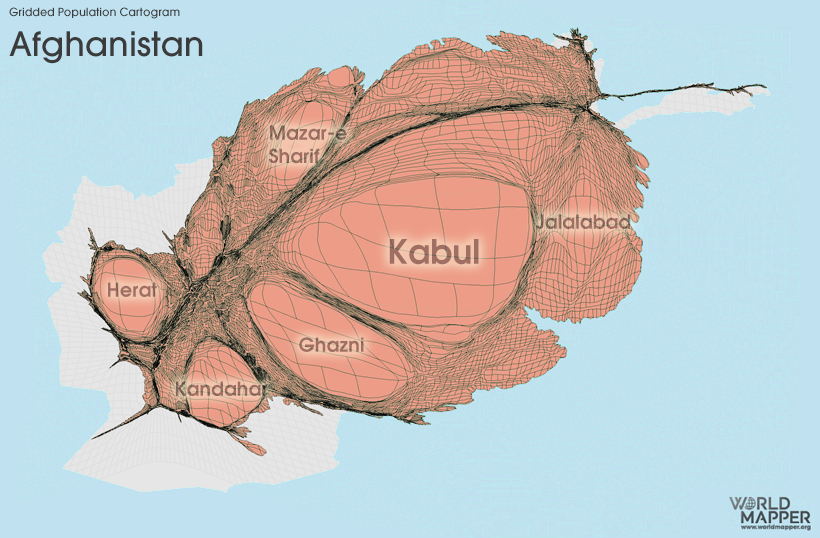
The southwestern province of Nimruz is the most sparsely populated area in the country. The Wakhan Corridor—which connects Afghanistan to China—is also very sparsely populated, with about 14,000 total residents.
Key Facts About Afghanistan’s Demographics
Afghanistan has a very youthful population. The country’s median age of 19 years is one of the youngest in the world, and is low compared to its neighbors Pakistan (24) and Iran (30).
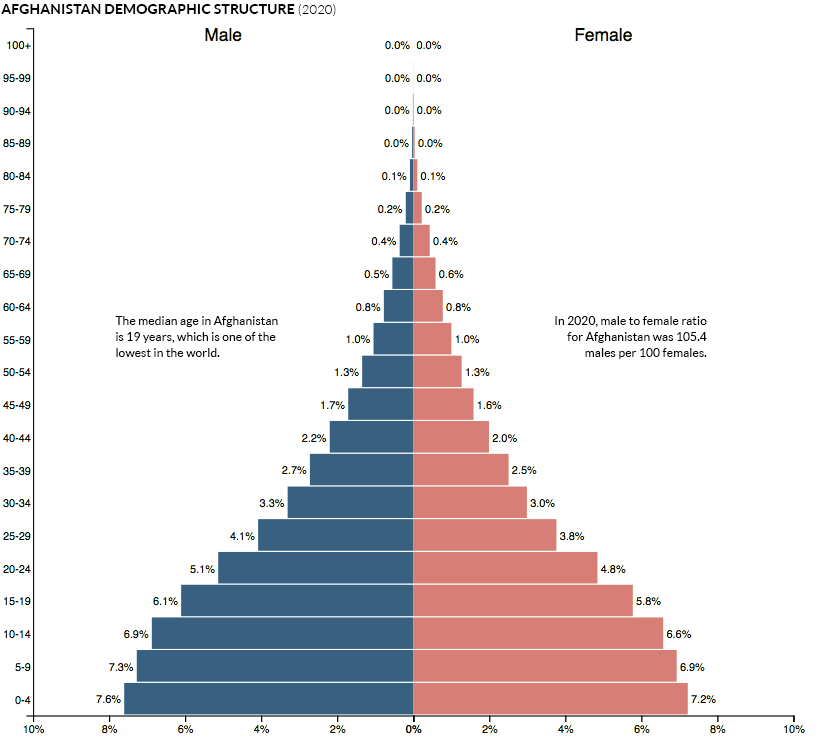
Islam is the official state religion of Afghanistan. 99.7% of the Afghan population are Muslim, one of the highest proportions of the 49 Muslim-majority countries.
So far in 2021, the OCHA estimates that 550,000 people in Afghanistan are “internally displaced” due to conflict, and this number may rise still as new data tracks the final days of the Taliban’s takeover of the country. The majority of those displaced persons are children.
Paving the Way
The Ring Road connecting Afghanistan’s major cities began in the 1960s but was soon cut short by war. After the U.S. took control in 2001, new road construction began in earnest.
Between 2002 and 2016, USAID and the Department of Defense (DoD) spent approximately $2.8 billion building and maintaining Afghanistan’s road infrastructure. This number doesn’t include additional investment from other sources that poured in to improve the country’s road network.
The result is a more comprehensive road network, but one that is difficult to maintain. A 2016 report found collapsed bridges and sections of road around the country that were washed out.
Resources and Relationships
Afghanistan is a critical source of fresh water for the arid region. Several major regional rivers flow from the country’s mountainous eastern provinces into neighboring countries, so any new irrigation schemes and dam infrastructure will come with a geopolitical price tag as well.
Already in the recent past, tensions have increased with Iran and Pakistan over the flow of water crossing the border.
Outside countries are also very interested in Afghanistan’s rich mineral resources. Decades of near-continuous conflict have made mining a tough proposition in the country, but with growing demand for resources such as lithium and rare earths, that may soon change.
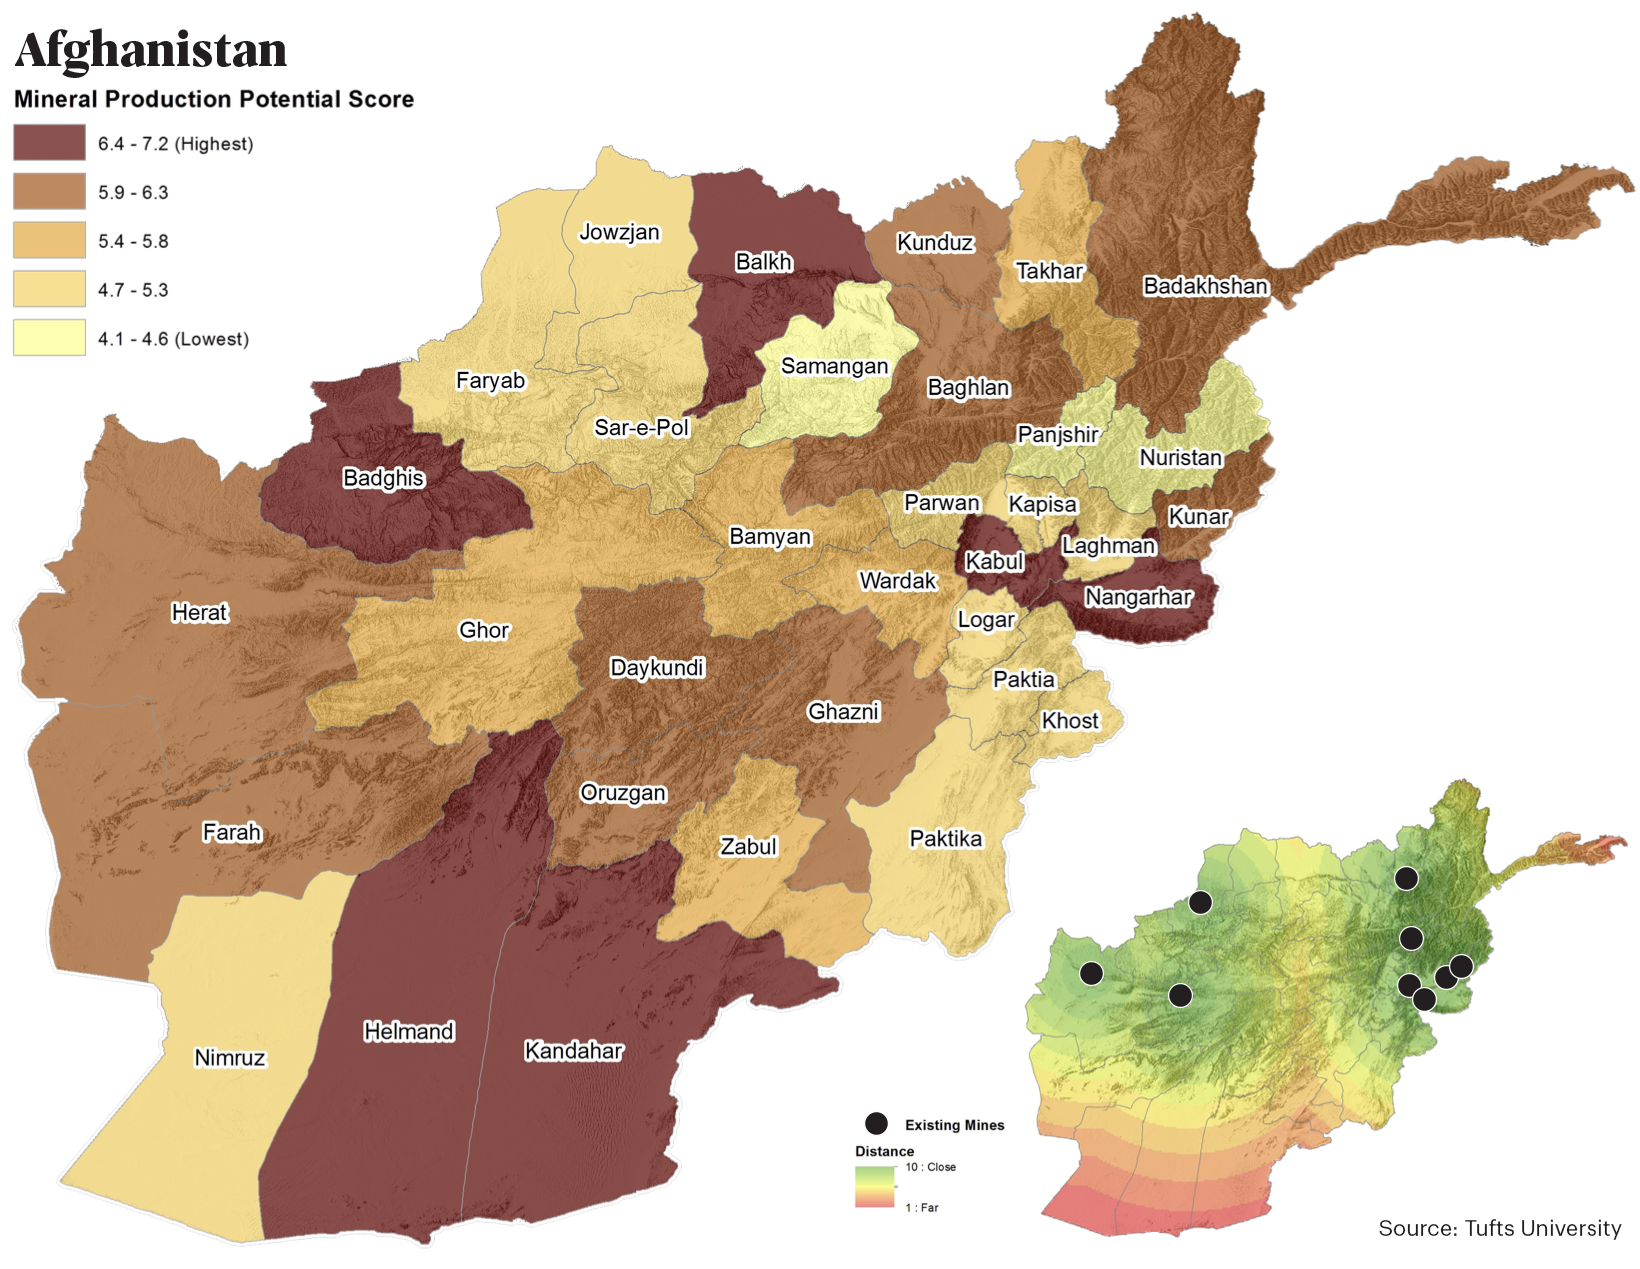
Afghanistan is estimated to have over $1 trillion of untapped mineral reserves, and outside interests are taking notice.
China said it was ready for “friendly and cooperative relations” with the new Taliban regime, and it’s possible that investment from China’s Belt and Road Initiative (BRI) may step in to fill the vacuum left by departing Western powers.


Economy
The Bloc Effect: International Trade with Geopolitical Allies on the Rise
Rising geopolitical tensions are shaping the future of international trade, but what is the effect on trading among G7 and BRICS countries?


The Bloc Effect: International Trade with Allies on the Rise
International trade has become increasingly fragmented over the last five years as countries have shifted to trading more with their geopolitical allies.
This graphic from The Hinrich Foundation, the first in a three-part series covering the future of trade, provides visual context to the growing divide in trade in G7 and pre-expansion BRICS countries, which are used as proxies for geopolitical blocs.
Trade Shifts in G7 and BRICS Countries
This analysis uses IMF data to examine differences in shares of exports within and between trading blocs from 2018 to 2023. For example, we looked at the percentage of China’s exports with other BRICS members as well as with G7 members to see how these proportions shifted in percentage points (pp) over time.
Countries traded nearly $270 billion more with allies in 2023 compared to 2018. This shift came at the expense of trade with rival blocs, which saw a decline of $314 billion.
Country Change in Exports Within Bloc (pp) Change in Exports With Other Bloc (pp)
🇮🇳 India 0.0 3.9
🇷🇺 Russia 0.7 -3.8
🇮🇹 Italy 0.8 -0.7
🇨🇦 Canada 0.9 -0.7
🇫🇷 France 1.0 -1.1
🇪🇺 EU 1.1 -1.5
🇩🇪 Germany 1.4 -2.1
🇿🇦 South Africa 1.5 1.5
🇺🇸 U.S. 1.6 -0.4
🇯🇵 Japan 2.0 -1.7
🇨🇳 China 2.1 -5.2
🇧🇷 Brazil 3.7 -3.3
🇬🇧 UK 10.2 0.5
All shifts reported are in percentage points. For example, the EU saw its share of exports to G7 countries rise from 74.3% in 2018 to 75.4% in 2023, which equates to a 1.1 percentage point increase.
The UK saw the largest uptick in trading with other countries within the G7 (+10.2 percentage points), namely the EU, as the post-Brexit trade slump to the region recovered.
Meanwhile, the U.S.-China trade dispute caused China’s share of exports to the G7 to fall by 5.2 percentage points from 2018 to 2023, the largest decline in our sample set. In fact, partly as a result of the conflict, the U.S. has by far the highest number of harmful tariffs in place.
The Russia-Ukraine War and ensuing sanctions by the West contributed to Russia’s share of exports to the G7 falling by 3.8 percentage points over the same timeframe.
India, South Africa, and the UK bucked the trend and continued to witness advances in exports with the opposing bloc.
Average Trade Shifts of G7 and BRICS Blocs
Though results varied significantly on a country-by-country basis, the broader trend towards favoring geopolitical allies in international trade is clear.
Bloc Change in Exports Within Bloc (pp) Change in Exports With Other Bloc (pp)
Average 2.1 -1.1
BRICS 1.6 -1.4
G7 incl. EU 2.4 -1.0
Overall, BRICS countries saw a larger shift away from exports with the other bloc, while for G7 countries the shift within their own bloc was more pronounced. This implies that though BRICS countries are trading less with the G7, they are relying more on trade partners outside their bloc to make up for the lost G7 share.
A Global Shift in International Trade and Geopolitical Proximity
The movement towards strengthening trade relations based on geopolitical proximity is a global trend.
The United Nations categorizes countries along a scale of geopolitical proximity based on UN voting records.
According to the organization’s analysis, international trade between geopolitically close countries rose from the first quarter of 2022 (when Russia first invaded Ukraine) to the third quarter of 2023 by over 6%. Conversely, trade with geopolitically distant countries declined.
The second piece in this series will explore China’s gradual move away from using the U.S. dollar in trade settlements.
Visit the Hinrich Foundation to learn more about the future of geopolitical trade

-

 Economy2 days ago
Economic Growth Forecasts for G7 and BRICS Countries in 2024
The IMF has released its economic growth forecasts for 2024. How do the G7 and BRICS countries compare?
-

 United States2 weeks ago
Ranked: The Largest U.S. Corporations by Number of Employees
We visualized the top U.S. companies by employees, revealing the massive scale of retailers like Walmart, Target, and Home Depot.
-

 Economy2 weeks ago
Where U.S. Inflation Hit the Hardest in March 2024
We visualized product categories that saw the highest % increase in price due to U.S. inflation as of March 2024.
-

 Economy4 weeks ago
G20 Inflation Rates: Feb 2024 vs COVID Peak
We visualize inflation rates across G20 countries as of Feb 2024, in the context of their COVID-19 pandemic peak.
-

 Economy1 month ago
Mapped: Unemployment Claims by State
This visual heatmap of unemployment claims by state highlights New York, California, and Alaska leading the country by a wide margin.
-

 Economy2 months ago
Confidence in the Global Economy, by Country
Will the global economy be stronger in 2024 than in 2023?


-

 Mining1 week ago
Gold vs. S&P 500: Which Has Grown More Over Five Years?
-

 Markets2 weeks ago
Ranked: The Most Valuable Housing Markets in America
-

 Money2 weeks ago
Which States Have the Highest Minimum Wage in America?
-

 AI2 weeks ago
Ranked: Semiconductor Companies by Industry Revenue Share
-

 Markets2 weeks ago
Ranked: The World’s Top Flight Routes, by Revenue
-

 Countries2 weeks ago
Population Projections: The World’s 6 Largest Countries in 2075
-

 Markets2 weeks ago
The Top 10 States by Real GDP Growth in 2023
-

 Demographics2 weeks ago
The Smallest Gender Wage Gaps in OECD Countries