Technology
How Facebook is Using Machine Learning to Map the World Population
When it comes to knowing where humans around the world actually live, resources come in varying degrees of accuracy and sophistication.
Heavily urbanized and mature economies generally produce a wealth of up-to-date information on population density and granular demographic data. In rural Africa or fast-growing regions in the developing world, tracking methods cannot always keep up, or in some cases may be non-existent.
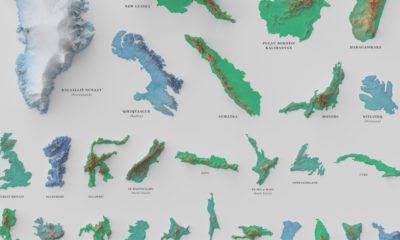
This is where new maps, produced by researchers at Facebook, come in. Building upon CIESIN’s Gridded Population of the World project, Facebook is using machine learning models on high-resolution satellite imagery to paint a definitive picture of human settlement around the world. Let’s zoom in.
Connecting the Dots
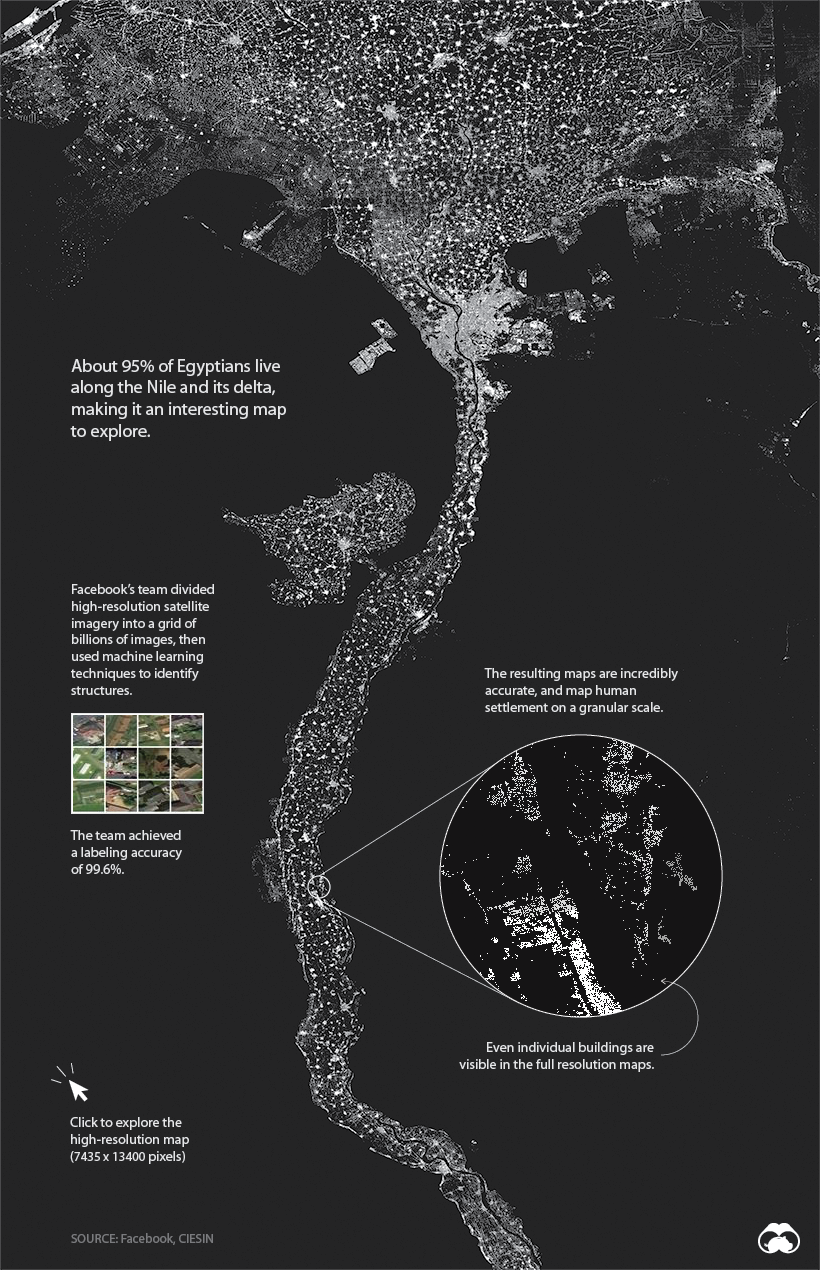
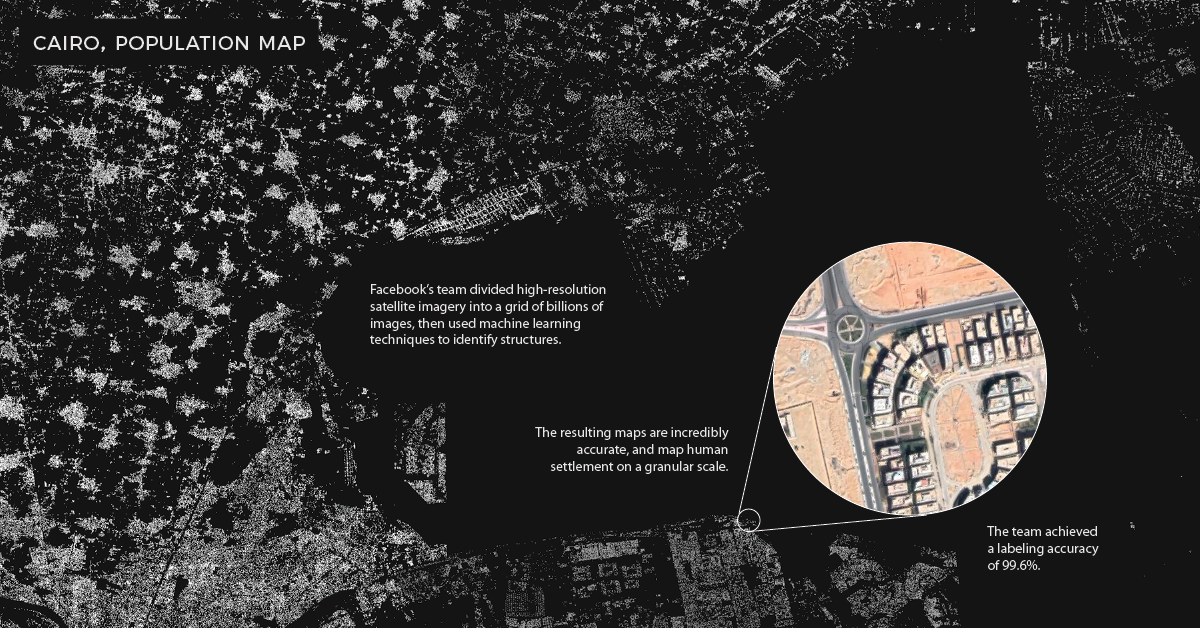
Will all other details stripped away, human settlement can form some interesting patterns. One of the most compelling examples is Egypt, where 95% of the population lives along the Nile River. Below, we can clearly see where people live, and where they don’t.
View the full-resolution version of this map.
While it is possible to use a tool like Google Earth to view nearly any location on the globe, the problem is analyzing the imagery at scale. This is where machine learning comes into play.
Finding the People in the Petabytes
High-resolution imagery of the entire globe takes up about 1.5 petabytes of storage, making the task of classifying the data extremely daunting. It’s only very recently that technology was up to the task of correctly identifying buildings within all those images.
To get the results we see today, researchers used process of elimination to discard locations that couldn’t contain a building, then ranked them based on the likelihood they could contain a building.
Facebook identified structures at scale using a process called weakly supervised learning. After training the model using large batches of photos, then checking over the results, Facebook was able to reach a 99.6% labeling accuracy for positive examples.
Why it Matters
An accurate picture of where people live can be a matter of life and death.
For humanitarian agencies working in Africa, effectively distributing aid or vaccinating populations is still a challenge due to the lack of reliable maps and population density information. Researchers hope that these detailed maps will be used to save lives and improve living conditions in developing regions.
For example, Malawi is one of the world’s least urbanized countries, so finding its 19 million citizens is no easy task for people doing humanitarian work there. These maps clearly show where people live and allow organizations to create accurate population density estimates for specific areas.

Visit the project page for a full explanation and to access the full database of country maps.


Technology
All of the Grants Given by the U.S. CHIPS Act
Intel, TSMC, and more have received billions in subsidies from the U.S. CHIPS Act in 2024.


All of the Grants Given by the U.S. CHIPS Act
This was originally posted on our Voronoi app. Download the app for free on iOS or Android and discover incredible data-driven charts from a variety of trusted sources.
This visualization shows which companies are receiving grants from the U.S. CHIPS Act, as of April 25, 2024. The CHIPS Act is a federal statute signed into law by President Joe Biden that authorizes $280 billion in new funding to boost domestic research and manufacturing of semiconductors.
The grant amounts visualized in this graphic are intended to accelerate the production of semiconductor fabrication plants (fabs) across the United States.
Data and Company Highlights
The figures we used to create this graphic were collected from a variety of public news sources. The Semiconductor Industry Association (SIA) also maintains a tracker for CHIPS Act recipients, though at the time of writing it does not have the latest details for Micron.
| Company | Federal Grant Amount | Anticipated Investment From Company |
|---|---|---|
| 🇺🇸 Intel | $8,500,000,000 | $100,000,000,000 |
| 🇹🇼 TSMC | $6,600,000,000 | $65,000,000,000 |
| 🇰🇷 Samsung | $6,400,000,000 | $45,000,000,000 |
| 🇺🇸 Micron | $6,100,000,000 | $50,000,000,000 |
| 🇺🇸 GlobalFoundries | $1,500,000,000 | $12,000,000,000 |
| 🇺🇸 Microchip | $162,000,000 | N/A |
| 🇬🇧 BAE Systems | $35,000,000 | N/A |
BAE Systems was not included in the graphic due to size limitations
Intel’s Massive Plans
Intel is receiving the largest share of the pie, with $8.5 billion in grants (plus an additional $11 billion in government loans). This grant accounts for 22% of the CHIPS Act’s total subsidies for chip production.
From Intel’s side, the company is expected to invest $100 billion to construct new fabs in Arizona and Ohio, while modernizing and/or expanding existing fabs in Oregon and New Mexico. Intel could also claim another $25 billion in credits through the U.S. Treasury Department’s Investment Tax Credit.
TSMC Expands its U.S. Presence
TSMC, the world’s largest semiconductor foundry company, is receiving a hefty $6.6 billion to construct a new chip plant with three fabs in Arizona. The Taiwanese chipmaker is expected to invest $65 billion into the project.
The plant’s first fab will be up and running in the first half of 2025, leveraging 4 nm (nanometer) technology. According to TrendForce, the other fabs will produce chips on more advanced 3 nm and 2 nm processes.
The Latest Grant Goes to Micron
Micron, the only U.S.-based manufacturer of memory chips, is set to receive $6.1 billion in grants to support its plans of investing $50 billion through 2030. This investment will be used to construct new fabs in Idaho and New York.

-

 Science1 week ago
Visualizing the Average Lifespans of Mammals
-

 Markets2 weeks ago
The Top 10 States by Real GDP Growth in 2023
-

 Demographics2 weeks ago
The Smallest Gender Wage Gaps in OECD Countries
-

 United States2 weeks ago
Where U.S. Inflation Hit the Hardest in March 2024
-

 Green2 weeks ago
Top Countries By Forest Growth Since 2001
-

 United States2 weeks ago
Ranked: The Largest U.S. Corporations by Number of Employees
-

 Maps2 weeks ago
The Largest Earthquakes in the New York Area (1970-2024)
-

 Green2 weeks ago
Ranked: The Countries With the Most Air Pollution in 2023