Politics
Map Explainer: The Caucasus Region


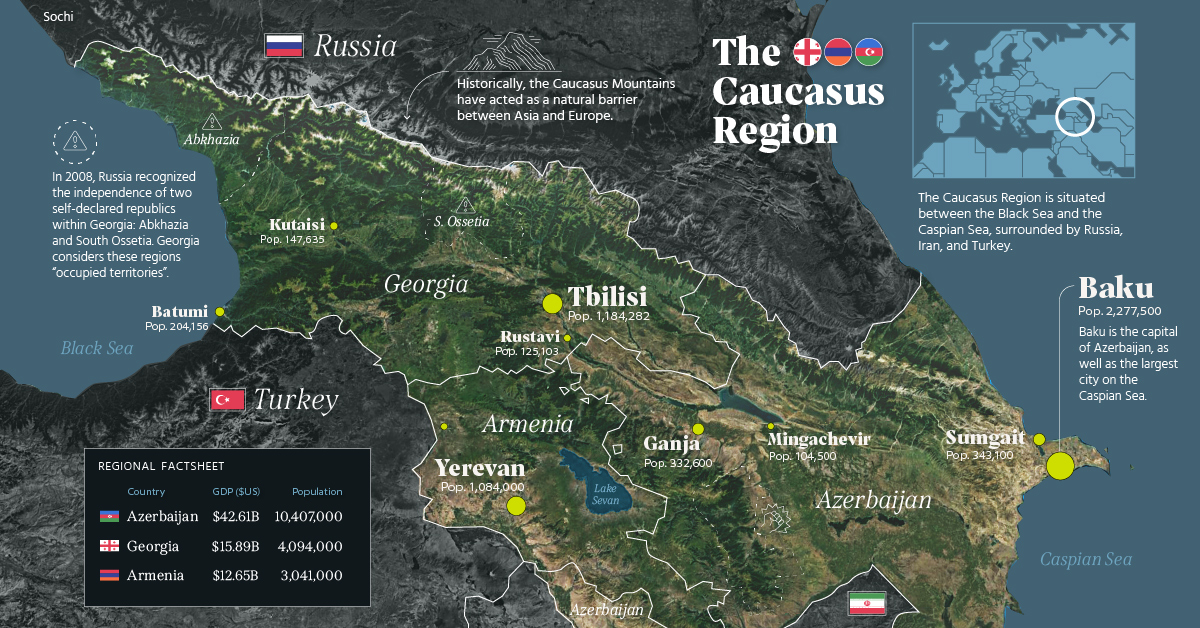
Map Explainer: The Caucasus Region
The Caucasus Region has been engulfed in a territorial dispute between Armenia and Azerbaijan over the Nagorno-Karabakh region for decades now. Although flare-ups in the conflict have been recent, the root of the violence harkens back to the 1980s.
But this map allows us to step back and look at the region in its larger context.
While most media has focused on the tensions, this map breaks down the entire Caucasus region, providing key facts and information. What are the countries that comprise the region? What is the main economic activity in the area? How is the population distributed? Let’s begin.
The Basics
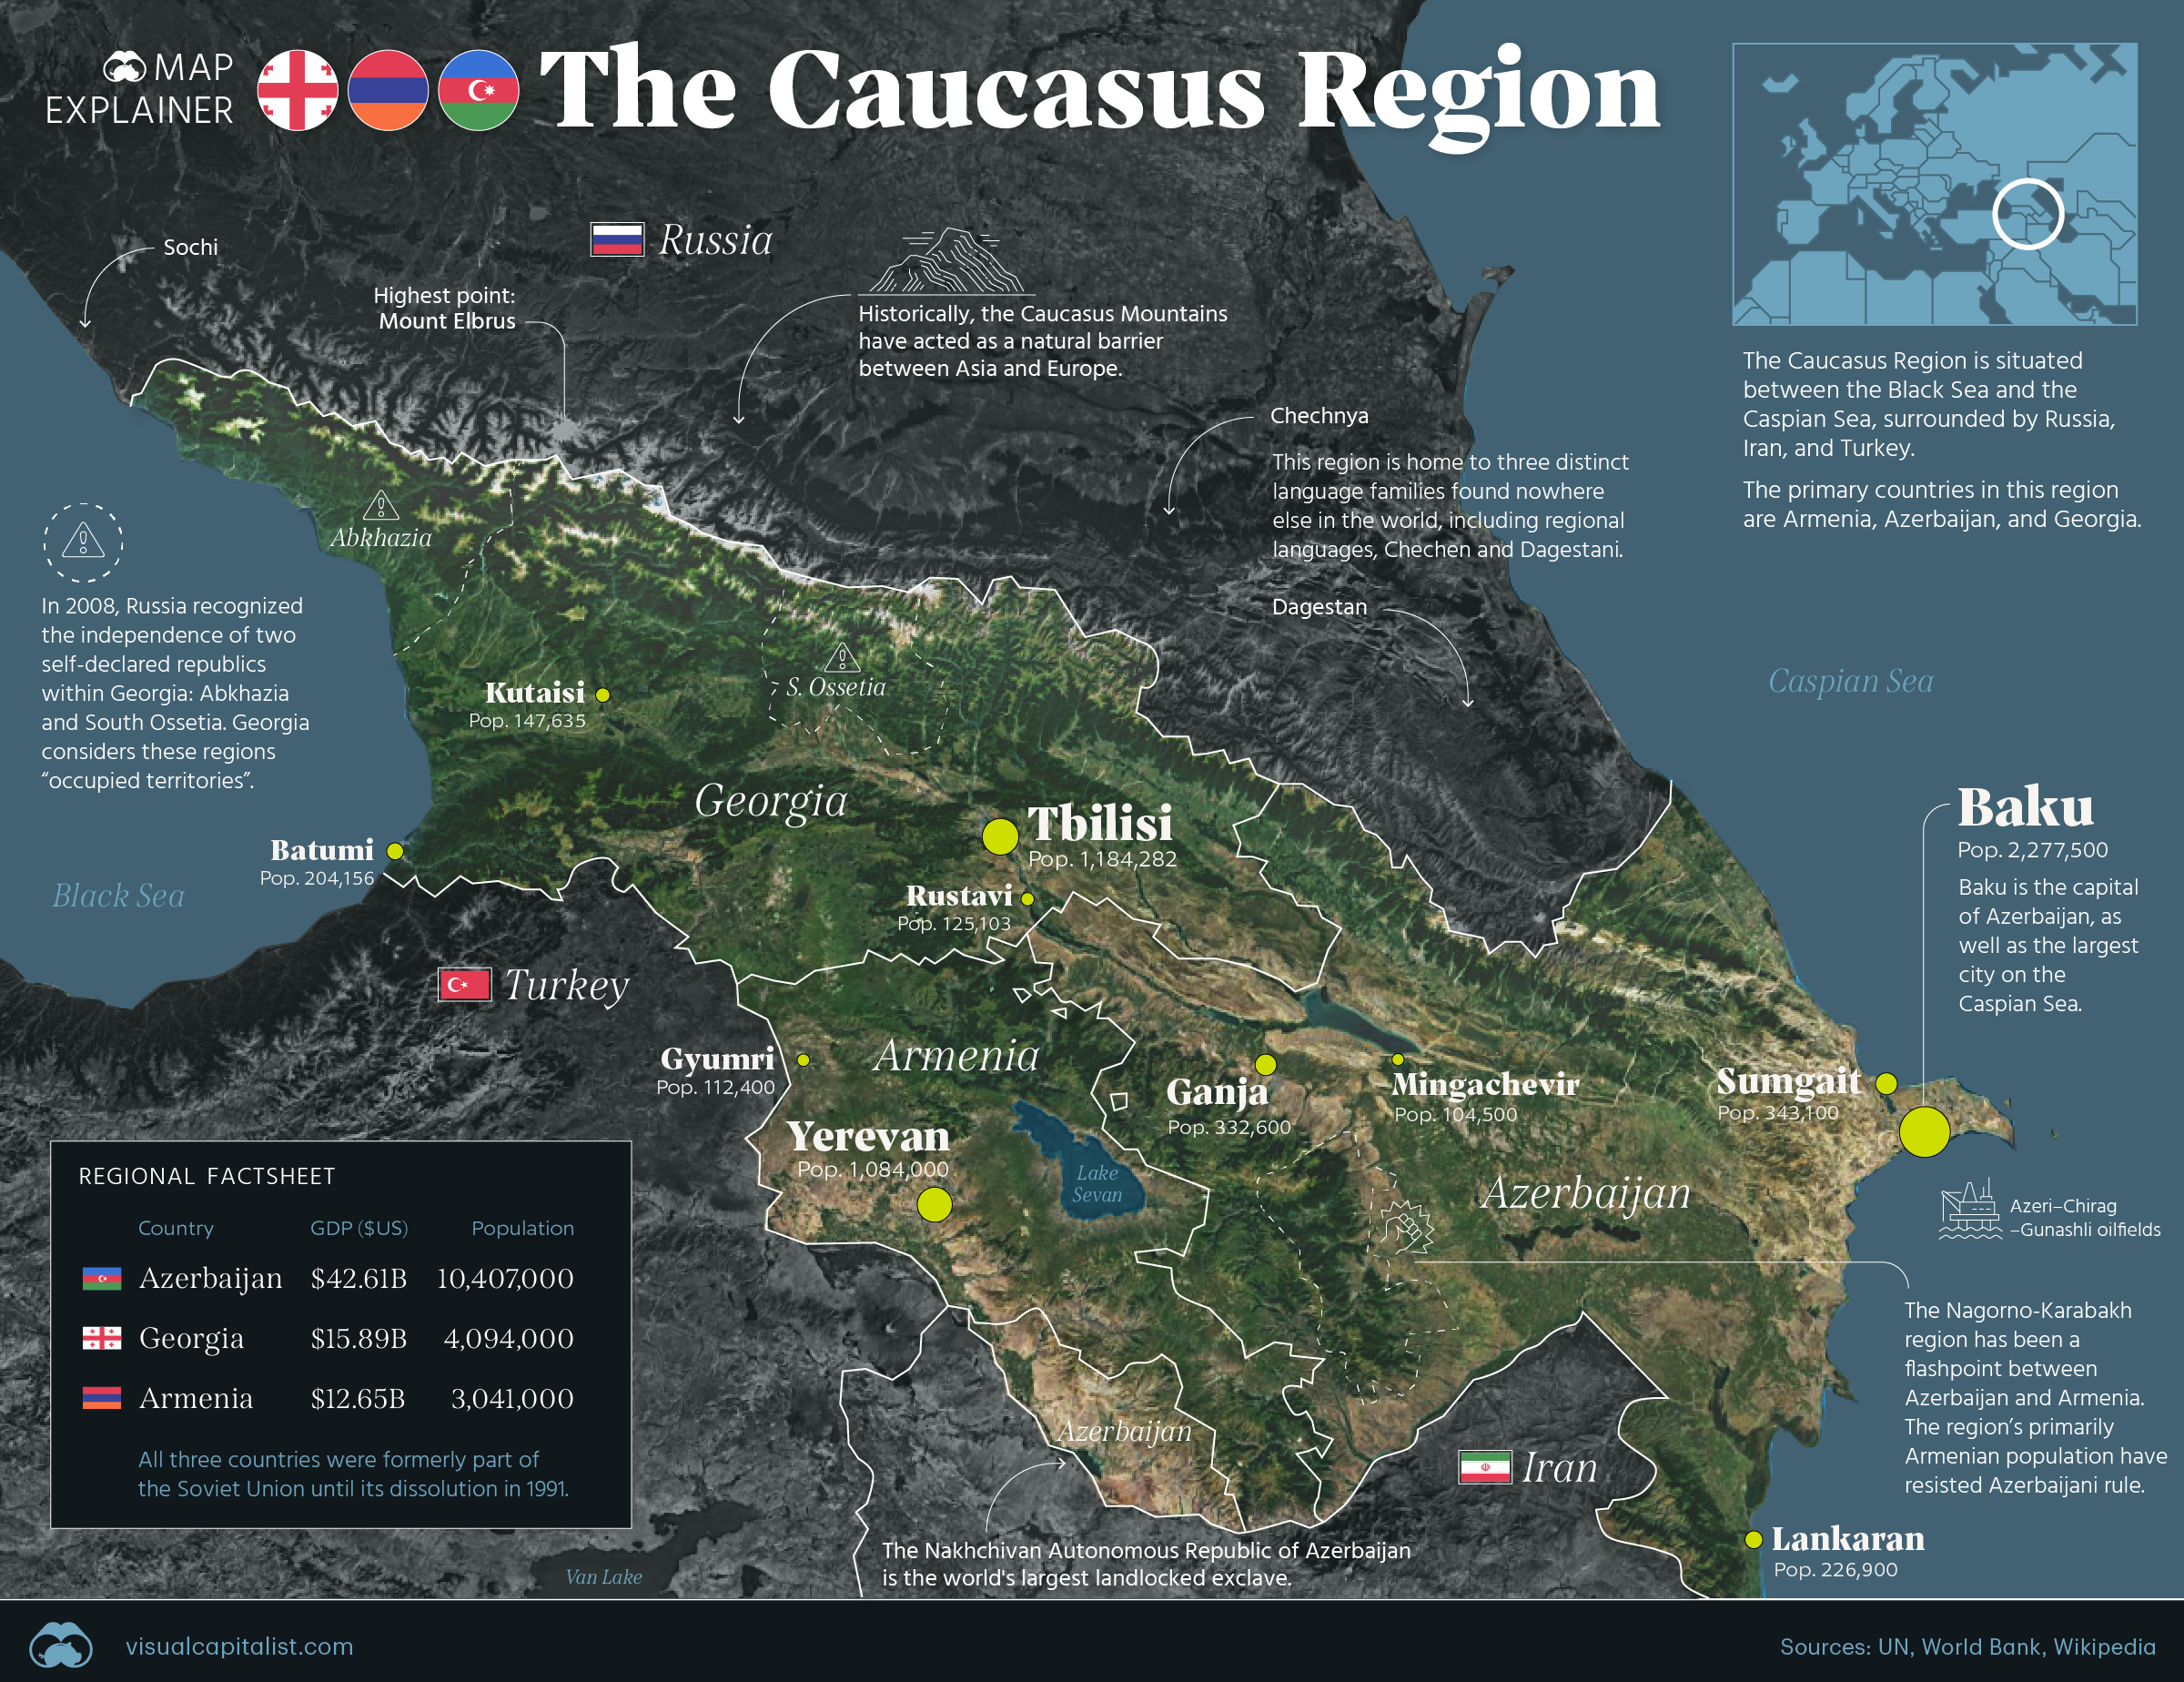
The Caucasus region is characterized by far-reaching mountain ranges, that have long separated people and created distinct ethnic, linguistic, and religious identities over thousands of years. Today, the region spans over three main countries: Armenia, Azerbaijan, and Georgia, and is bordered by Russia, Turkey, and Iran.
Focusing on the main three, here’s a look at some basic demographics:
- 🇦🇿 Azerbaijan Population: 10.4 million
- 🇦🇲 Armenia Population: 3.0 million
- 🇬🇪 Georgia Population: 4.1 million
Home to around 20 million, the Caucasus region touches the Caspian Sea to the East and the Black Sea to the West. It is an area distinctly situated between Europe, Asia, and the Middle East, but is defined by most categorizations as Central Asian.
🇦🇿 Azerbaijan
Azerbaijan is the biggest country in the region, both in terms of land mass and population. The Nagorno-Karabakh region is located within the official borders of Azerbaijan, and is inhabited almost entirely by ethnic Armenians.
The majority of Azeris are Muslim, however, the country is considered one of the most secular Muslim countries in the world. Azerbaijani or Azeri is the most widely spoken language with more than 92% of people speaking it. Just over 1% in the country speak Russian as a first language and another 1% speak Armenian as a primary language. Perhaps, unsurprisingly, a similar percentage share defines the amount of ethnic Russians and Armenians in Azerbaijan, at 1.5% and 1.3% respectively.
🇦🇲 Armenia
Like both its neighbors, Armenia gained independence at the fall of the Soviet Union in 1991. Unlike its neighbors, however, it is entirely landlocked.
The country is a majority Christian nation, with an ethnic makeup of nearly 98% Armenians and the most widely spoken language being Armenian, according to the government. The population count has fallen since the collapse of the USSR, and has been relatively flat in more recent years.
🇬🇪 Georgia
Georgia is slightly smaller than Azerbaijan in size; the country shares a long border with Russia to its north and features a long coastline on the Black Sea.
Georgia’s population growth shares a similar story to many other former Soviet republics. While total population has decreased slightly over recent years, the growth in ethnic nationals (Georgians) has actually increased. The country is majority Christian and Georgian is the most popular language.
Where do People Live Across the Caucasus Region?
So how are these populations concentrated throughout the region? These cartograms from World Mapper, break it down by country:
Azerbaijan
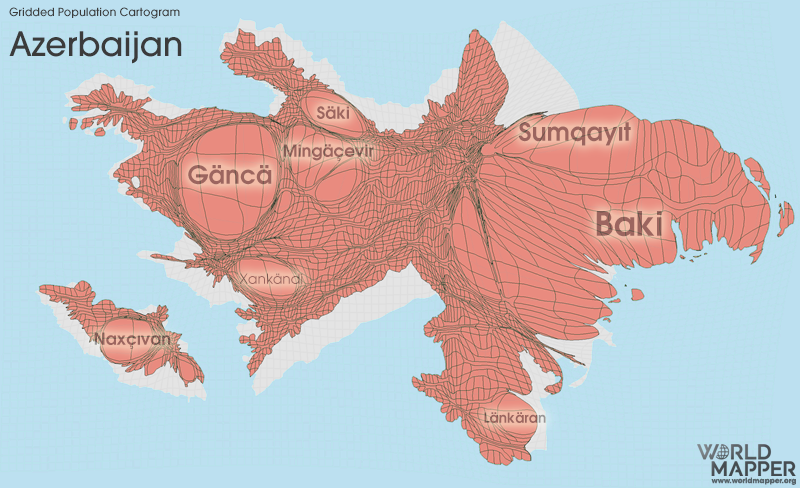
Most people live in and around the capital Baku, a port city on the Caspian Sea. However, a number of people also live inland closer to the Armenian and Georgian borders.
Armenia
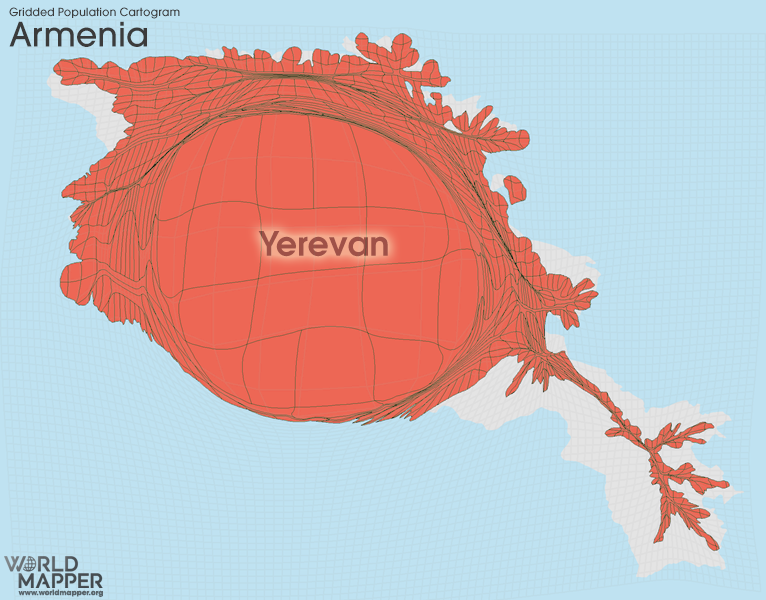
In Armenia the population heavily skews towards its capital city of Yerevan, which has a population of 1.1 million.
Georgia
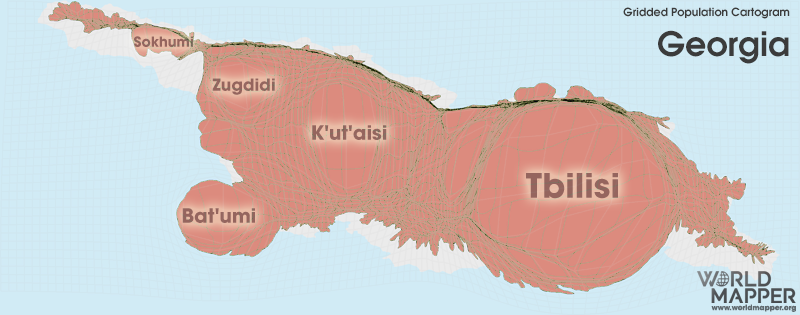
Georgia’s population distribution is slightly more even than its neighbors with a preference towards the capital Tbilisi.
The Economy of the Caucasus Region
Now let’s dive into the economic activity in the Caucasus. In some parts, the region is oil-rich with access to resources like the vast oil fields in the Caspian Sea off Azerbaijan’s coast. In fact, the Baku-Tbilisi-Ceyhan Pipeline carries nearly 1 million barrels of oil from the oilfields to Turkey every day.
Stepping back, here’s a glance at regional GDPs:
- 🇦🇿 Azerbaijan GDP: $42.6 billion
- 🇬🇪 Georgia: $15.9 billion
- 🇦🇲 Armenia GDP: $12.7 billion
Azerbaijan is the Caucasus region’s biggest economy. It is the most economically developed country of the three, having seen rapid GDP growth since its transition from a Soviet republic. At its height in the early 2000s, the national GDP was growing at yearly rates of 25%-35%. Today, its oil and gas exports are proving extremely lucrative given the European energy crisis due to the war in Ukraine. Fossil fuels make up about 95% of the country’s export revenue.
Both Armenia and Georgia’s economies are considered emerging/developing and are dependent on many different Russian imports. However, according to the European Bank for Reconstruction & Development, both economies are expected to grow 8% this year.
Georgia’s economy has been recovering from the pandemic thanks to its burgeoning tourism industry, largely drawing Russian visitors. Additionally, in both Georgia and Armenia, the inflow of Russian businesses and tech professionals have boosted the economies.
A Brief Background
The three countries which encapsulate the region, Armenia, Azerbaijan, and Georgia, were each republics under the Soviet Union until its fall in 1991. Additionally, the regions of Dagestan and Chechnya in Russia, also located in the geographic sphere of the Caucasus, each maintain a distinct identity from Russia. Both regions are majority ethnically non-Russian and still face regular violence over their power struggle with the regional heavyweight.
In fact, many of the tensions in the region can be linked to Russian oppression, according to experts.
“Russian suppression of national resistance in the Caucasus has encouraged fundamentalist movements.”
– Dr. James V. Wertsch (Caucasus Specialist, University of Washington, St. Louis)
In recent history, Russia invaded Georgia within hours of the kickoff of the 2008 Beijing Summer Olympics, sparking conflict in the Ossetia and Abkhazia regions. The Russo–Georgian War is considered the first European war of the 21st century.
While the history of the Caucasus goes way back—for instance, the kingdom of Armenia dates back to the 331 BC—more recent events have been shaped by Cold War and subsequent fallout from the dissolution of the USSR.
The Nagorno-Karabakh Conflict
The tension over the Nagorno-Karabakh region began in the late 1980s and escalated into a full-scale war into the 1990s. In the early years of the conflict, approximately 30,000 people died. Since then, ceasefires and violence have arisen intermittently—with the most recent end to the fighting in 2020. At least 243 people have been killed since then.
The conflict first began when newly independent Armenia demanded the region back from Azerbaijan, which was still a Soviet state at the time, as the population there was (and still is) mostly Armenian. Although not internationally recognized, a breakaway group has declared part of Nagorno-Karabakh as an independent state called the Republic of Artsakh.
Here’s a very brief timeline:
- 1988-1994: First Nagorno-Karabakh War
- April 2016: Four days of violence at the separation line
- September-November 2020: War was reignited until Russia negotiated a ceasefire
- September 2022: New clashes erupted resulting in hundreds of deaths
The conflict has bled out into the region—Russia is on Armenia’s side and Turkey on Azerbaijan’s. But new allies may be taking the stage as evidenced by Nancy Pelosi’s visit to Armenia in mid-September. Today, the region is divided between Azerbaijan, Armenia, and Russian peacekeepers, but is still officially Azerbaijani.
Editor’s note: A prior version of this article said that Russia’s 2008 invasion took place during the opening ceremonies of the Beijing Olympic Games. We have since adjusted this to “within hours of the kickoff” of the games, since the exact time varies according to sources.


Economy
The Bloc Effect: International Trade with Geopolitical Allies on the Rise
Rising geopolitical tensions are shaping the future of international trade, but what is the effect on trading among G7 and BRICS countries?


The Bloc Effect: International Trade with Allies on the Rise
International trade has become increasingly fragmented over the last five years as countries have shifted to trading more with their geopolitical allies.
This graphic from The Hinrich Foundation, the first in a three-part series covering the future of trade, provides visual context to the growing divide in trade in G7 and pre-expansion BRICS countries, which are used as proxies for geopolitical blocs.
Trade Shifts in G7 and BRICS Countries
This analysis uses IMF data to examine differences in shares of exports within and between trading blocs from 2018 to 2023. For example, we looked at the percentage of China’s exports with other BRICS members as well as with G7 members to see how these proportions shifted in percentage points (pp) over time.
Countries traded nearly $270 billion more with allies in 2023 compared to 2018. This shift came at the expense of trade with rival blocs, which saw a decline of $314 billion.
Country Change in Exports Within Bloc (pp) Change in Exports With Other Bloc (pp)
🇮🇳 India 0.0 3.9
🇷🇺 Russia 0.7 -3.8
🇮🇹 Italy 0.8 -0.7
🇨🇦 Canada 0.9 -0.7
🇫🇷 France 1.0 -1.1
🇪🇺 EU 1.1 -1.5
🇩🇪 Germany 1.4 -2.1
🇿🇦 South Africa 1.5 1.5
🇺🇸 U.S. 1.6 -0.4
🇯🇵 Japan 2.0 -1.7
🇨🇳 China 2.1 -5.2
🇧🇷 Brazil 3.7 -3.3
🇬🇧 UK 10.2 0.5
All shifts reported are in percentage points. For example, the EU saw its share of exports to G7 countries rise from 74.3% in 2018 to 75.4% in 2023, which equates to a 1.1 percentage point increase.
The UK saw the largest uptick in trading with other countries within the G7 (+10.2 percentage points), namely the EU, as the post-Brexit trade slump to the region recovered.
Meanwhile, the U.S.-China trade dispute caused China’s share of exports to the G7 to fall by 5.2 percentage points from 2018 to 2023, the largest decline in our sample set. In fact, partly as a result of the conflict, the U.S. has by far the highest number of harmful tariffs in place.
The Russia-Ukraine War and ensuing sanctions by the West contributed to Russia’s share of exports to the G7 falling by 3.8 percentage points over the same timeframe.
India, South Africa, and the UK bucked the trend and continued to witness advances in exports with the opposing bloc.
Average Trade Shifts of G7 and BRICS Blocs
Though results varied significantly on a country-by-country basis, the broader trend towards favoring geopolitical allies in international trade is clear.
Bloc Change in Exports Within Bloc (pp) Change in Exports With Other Bloc (pp)
Average 2.1 -1.1
BRICS 1.6 -1.4
G7 incl. EU 2.4 -1.0
Overall, BRICS countries saw a larger shift away from exports with the other bloc, while for G7 countries the shift within their own bloc was more pronounced. This implies that though BRICS countries are trading less with the G7, they are relying more on trade partners outside their bloc to make up for the lost G7 share.
A Global Shift in International Trade and Geopolitical Proximity
The movement towards strengthening trade relations based on geopolitical proximity is a global trend.
The United Nations categorizes countries along a scale of geopolitical proximity based on UN voting records.
According to the organization’s analysis, international trade between geopolitically close countries rose from the first quarter of 2022 (when Russia first invaded Ukraine) to the third quarter of 2023 by over 6%. Conversely, trade with geopolitically distant countries declined.
The second piece in this series will explore China’s gradual move away from using the U.S. dollar in trade settlements.
Visit the Hinrich Foundation to learn more about the future of geopolitical trade

-

 Economy2 days ago
Economic Growth Forecasts for G7 and BRICS Countries in 2024
The IMF has released its economic growth forecasts for 2024. How do the G7 and BRICS countries compare?
-

 United States2 weeks ago
Ranked: The Largest U.S. Corporations by Number of Employees
We visualized the top U.S. companies by employees, revealing the massive scale of retailers like Walmart, Target, and Home Depot.
-

 Economy2 weeks ago
Where U.S. Inflation Hit the Hardest in March 2024
We visualized product categories that saw the highest % increase in price due to U.S. inflation as of March 2024.
-

 Economy1 month ago
G20 Inflation Rates: Feb 2024 vs COVID Peak
We visualize inflation rates across G20 countries as of Feb 2024, in the context of their COVID-19 pandemic peak.
-

 Economy1 month ago
Mapped: Unemployment Claims by State
This visual heatmap of unemployment claims by state highlights New York, California, and Alaska leading the country by a wide margin.
-

 Economy2 months ago
Confidence in the Global Economy, by Country
Will the global economy be stronger in 2024 than in 2023?


-

 Debt1 week ago
How Debt-to-GDP Ratios Have Changed Since 2000
-

 Markets2 weeks ago
Ranked: The World’s Top Flight Routes, by Revenue
-

 Demographics2 weeks ago
Population Projections: The World’s 6 Largest Countries in 2075
-

 Markets2 weeks ago
The Top 10 States by Real GDP Growth in 2023
-

 Demographics2 weeks ago
The Smallest Gender Wage Gaps in OECD Countries
-
Economy2 weeks ago
Where U.S. Inflation Hit the Hardest in March 2024
-

 Green2 weeks ago
Top Countries By Forest Growth Since 2001
-
United States2 weeks ago
Ranked: The Largest U.S. Corporations by Number of Employees