Politics
Chart: The Fake News Problem
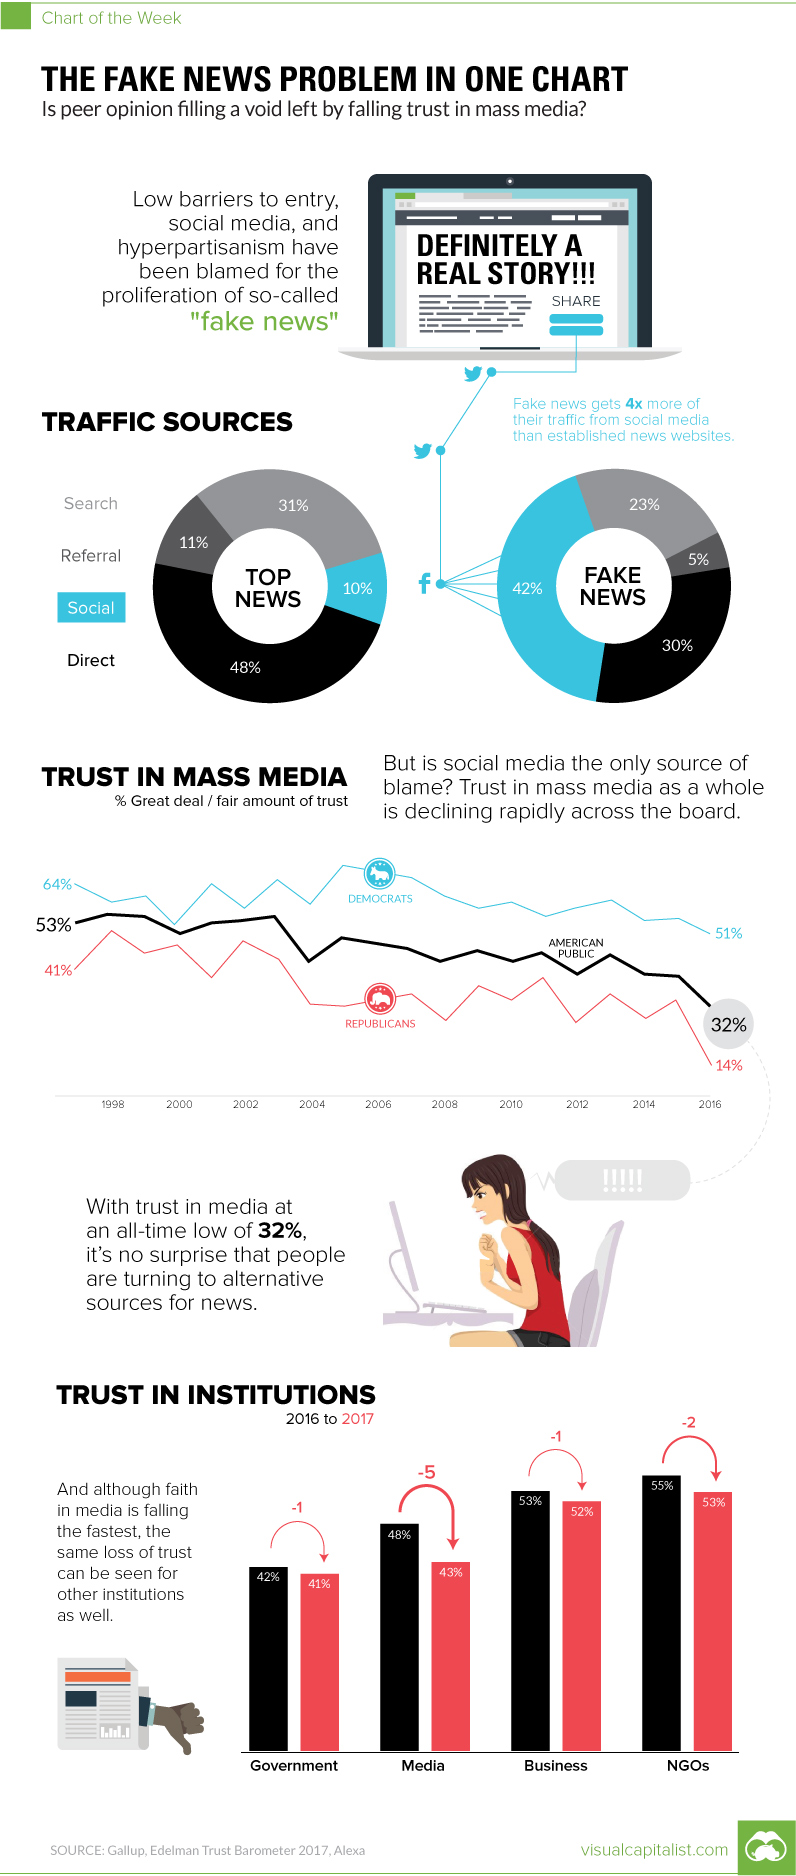
Chart: The Fake News Problem
Peer opinion fills a void left by falling trust in mass media
The Chart of the Week is a weekly Visual Capitalist feature on Fridays.
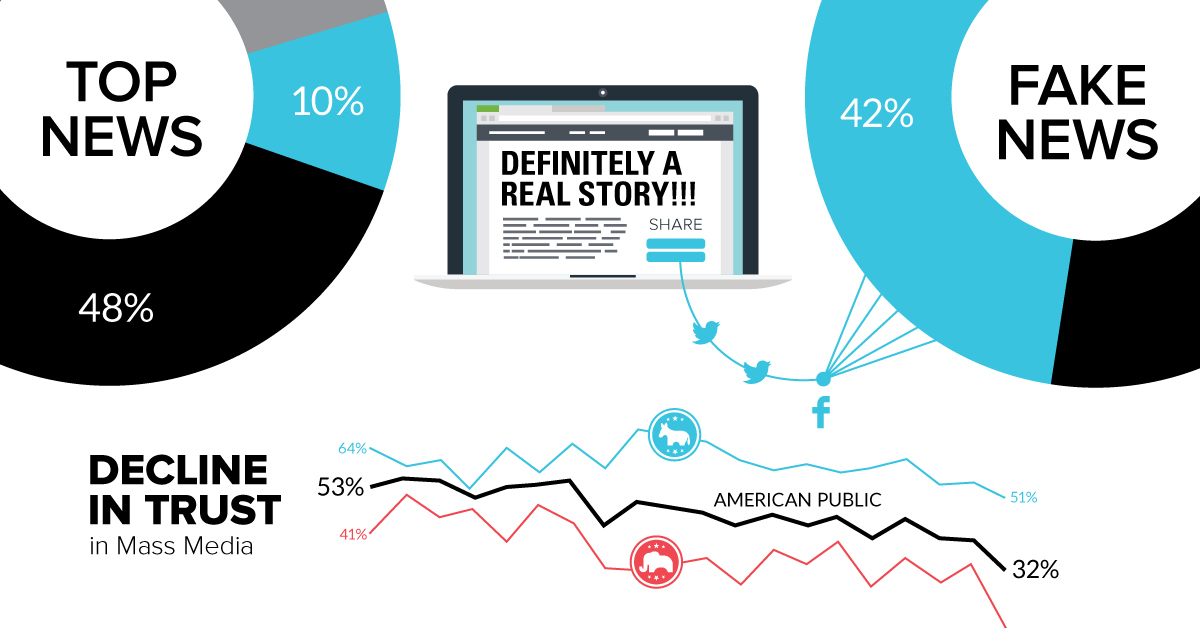
There’s been no shortage of blame passed around for the so-called “fake news” epidemic that has been front and center since the U.S. election.
Social media has been singled out as one key factor leading to the spread of misleading or false news. However, low barriers to entry for creating content, hyperpartisanism, confirmation bias, and the echo-chamber effect have also been identified as causes or symptoms in the proliferation of such stories.
It’s certainly a complex problem to unravel, and many proposed solutions are just as alarming as the symptoms they try to treat. The decentralization and fragmentation of information is the core of what makes the internet great, and this democratization helps to decouple power away from the established institutions that may or may not have our interests at heart.
How do we regulate news for its authority and legitimacy without stifling alternate viewpoints, differing narratives, and independent sources of information?
Root Causes
In today’s landscape, people are turning away from traditional media and gravitating towards digital content. In this new digital media paradigm, who is considered a trustworthy and convenient source of information?
As long as they could remain reputable, the mainstream outlets that garnered eyeballs throughout broadcasting history should have been the obvious benefactors of this transition. Groups like CNN and Fox News, or The New York Times and The Washington Post, could have remained unquestioned authorities on the issues.
However, it seems like this opportunity has been recently squandered to some extent. These outlets have been slow to adopt their business strategies to the digital landscape, and they remain in damage control mode as advertising revenues drop and profitability wanes. Publishers have been under immense pressure to generate views, and have taken shortcuts in content creation to do this. Hyperpartisan viewpoints that confirm existing biases (aka, the Huffington Post or Breitbart models) and sensational clickbait headlines have been one easy way to build traffic. Some publishers also have an itchy trigger finger, and it seems that getting a story out first has become more important than verifying its validity.
These above factors have, ironically, led to mass media as being a direct part of the “fake news” problem. The retracted stories on Russian propaganda by the Washington Post have been a lightning rod for scrutiny, and entire posts are dedicated to keeping misleading stories from established media at bay. Having a track record with zero blemishes is obviously a difficult target to hit, but the reality is that we are seeing misleading news from everywhere now: “fake news” outlets, mainstream outlets, and the White House itself.
Falling Trust in Media and Institutions
Even before “fake news” hit the mainstream, a poll by Gallup showed that Americans’ trust in mass media was hitting an all-time low. In September 2016, only 32% of people said they have a great deal or fair amount of trust in the media, which is a decline of -8% from the previous year.
A report from Edelman from January 2017 is even more damning. Trust of the media declined -5% from 2016, which is faster than trust is declining in government (-1%), business (-1%), and NGOs (-2%).
As we mentioned earlier, the rise of fake news is complex and very difficult to untangle. However, the fact is that established news outlets aren’t doing themselves any favors. If people feel like they can’t trust the Washington Post or other such sources, then it should be no surprise that they are turning to the power of “word of mouth” from their peers more often – no matter how fallible this might be.


Economy
The Bloc Effect: International Trade with Geopolitical Allies on the Rise
Rising geopolitical tensions are shaping the future of international trade, but what is the effect on trading among G7 and BRICS countries?


The Bloc Effect: International Trade with Allies on the Rise
International trade has become increasingly fragmented over the last five years as countries have shifted to trading more with their geopolitical allies.
This graphic from The Hinrich Foundation, the first in a three-part series covering the future of trade, provides visual context to the growing divide in trade in G7 and pre-expansion BRICS countries, which are used as proxies for geopolitical blocs.
Trade Shifts in G7 and BRICS Countries
This analysis uses IMF data to examine differences in shares of exports within and between trading blocs from 2018 to 2023. For example, we looked at the percentage of China’s exports with other BRICS members as well as with G7 members to see how these proportions shifted in percentage points (pp) over time.
Countries traded nearly $270 billion more with allies in 2023 compared to 2018. This shift came at the expense of trade with rival blocs, which saw a decline of $314 billion.
Country Change in Exports Within Bloc (pp) Change in Exports With Other Bloc (pp)
🇮🇳 India 0.0 3.9
🇷🇺 Russia 0.7 -3.8
🇮🇹 Italy 0.8 -0.7
🇨🇦 Canada 0.9 -0.7
🇫🇷 France 1.0 -1.1
🇪🇺 EU 1.1 -1.5
🇩🇪 Germany 1.4 -2.1
🇿🇦 South Africa 1.5 1.5
🇺🇸 U.S. 1.6 -0.4
🇯🇵 Japan 2.0 -1.7
🇨🇳 China 2.1 -5.2
🇧🇷 Brazil 3.7 -3.3
🇬🇧 UK 10.2 0.5
All shifts reported are in percentage points. For example, the EU saw its share of exports to G7 countries rise from 74.3% in 2018 to 75.4% in 2023, which equates to a 1.1 percentage point increase.
The UK saw the largest uptick in trading with other countries within the G7 (+10.2 percentage points), namely the EU, as the post-Brexit trade slump to the region recovered.
Meanwhile, the U.S.-China trade dispute caused China’s share of exports to the G7 to fall by 5.2 percentage points from 2018 to 2023, the largest decline in our sample set. In fact, partly as a result of the conflict, the U.S. has by far the highest number of harmful tariffs in place.
The Russia-Ukraine War and ensuing sanctions by the West contributed to Russia’s share of exports to the G7 falling by 3.8 percentage points over the same timeframe.
India, South Africa, and the UK bucked the trend and continued to witness advances in exports with the opposing bloc.
Average Trade Shifts of G7 and BRICS Blocs
Though results varied significantly on a country-by-country basis, the broader trend towards favoring geopolitical allies in international trade is clear.
Bloc Change in Exports Within Bloc (pp) Change in Exports With Other Bloc (pp)
Average 2.1 -1.1
BRICS 1.6 -1.4
G7 incl. EU 2.4 -1.0
Overall, BRICS countries saw a larger shift away from exports with the other bloc, while for G7 countries the shift within their own bloc was more pronounced. This implies that though BRICS countries are trading less with the G7, they are relying more on trade partners outside their bloc to make up for the lost G7 share.
A Global Shift in International Trade and Geopolitical Proximity
The movement towards strengthening trade relations based on geopolitical proximity is a global trend.
The United Nations categorizes countries along a scale of geopolitical proximity based on UN voting records.
According to the organization’s analysis, international trade between geopolitically close countries rose from the first quarter of 2022 (when Russia first invaded Ukraine) to the third quarter of 2023 by over 6%. Conversely, trade with geopolitically distant countries declined.
The second piece in this series will explore China’s gradual move away from using the U.S. dollar in trade settlements.
Visit the Hinrich Foundation to learn more about the future of geopolitical trade

-

 Economy2 days ago
Economic Growth Forecasts for G7 and BRICS Countries in 2024
The IMF has released its economic growth forecasts for 2024. How do the G7 and BRICS countries compare?
-

 United States2 weeks ago
Ranked: The Largest U.S. Corporations by Number of Employees
We visualized the top U.S. companies by employees, revealing the massive scale of retailers like Walmart, Target, and Home Depot.
-

 Economy2 weeks ago
Where U.S. Inflation Hit the Hardest in March 2024
We visualized product categories that saw the highest % increase in price due to U.S. inflation as of March 2024.
-

 Economy1 month ago
G20 Inflation Rates: Feb 2024 vs COVID Peak
We visualize inflation rates across G20 countries as of Feb 2024, in the context of their COVID-19 pandemic peak.
-

 Economy1 month ago
Mapped: Unemployment Claims by State
This visual heatmap of unemployment claims by state highlights New York, California, and Alaska leading the country by a wide margin.
-

 Economy2 months ago
Confidence in the Global Economy, by Country
Will the global economy be stronger in 2024 than in 2023?


-

 Debt1 week ago
How Debt-to-GDP Ratios Have Changed Since 2000
-

 Markets2 weeks ago
Ranked: The World’s Top Flight Routes, by Revenue
-

 Demographics2 weeks ago
Population Projections: The World’s 6 Largest Countries in 2075
-

 Markets2 weeks ago
The Top 10 States by Real GDP Growth in 2023
-

 Demographics2 weeks ago
The Smallest Gender Wage Gaps in OECD Countries
-
Economy2 weeks ago
Where U.S. Inflation Hit the Hardest in March 2024
-

 Green2 weeks ago
Top Countries By Forest Growth Since 2001
-
United States2 weeks ago
Ranked: The Largest U.S. Corporations by Number of Employees