Technology
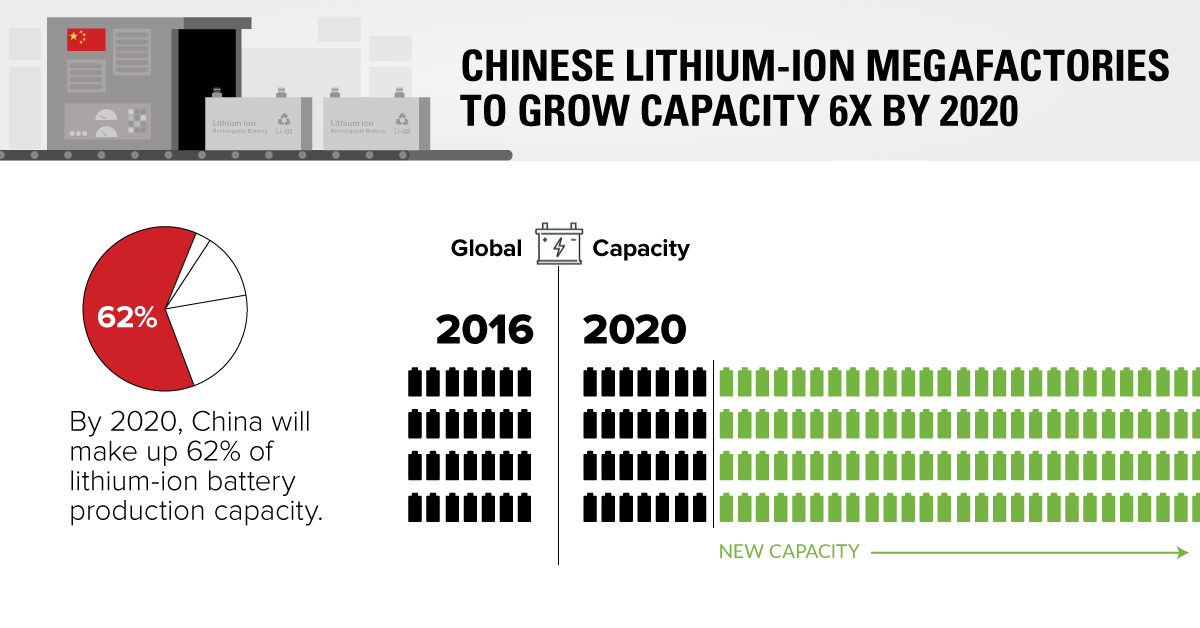
China Leading the Charge for Lithium-Ion Megafactories
China Leading the Charge for Lithium-Ion Megafactories
The Chart of the Week is a weekly Visual Capitalist feature on Fridays.
Tesla’s Gigafactory 1 has been a center of attention for people interested in the growing momentum behind green energy, electric cars, and battery production. Therefore, it is no surprise that this facility was in the news again last month, with Tesla starting to mass produce batteries as it ramps up to its goal of 35GWh of capacity and beyond.
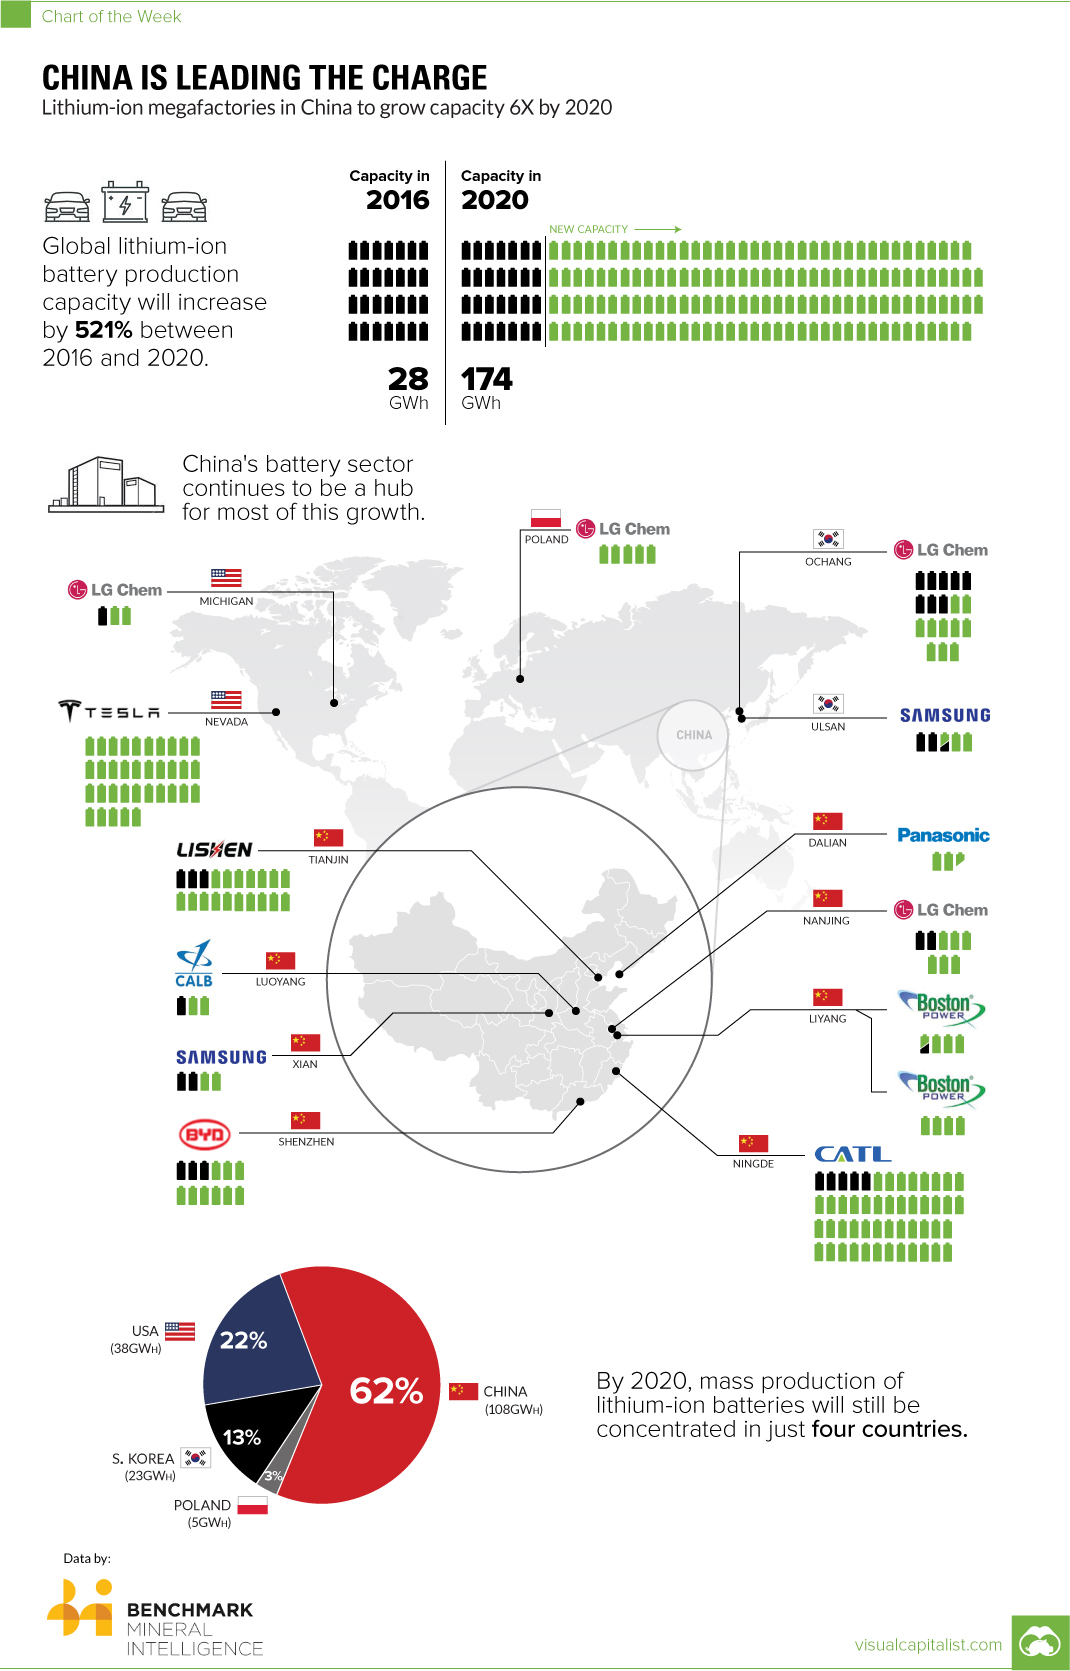
However, as exciting as this project is, it’s actually just one of multiple large-scale “megafactories” being built – with many of them being in China.
China Leading the Charge
We talked to Simon Moores, Managing Director at Benchmark Mineral Intelligence, who explained that Tesla isn’t alone or unique in its ambitions to build lithium-ion batteries at scale:
While the Tesla Gigafactory is vitally important from an EV vertical integration perspective, the majority of new lithium-ion battery capacity is being built in China. Some of these plants are expected to be huge such as the CATL facility at 50GWh – there is little doubt that China’s lithium-ion industry has come of age.
Contemporary Amperex Technology Ltd (CATL) has plans to build the largest lithium-ion megafactory of all – but the company is little known in North America. It’s already worth $11.5 billion, and could be a dominant force globally in the battery sector if it successfully increases its lithium-ion production capacity six-fold to 50GWh by the year 2020.
Other Chinese manufacturers are on a similar trajectory. Panasonic, LG Chem, and Boston Power are building new megafactory plants in China, while companies such as Samsung and BYD are expanding existing ones. All lithium-ion plants in China currently have a capacity of 16.4GWh – but by 2020, they will combine for a total of 107.5GWh.
Capacity by Country
This ramp up in China means that the country will have 62% of the world’s lithium-ion battery production capacity by 2020.
There are only three other players in the megafactory game: United States, South Korea, and Poland.
| 2016 Capacity (GWh) | 2020 Capacity (GWh) | % of Global Total (2020) | |
|---|---|---|---|
| United States | 1.0 | 38.0 | 22% |
| China | 16.4 | 107.5 | 62% |
| Korea | 10.5 | 23.0 | 13% |
| Poland | 0.0 | 5.0 | 3% |
| Total | 27.9 | 173.5 | 100% |
Above estimates on battery capacity courtesy of Benchmark Mineral Intelligence.


Technology
Visualizing AI Patents by Country
See which countries have been granted the most AI patents each year, from 2012 to 2022.


Visualizing AI Patents by Country
This was originally posted on our Voronoi app. Download the app for free on iOS or Android and discover incredible data-driven charts from a variety of trusted sources.
This infographic shows the number of AI-related patents granted each year from 2010 to 2022 (latest data available). These figures come from the Center for Security and Emerging Technology (CSET), accessed via Stanford University’s 2024 AI Index Report.
From this data, we can see that China first overtook the U.S. in 2013. Since then, the country has seen enormous growth in the number of AI patents granted each year.
| Year | China | EU and UK | U.S. | RoW | Global Total |
|---|---|---|---|---|---|
| 2010 | 307 | 137 | 984 | 571 | 1,999 |
| 2011 | 516 | 129 | 980 | 581 | 2,206 |
| 2012 | 926 | 112 | 950 | 660 | 2,648 |
| 2013 | 1,035 | 91 | 970 | 627 | 2,723 |
| 2014 | 1,278 | 97 | 1,078 | 667 | 3,120 |
| 2015 | 1,721 | 110 | 1,135 | 539 | 3,505 |
| 2016 | 1,621 | 128 | 1,298 | 714 | 3,761 |
| 2017 | 2,428 | 144 | 1,489 | 1,075 | 5,136 |
| 2018 | 4,741 | 155 | 1,674 | 1,574 | 8,144 |
| 2019 | 9,530 | 322 | 3,211 | 2,720 | 15,783 |
| 2020 | 13,071 | 406 | 5,441 | 4,455 | 23,373 |
| 2021 | 21,907 | 623 | 8,219 | 7,519 | 38,268 |
| 2022 | 35,315 | 1,173 | 12,077 | 13,699 | 62,264 |
In 2022, China was granted more patents than every other country combined.
While this suggests that the country is very active in researching the field of artificial intelligence, it doesn’t necessarily mean that China is the farthest in terms of capability.
Key Facts About AI Patents
According to CSET, AI patents relate to mathematical relationships and algorithms, which are considered abstract ideas under patent law. They can also have different meaning, depending on where they are filed.
In the U.S., AI patenting is concentrated amongst large companies including IBM, Microsoft, and Google. On the other hand, AI patenting in China is more distributed across government organizations, universities, and tech firms (e.g. Tencent).
In terms of focus area, China’s patents are typically related to computer vision, a field of AI that enables computers and systems to interpret visual data and inputs. Meanwhile America’s efforts are more evenly distributed across research fields.
Learn More About AI From Visual Capitalist
If you want to see more data visualizations on artificial intelligence, check out this graphic that shows which job departments will be impacted by AI the most.

-

 Markets1 week ago
U.S. Debt Interest Payments Reach $1 Trillion
-

 Business2 weeks ago
Charted: Big Four Market Share by S&P 500 Audits
-

 Real Estate2 weeks ago
Ranked: The Most Valuable Housing Markets in America
-

 Money2 weeks ago
Which States Have the Highest Minimum Wage in America?
-

 AI2 weeks ago
Ranked: Semiconductor Companies by Industry Revenue Share
-

 Markets2 weeks ago
Ranked: The World’s Top Flight Routes, by Revenue
-

 Demographics2 weeks ago
Population Projections: The World’s 6 Largest Countries in 2075
-

 Markets2 weeks ago
The Top 10 States by Real GDP Growth in 2023