Markets
Chart: The Slow Death of Traditional Media
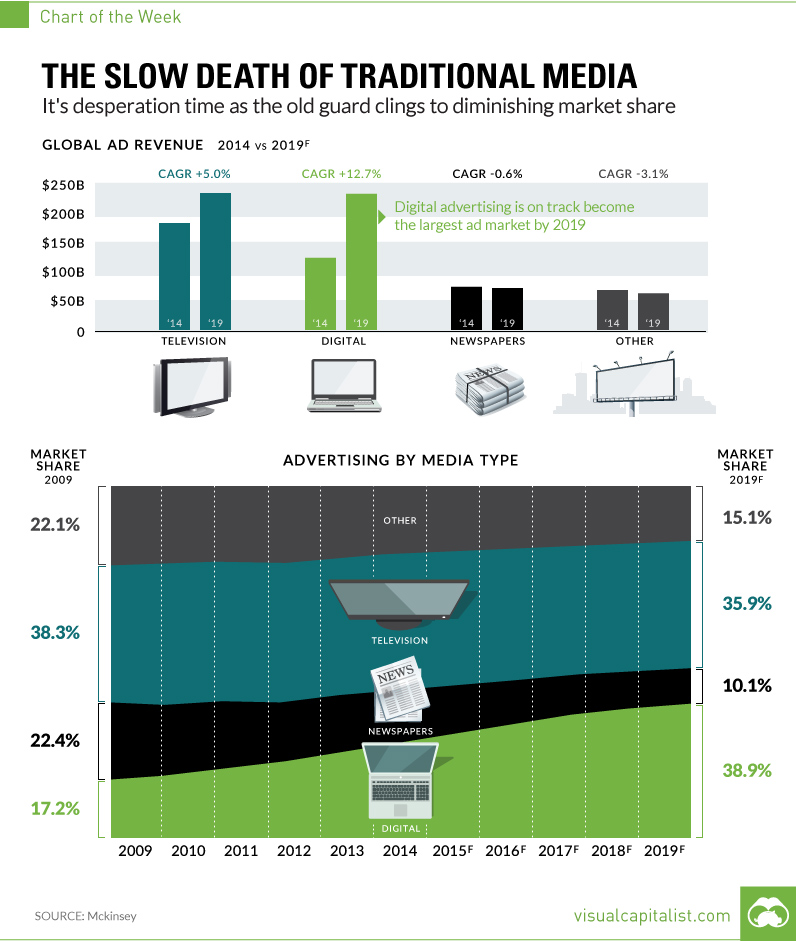
The Slow Death of Traditional Media
Desperation time as old guard clings to falling market share
The Chart of the Week is a weekly Visual Capitalist feature on Fridays.
Bill Gates once famously said that we systematically overestimate the change that will occur in two years, while underestimating the change that will come in the next ten.
The ongoing conversation about the death of legacy media definitely fits that mold.
Over the last five to ten years, people have been talking about how the newspaper, magazine, or radio station would become all but obsolete. And while certainly things have changed in all of these industries, it’s clear that there has not been a full paradigm shift yet.
Here is the evidence that we have finally reached that inflection point.
Fixing the Plane
In a recent interview at the City University of New York’s journalism school, Ken Lerer described the challenges of traditional media as follows:
You have to fix the plane while you’re flying it.
Lerer, a co-founder of the Huffington Post and currently the Chairman for Buzzfeed, is alluding to the fact that legacy media has to maintain old business models based on subscription and print ad revenue, while successfully venturing into the digital world. The latter category is already hard enough, even without taking into account the balancing act of the former.
The moral of the story? Some of these “planes” are going to land safely, but most of them are going to crash and burn.
The cost structure of legacy media just doesn’t make sense in today’s digital world. Overhead is high, and revenue is harder to find due to the limited success of paywalls, rampant ad blocking, and the steady fall in display ad prices due to the emergence of programmatic bidding.
Legacy Revenues
Why has legacy media been so slow to adopt change? Why don’t they just lay off half of their staff, ditch print operations, and start from scratch?
It’s because their major revenue sources are as slow at adopting as they are.
In 2015, there was only one age demographic with more than half of its constituents reading a daily newspaper, and that was “65 years old and up”:
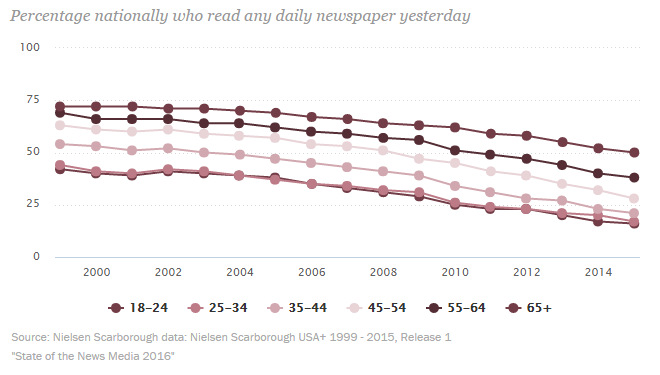
That said, the people that still read newspapers are among the wealthiest people in the country. Warren Buffett, for example, reads five a day. But even he does not know how to save the print industry from its woes.
Meanwhile, Madison Avenue has been notoriously slow at evolving to meet the needs of the digital revolution. If the biggest advertisers are still demanding the status quo, it makes it very difficult to “fix the plane”.
New Models
The most noticeable signal of change, however, is the relative success of new media companies such as Vice, Buzzfeed, and Vox – and the fact that some of their largest backers are from the old guard.
All of the above companies are “unicorns” valued at $1 billion or more by private investors, which include venture capital stalwarts such as Andreessen Horowitz, Accel Partners, Khosla Ventures, RRE Ventures, or Lerer Hippeau.
More importantly, however, they’ve also posted strategic investments from legacy media companies that are trying to wisely hedge their bets. Some of these include NBC Universal, The Walt Disney Company, 21st Century Fox, and Hearst.
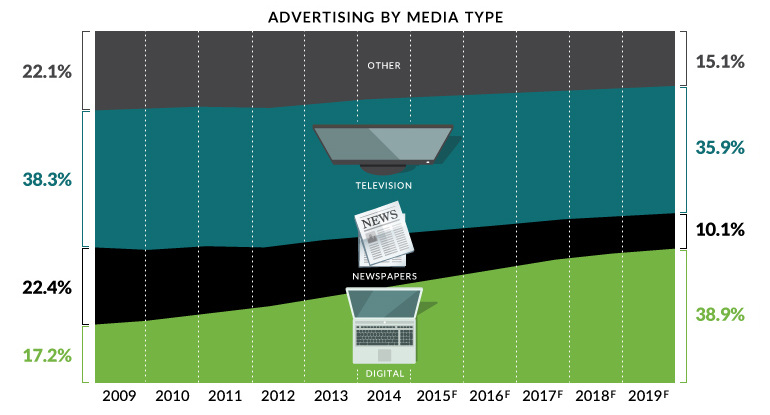
Digital will become the largest channel for ad revenue globally by 2019 – investors and companies that believe in the media business should position themselves accordingly.


Markets
The European Stock Market: Attractive Valuations Offer Opportunities
On average, the European stock market has valuations that are nearly 50% lower than U.S. valuations. But how can you access the market?


European Stock Market: Attractive Valuations Offer Opportunities
Europe is known for some established brands, from L’Oréal to Louis Vuitton. However, the European stock market offers additional opportunities that may be lesser known.
The above infographic, sponsored by STOXX, outlines why investors may want to consider European stocks.
Attractive Valuations
Compared to most North American and Asian markets, European stocks offer lower or comparable valuations.
| Index | Price-to-Earnings Ratio | Price-to-Book Ratio |
|---|---|---|
| EURO STOXX 50 | 14.9 | 2.2 |
| STOXX Europe 600 | 14.4 | 2 |
| U.S. | 25.9 | 4.7 |
| Canada | 16.1 | 1.8 |
| Japan | 15.4 | 1.6 |
| Asia Pacific ex. China | 17.1 | 1.8 |
Data as of February 29, 2024. See graphic for full index names. Ratios based on trailing 12 month financials. The price to earnings ratio excludes companies with negative earnings.
On average, European valuations are nearly 50% lower than U.S. valuations, potentially offering an affordable entry point for investors.
Research also shows that lower price ratios have historically led to higher long-term returns.
Market Movements Not Closely Connected
Over the last decade, the European stock market had low-to-moderate correlation with North American and Asian equities.
The below chart shows correlations from February 2014 to February 2024. A value closer to zero indicates low correlation, while a value of one would indicate that two regions are moving in perfect unison.
| EURO STOXX 50 | STOXX EUROPE 600 | U.S. | Canada | Japan | Asia Pacific ex. China |
|
|---|---|---|---|---|---|---|
| EURO STOXX 50 | 1.00 | 0.97 | 0.55 | 0.67 | 0.24 | 0.43 |
| STOXX EUROPE 600 | 1.00 | 0.56 | 0.71 | 0.28 | 0.48 | |
| U.S. | 1.00 | 0.73 | 0.12 | 0.25 | ||
| Canada | 1.00 | 0.22 | 0.40 | |||
| Japan | 1.00 | 0.88 | ||||
| Asia Pacific ex. China | 1.00 |
Data is based on daily USD returns.
European equities had relatively independent market movements from North American and Asian markets. One contributing factor could be the differing sector weights in each market. For instance, technology makes up a quarter of the U.S. market, but health care and industrials dominate the broader European market.
Ultimately, European equities can enhance portfolio diversification and have the potential to mitigate risk for investors.
Tracking the Market
For investors interested in European equities, STOXX offers a variety of flagship indices:
| Index | Description | Market Cap |
|---|---|---|
| STOXX Europe 600 | Pan-regional, broad market | €10.5T |
| STOXX Developed Europe | Pan-regional, broad-market | €9.9T |
| STOXX Europe 600 ESG-X | Pan-regional, broad market, sustainability focus | €9.7T |
| STOXX Europe 50 | Pan-regional, blue-chip | €5.1T |
| EURO STOXX 50 | Eurozone, blue-chip | €3.5T |
Data is as of February 29, 2024. Market cap is free float, which represents the shares that are readily available for public trading on stock exchanges.
The EURO STOXX 50 tracks the Eurozone’s biggest and most traded companies. It also underlies one of the world’s largest ranges of ETFs and mutual funds. As of November 2023, there were €27.3 billion in ETFs and €23.5B in mutual fund assets under management tracking the index.
“For the past 25 years, the EURO STOXX 50 has served as an accurate, reliable and tradable representation of the Eurozone equity market.”
— Axel Lomholt, General Manager at STOXX
Partnering with STOXX to Track the European Stock Market
Are you interested in European equities? STOXX can be a valuable partner:
- Comprehensive, liquid and investable ecosystem
- European heritage, global reach
- Highly sophisticated customization capabilities
- Open architecture approach to using data
- Close partnerships with clients
- Part of ISS STOXX and Deutsche Börse Group
With a full suite of indices, STOXX can help you benchmark against the European stock market.
Learn how STOXX’s European indices offer liquid and effective market access.

-

 Economy3 days ago
Economic Growth Forecasts for G7 and BRICS Countries in 2024
The IMF has released its economic growth forecasts for 2024. How do the G7 and BRICS countries compare?
-

 Markets2 weeks ago
U.S. Debt Interest Payments Reach $1 Trillion
U.S. debt interest payments have surged past the $1 trillion dollar mark, amid high interest rates and an ever-expanding debt burden.
-

 United States2 weeks ago
Ranked: The Largest U.S. Corporations by Number of Employees
We visualized the top U.S. companies by employees, revealing the massive scale of retailers like Walmart, Target, and Home Depot.
-

 Markets2 weeks ago
The Top 10 States by Real GDP Growth in 2023
This graphic shows the states with the highest real GDP growth rate in 2023, largely propelled by the oil and gas boom.
-

 Markets3 weeks ago
Ranked: The World’s Top Flight Routes, by Revenue
In this graphic, we show the highest earning flight routes globally as air travel continued to rebound in 2023.
-

 Markets3 weeks ago
Ranked: The Most Valuable Housing Markets in America
The U.S. residential real estate market is worth a staggering $47.5 trillion. Here are the most valuable housing markets in the country.


-

 Science1 week ago
Visualizing the Average Lifespans of Mammals
-

 Demographics2 weeks ago
The Smallest Gender Wage Gaps in OECD Countries
-

 United States2 weeks ago
Where U.S. Inflation Hit the Hardest in March 2024
-

 Green2 weeks ago
Top Countries By Forest Growth Since 2001
-
United States2 weeks ago
Ranked: The Largest U.S. Corporations by Number of Employees
-

 Maps2 weeks ago
The Largest Earthquakes in the New York Area (1970-2024)
-

 Green2 weeks ago
Ranked: The Countries With the Most Air Pollution in 2023
-

 Green2 weeks ago
Ranking the Top 15 Countries by Carbon Tax Revenue