Technology
The Times They Are A-Changin’
The Times They Are A-Changin’
The Numbers Behind the New York Times’ digital transition
The Chart of the Week is a weekly Visual Capitalist feature on Fridays.
For the most part, legacy print media stalwarts are dying a death by a thousand cuts.
There are exceptions to this rule, and The New York Times is often touted as the best example of an old-school media company that is successfully navigating the challenging transition to digital. They’ve experimented with different types of content and tactics to get eyeballs, while also shifting their company-wide strategy and culture to take a digital-first approach.
While pundits give credit to the Times for their latest efforts, this doesn’t mean it’s been an easy transition for the iconic newspaper. The path forward has been littered with roadbumps, and the most recent one is hard to ignore for shareholders.
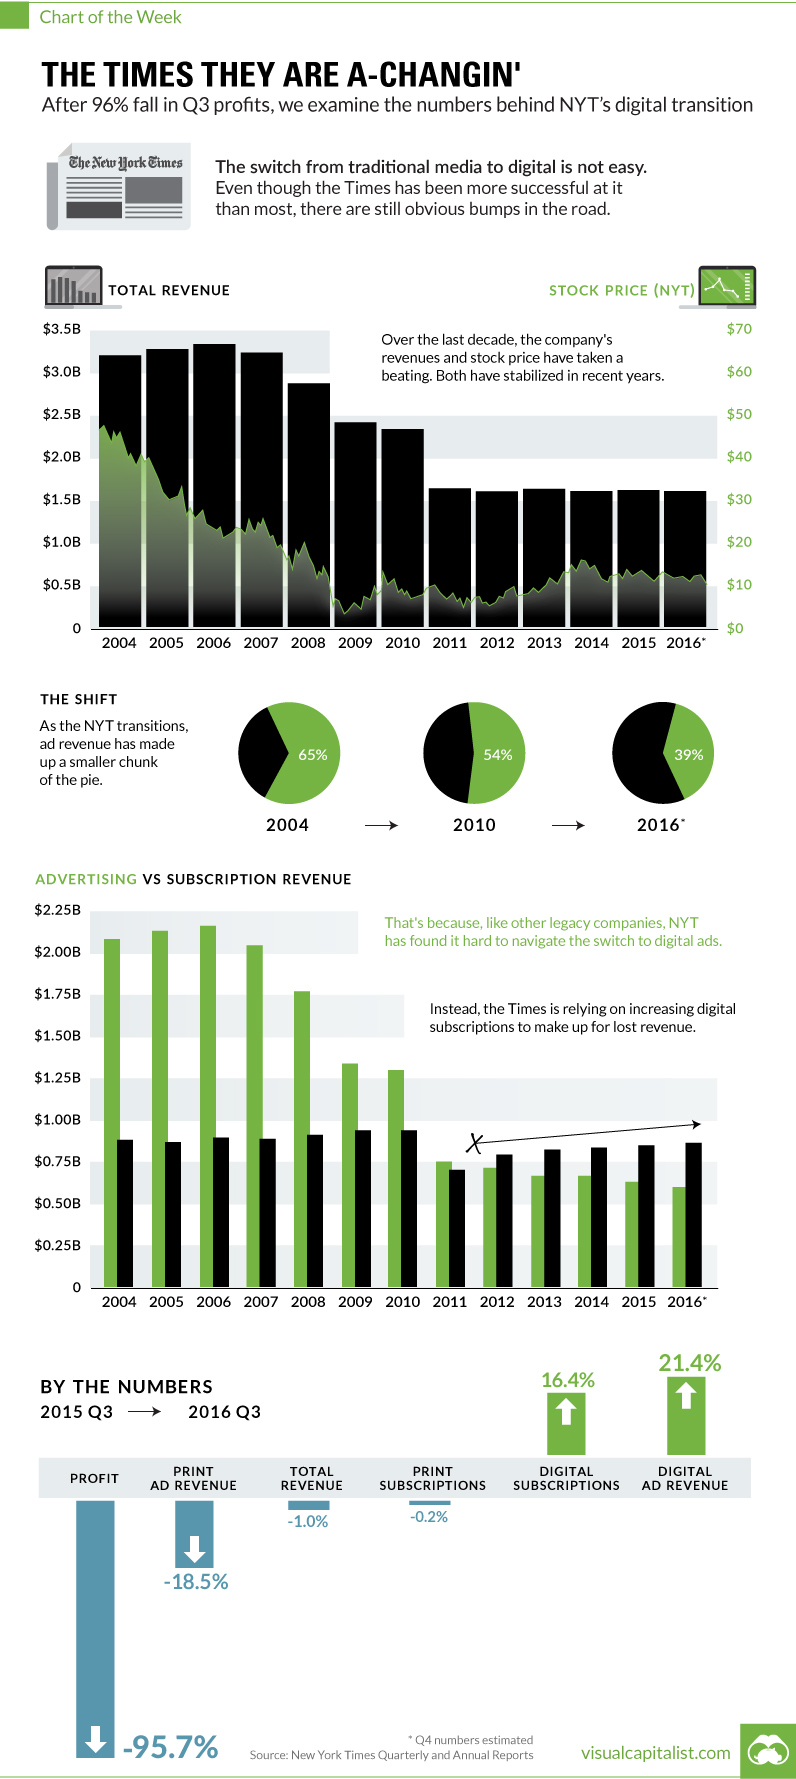
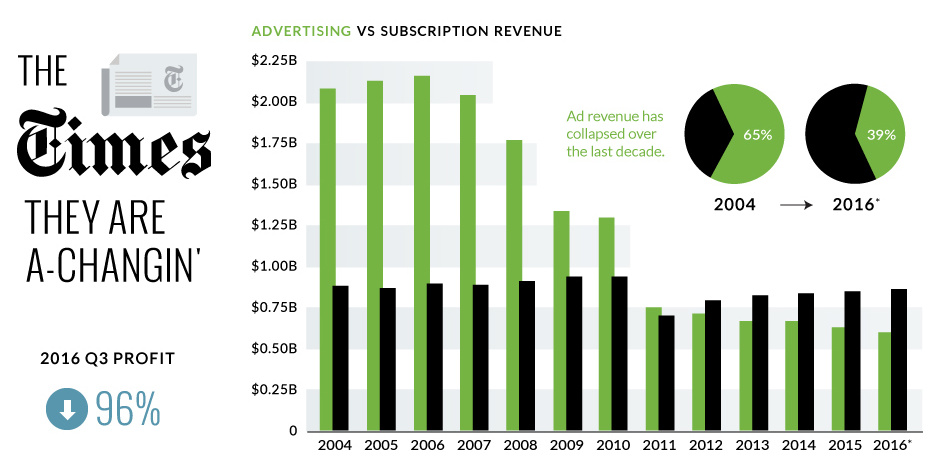
Earlier this week, The New York Times announced a 95.7% decrease in quarterly profit. We dug a little deeper in this week’s chart to provide some context behind the newspaper’s challenges in maintaining its relevance in the 21st century.
Goodbye, Ad Dollars
The primary challenge faced by the Times is pretty obvious.
In the early 2000s, the company easily made over $2 billion in advertising revenue per year. Today, they make about $600 million from ads.
Why has the transition to digital hurt ad revenues so much? There are a bunch of reasons, but here’s a few of them:
- Physical circulation of The New York Times and other newspapers is dropping rapidly.
- Traditional display ads aren’t particularly effective, and are part of the “old-school” of digital thought.
- Programmatic bidding drives down prices for these ads, bringing in even less revenue.
- Digital lends itself to long-term, results-driven campaigns. It takes time to set these up and measure them properly, especially at scale.
- Ads need to match the editorial stream to be effective. Quality over quantity.
- There’s more competition in the digital space, which is a stark contrast to the distribution oligopolies enjoyed by big newspapers in the legacy era.
- Madison Avenue is also slow at switching to digital, which only adds to the lag time.
These are just some of the reasons why advertising was able to make up 65% of the Times’ revenues in 2004, but only 39% in 2016.
Hello, Digital Subscriptions
While I don’t personally agree that a paywall is a long-term answer to any of their problems, it is true that the New York Times has used this as a temporary crutch to at least counter lost ad dollars.
In Q3 2016, revenue from digital-only subscriptions increased 16.4%, and money coming in from subscriptions has increased year-on-year since 2011.
Sometime between 2011 and 2012, subscription revenue (powered by digital-only subscriptions) passed ad revenues as the most important source of incoming cash for the company. The ramp-up has been impressive, and The New York Times now has 1.6 million digital subscribers.
My personal take? Digital subscriptions will plateau in the next five years or maybe sooner. Further, I think that content that isn’t industry or niche-specific will generally drift towards being free for users over time. The New York Times will have to solve their ad problem, but the paywall will buy them a bit of time to do so.


Technology
Visualizing AI Patents by Country
See which countries have been granted the most AI patents each year, from 2012 to 2022.


Visualizing AI Patents by Country
This was originally posted on our Voronoi app. Download the app for free on iOS or Android and discover incredible data-driven charts from a variety of trusted sources.
This infographic shows the number of AI-related patents granted each year from 2010 to 2022 (latest data available). These figures come from the Center for Security and Emerging Technology (CSET), accessed via Stanford University’s 2024 AI Index Report.
From this data, we can see that China first overtook the U.S. in 2013. Since then, the country has seen enormous growth in the number of AI patents granted each year.
| Year | China | EU and UK | U.S. | RoW | Global Total |
|---|---|---|---|---|---|
| 2010 | 307 | 137 | 984 | 571 | 1,999 |
| 2011 | 516 | 129 | 980 | 581 | 2,206 |
| 2012 | 926 | 112 | 950 | 660 | 2,648 |
| 2013 | 1,035 | 91 | 970 | 627 | 2,723 |
| 2014 | 1,278 | 97 | 1,078 | 667 | 3,120 |
| 2015 | 1,721 | 110 | 1,135 | 539 | 3,505 |
| 2016 | 1,621 | 128 | 1,298 | 714 | 3,761 |
| 2017 | 2,428 | 144 | 1,489 | 1,075 | 5,136 |
| 2018 | 4,741 | 155 | 1,674 | 1,574 | 8,144 |
| 2019 | 9,530 | 322 | 3,211 | 2,720 | 15,783 |
| 2020 | 13,071 | 406 | 5,441 | 4,455 | 23,373 |
| 2021 | 21,907 | 623 | 8,219 | 7,519 | 38,268 |
| 2022 | 35,315 | 1,173 | 12,077 | 13,699 | 62,264 |
In 2022, China was granted more patents than every other country combined.
While this suggests that the country is very active in researching the field of artificial intelligence, it doesn’t necessarily mean that China is the farthest in terms of capability.
Key Facts About AI Patents
According to CSET, AI patents relate to mathematical relationships and algorithms, which are considered abstract ideas under patent law. They can also have different meaning, depending on where they are filed.
In the U.S., AI patenting is concentrated amongst large companies including IBM, Microsoft, and Google. On the other hand, AI patenting in China is more distributed across government organizations, universities, and tech firms (e.g. Tencent).
In terms of focus area, China’s patents are typically related to computer vision, a field of AI that enables computers and systems to interpret visual data and inputs. Meanwhile America’s efforts are more evenly distributed across research fields.
Learn More About AI From Visual Capitalist
If you want to see more data visualizations on artificial intelligence, check out this graphic that shows which job departments will be impacted by AI the most.

-

 Markets1 week ago
U.S. Debt Interest Payments Reach $1 Trillion
-

 Markets2 weeks ago
Ranked: The Most Valuable Housing Markets in America
-

 Money2 weeks ago
Which States Have the Highest Minimum Wage in America?
-

 AI2 weeks ago
Ranked: Semiconductor Companies by Industry Revenue Share
-

 Markets2 weeks ago
Ranked: The World’s Top Flight Routes, by Revenue
-

 Countries2 weeks ago
Population Projections: The World’s 6 Largest Countries in 2075
-

 Markets2 weeks ago
The Top 10 States by Real GDP Growth in 2023
-

 Money2 weeks ago
The Smallest Gender Wage Gaps in OECD Countries