Politics
This is How Much NATO Countries Spend on Defense


This Is How Much NATO Countries Spend on Defense
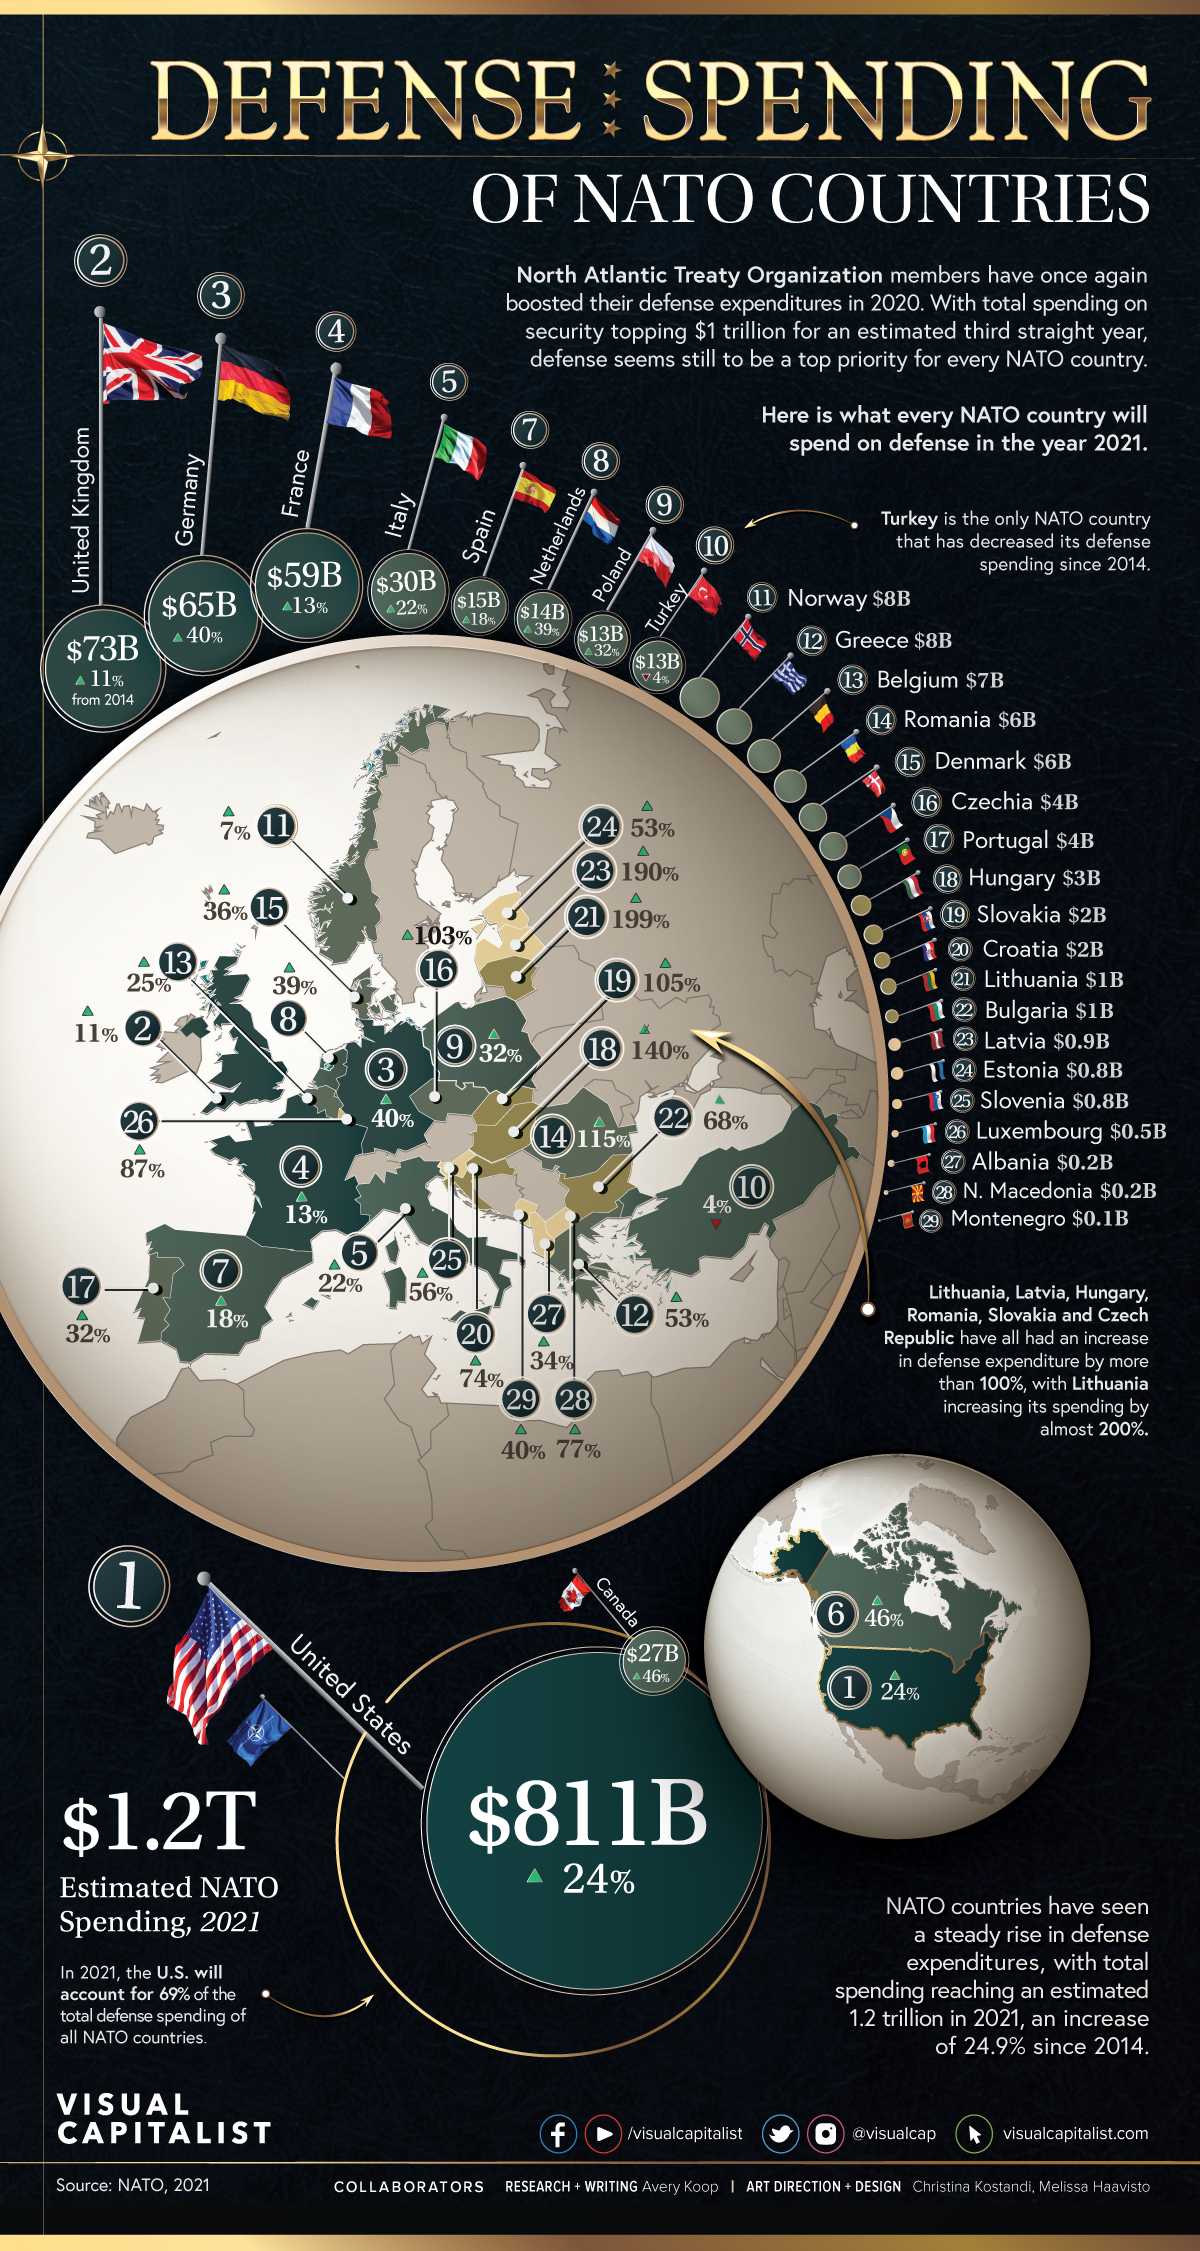
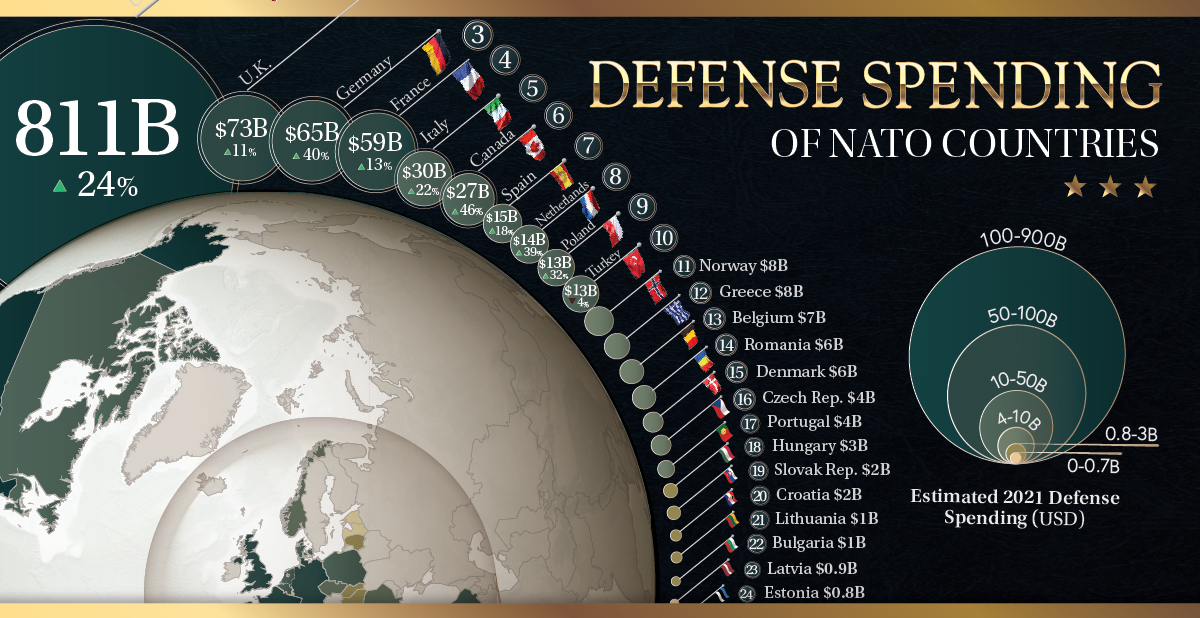
The North Atlantic Treaty Organization (NATO) exists for the sole purpose of facilitating a political and military alliance between almost 30 countries. All are obligated to one another in times of war, but some countries have much stronger militaries and defense systems than others.
Using data from NATO, this map reveals what each NATO member country spends on its own national defense.
Note: Numbers are 2021 projections.
Biggest NATO Defense Spenders
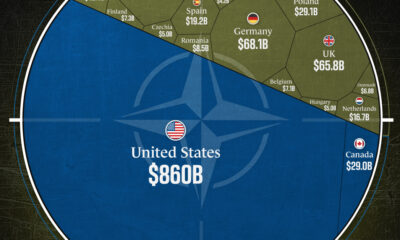
The U.S. spends more on defense than any other NATO country.
According to the 2021 estimates, U.S. defense spending will be close to $811 billion this year. On the other hand, the defense spending of all other NATO countries combined is projected to be $363 billion, meaning the U.S. will outspend all other countries by a whopping $448 billion.
| Rank | Country | Millions (USD) 2021p | Change (2014-2021) |
|---|---|---|---|
| #1 | 🇺🇸 United States | $811,140 | 24.0% |
| #2 | 🇬🇧 United Kingdom | $72,765 | 10.8% |
| #3 | 🇩🇪 Germany | $64,785 | 40.3% |
| #4 | 🇫🇷 France | $58,729 | 12.9% |
| #5 | 🇮🇹 Italy | $29,763 | 21.5% |
| #6 | 🇨🇦 Canada | $26,523 | 46.0% |
| #7 | 🇪🇸 Spain | $14,875 | 17.7% |
| #8 | 🇳🇱 Netherlands | $14,378 | 38.9% |
| #9 | 🇵🇱 Poland | $13,369 | 32.3% |
| #10 | 🇹🇷 Turkey | $13,057 | -3.8% |
| #11 | 🇳🇴 Norway | $8,292 | 7.4% |
| #12 | 🇬🇷 Greece | $8,014 | 53.1% |
| #13 | 🇧🇪 Belgium | $6,503 | 25.1% |
| #14 | 🇷🇴 Romania | $5,785 | 114.9% |
| #15 | 🇩🇰 Denmark | $5,522 | 36.1% |
| #16 | 🇨🇿 Czech Republic | $4,013 | 103.2% |
| #17 | 🇵🇹 Portugal | $3,975 | 32.2% |
| #18 | 🇭🇺 Hungary | $2,907 | 140.3% |
| #19 | 🇸🇰 Slovakia | $2,043 | 104.6% |
| #20 | 🇭🇷 Croatia | $1,846 | 73.6% |
| #21 | 🇱🇹 Lithuania | $1,278 | 198.8% |
| #22 | 🇧🇬 Bulgaria | $1,253 | 67.7% |
| #23 | 🇱🇻 Latvia | $851 | 189.9% |
| #24 | 🇪🇪 Estonia | $787 | 53.2% |
| #25 | 🇸🇮 Slovenia | $760 | 56.0% |
| #26 | 🇱🇺 Luxembourg | $474 | 87.4% |
| #27 | 🇦🇱 Albania | $239 | 33.8% |
| #28 | 🇲🇰 North Macedonia | $219 | 76.6% |
| #29 | 🇲🇪 Montenegro | $97 | 40.0% |
NATO is based on building up forces and equipment for the goal of joint security and defense. And, despite the pandemic, many members did increase their spending in 2020.
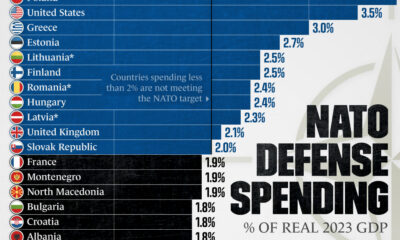
However, not all countries contribute equally. The agreed-upon target for European NATO members, for example, is to spend 2% of GDP on defense by 2024, but many countries are not on track to meet this goal.
Who Pays for NATO Itself?
One of the key pillars of NATO is collective defense: a commitment to the idea that an act of violence against one or more of its member states is an act of aggression towards all.
Collective defense, cooperative security, and crisis management are at the heart of NATO’s purpose and operations.
Apart from defense spending, running a transcontinental political alliance costs around $3 billion annually. So which countries foot the bill for these expenses?
| Country | Cost Share Arrangements (2021-2024) |
|---|---|
| 🇺🇸 United States | 16.36% |
| 🇩🇪 Germany | 16.36% |
| 🇬🇧 United Kingdom | 11.29% |
| 🇫🇷 France | 10.50% |
| 🇮🇹 Italy | 8.79% |
| 🇨🇦 Canada | 6.88% |
| 🇪🇸 Spain | 6.00% |
| 🇹🇷 Turkey | 4.73% |
| 🇳🇱 Netherlands | 3.45% |
| 🇵🇱 Poland | 2.99% |
| 🇧🇪 Belgium | 2.11% |
| 🇳🇴 Norway | 1.78% |
| 🇩🇰 Denmark | 1.31% |
| 🇷🇴 Romania | 1.23% |
| 🇬🇷 Greece | 1.06% |
| 🇨🇿 Czech Republic | 1.06% |
| 🇵🇹 Portugal | 1.05% |
| 🇭🇺 Hungary | 0.76% |
| 🇸🇰 Slovakia | 0.52% |
| 🇧🇬 Bulgaria | 0.37% |
| 🇭🇷 Croatia | 0.30% |
| 🇱🇹 Lithuania | 0.26% |
| 🇸🇮 Slovenia | 0.23% |
| 🇱🇺 Luxembourg | 0.17% |
| 🇱🇻 Latvia | 0.16% |
| 🇪🇪 Estonia | 0.12% |
| 🇦🇱 Albania | 0.09% |
| 🇮🇸 Iceland | 0.06% |
| 🇲🇪 Montenegro | 0.03% |
| Total | 100.00% |
Members have pre-arranged mechanisms to divide NATO alliance expenses evenly.
Getting into specifics, the members are paying for:
- Civilian staff wages and overhead costs of running NATO headquarters.
- Running strategic commands, joint operations, early warning and radar systems, training, etc.
- Defense communications systems, harbors, airfields, and fuel supplies.
The Future of NATO
While outright nation-on-nation conflict is becoming more rare, threats to the collective security of NATO allies have not disappeared.
While countries may have differing opinions over the exact amount each should contribute, rising expenditures are a sign that NATO is still a priority for the near future.


Economy
The Bloc Effect: International Trade with Geopolitical Allies on the Rise
Rising geopolitical tensions are shaping the future of international trade, but what is the effect on trading among G7 and BRICS countries?


The Bloc Effect: International Trade with Allies on the Rise
International trade has become increasingly fragmented over the last five years as countries have shifted to trading more with their geopolitical allies.
This graphic from The Hinrich Foundation, the first in a three-part series covering the future of trade, provides visual context to the growing divide in trade in G7 and pre-expansion BRICS countries, which are used as proxies for geopolitical blocs.
Trade Shifts in G7 and BRICS Countries
This analysis uses IMF data to examine differences in shares of exports within and between trading blocs from 2018 to 2023. For example, we looked at the percentage of China’s exports with other BRICS members as well as with G7 members to see how these proportions shifted in percentage points (pp) over time.
Countries traded nearly $270 billion more with allies in 2023 compared to 2018. This shift came at the expense of trade with rival blocs, which saw a decline of $314 billion.
Country Change in Exports Within Bloc (pp) Change in Exports With Other Bloc (pp)
🇮🇳 India 0.0 3.9
🇷🇺 Russia 0.7 -3.8
🇮🇹 Italy 0.8 -0.7
🇨🇦 Canada 0.9 -0.7
🇫🇷 France 1.0 -1.1
🇪🇺 EU 1.1 -1.5
🇩🇪 Germany 1.4 -2.1
🇿🇦 South Africa 1.5 1.5
🇺🇸 U.S. 1.6 -0.4
🇯🇵 Japan 2.0 -1.7
🇨🇳 China 2.1 -5.2
🇧🇷 Brazil 3.7 -3.3
🇬🇧 UK 10.2 0.5
All shifts reported are in percentage points. For example, the EU saw its share of exports to G7 countries rise from 74.3% in 2018 to 75.4% in 2023, which equates to a 1.1 percentage point increase.
The UK saw the largest uptick in trading with other countries within the G7 (+10.2 percentage points), namely the EU, as the post-Brexit trade slump to the region recovered.
Meanwhile, the U.S.-China trade dispute caused China’s share of exports to the G7 to fall by 5.2 percentage points from 2018 to 2023, the largest decline in our sample set. In fact, partly as a result of the conflict, the U.S. has by far the highest number of harmful tariffs in place.
The Russia-Ukraine War and ensuing sanctions by the West contributed to Russia’s share of exports to the G7 falling by 3.8 percentage points over the same timeframe.
India, South Africa, and the UK bucked the trend and continued to witness advances in exports with the opposing bloc.
Average Trade Shifts of G7 and BRICS Blocs
Though results varied significantly on a country-by-country basis, the broader trend towards favoring geopolitical allies in international trade is clear.
Bloc Change in Exports Within Bloc (pp) Change in Exports With Other Bloc (pp)
Average 2.1 -1.1
BRICS 1.6 -1.4
G7 incl. EU 2.4 -1.0
Overall, BRICS countries saw a larger shift away from exports with the other bloc, while for G7 countries the shift within their own bloc was more pronounced. This implies that though BRICS countries are trading less with the G7, they are relying more on trade partners outside their bloc to make up for the lost G7 share.
A Global Shift in International Trade and Geopolitical Proximity
The movement towards strengthening trade relations based on geopolitical proximity is a global trend.
The United Nations categorizes countries along a scale of geopolitical proximity based on UN voting records.
According to the organization’s analysis, international trade between geopolitically close countries rose from the first quarter of 2022 (when Russia first invaded Ukraine) to the third quarter of 2023 by over 6%. Conversely, trade with geopolitically distant countries declined.
The second piece in this series will explore China’s gradual move away from using the U.S. dollar in trade settlements.
Visit the Hinrich Foundation to learn more about the future of geopolitical trade

-

 Economy1 day ago
Economic Growth Forecasts for G7 and BRICS Countries in 2024
The IMF has released its economic growth forecasts for 2024. How do the G7 and BRICS countries compare?
-

 United States1 week ago
Ranked: The Largest U.S. Corporations by Number of Employees
We visualized the top U.S. companies by employees, revealing the massive scale of retailers like Walmart, Target, and Home Depot.
-

 Economy2 weeks ago
Where U.S. Inflation Hit the Hardest in March 2024
We visualized product categories that saw the highest % increase in price due to U.S. inflation as of March 2024.
-

 Economy4 weeks ago
G20 Inflation Rates: Feb 2024 vs COVID Peak
We visualize inflation rates across G20 countries as of Feb 2024, in the context of their COVID-19 pandemic peak.
-

 Economy1 month ago
Mapped: Unemployment Claims by State
This visual heatmap of unemployment claims by state highlights New York, California, and Alaska leading the country by a wide margin.
-

 Economy2 months ago
Confidence in the Global Economy, by Country
Will the global economy be stronger in 2024 than in 2023?


-

 Mining1 week ago
Gold vs. S&P 500: Which Has Grown More Over Five Years?
-

 Markets2 weeks ago
Ranked: The Most Valuable Housing Markets in America
-

 Money2 weeks ago
Which States Have the Highest Minimum Wage in America?
-

 AI2 weeks ago
Ranked: Semiconductor Companies by Industry Revenue Share
-

 Markets2 weeks ago
Ranked: The World’s Top Flight Routes, by Revenue
-

 Countries2 weeks ago
Population Projections: The World’s 6 Largest Countries in 2075
-

 Markets2 weeks ago
The Top 10 States by Real GDP Growth in 2023
-

 Demographics2 weeks ago
The Smallest Gender Wage Gaps in OECD Countries