Green
Net-Zero Emissions: The Steps Companies and Investors Can Consider

The Steps to Net-Zero Emissions
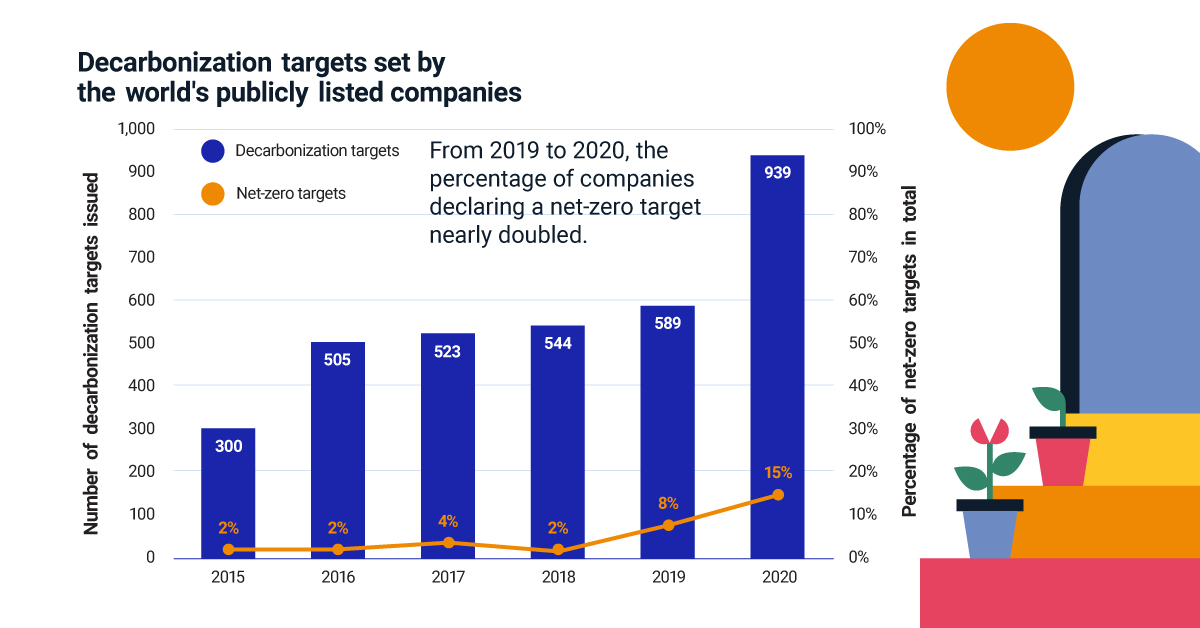
To help prevent the worst effects of climate change, a growing number of companies are pledging to achieve net-zero emissions by 2050. In fact, the percentage of companies declaring a net-zero target nearly doubled from 2019 to 2020.
With urgency building, how can companies and investors approach net-zero emissions? The above infographic from MSCI highlights the steps these two groups can take, from defining a strategy to reporting progress.
Net-Zero Emissions: A Clear Process
Setting a net-zero emissions target means reducing carbon emissions to the greatest extent possible, and compensating for the remaining unavoidable emissions via removal.
Companies and investors can take four broad steps to move toward their targets.
1. Define Strategy
To begin, companies can measure current emissions and identify priority areas where emissions can be reduced. For example, ABC chemical company determines that its greenhouse gas (GHG) emissions far exceed those of its competitors. In response, ABC chemical company prioritizes reducing GHG emissions during material processing.
Similarly, wealth and asset managers can assess climate risks:
- Risks of transitioning to a net-zero economy
- Risks of extreme weather events
They can then map out a strategy to curb climate risk. For example, XYZ asset manager determines that 33% of its portfolio may be vulnerable to asset stranding or some level of transition risk. XYZ decides to lower its transition risk by aligning with a 1.5 degrees Celsius (2.7 degrees Fahrenheit) warming scenario.
2. Set Target
With a strategy set, companies can pledge their net-zero emissions commitment and set interim goals. They can also specify how their pledge will be achieved. For example, ABC chemical company could set a net-zero emissions target by 2050. To increase short-term accountability, they set an interim target to halve carbon emissions by 2035.
Wealth and asset managers can also set targets and interim goals, as they apply to their portfolios. For instance, XYZ asset manager could set a goal to decarbonize its portfolio 5% by 2025, and 10% by 2030. This means that the companies within the portfolio are reducing their carbon emissions at this rate.
| Scenario | Warming Potential |
|---|---|
| Business as usual | 3.6℃ (6.5℉) |
| 10% decarbonization | 1.5℃ (2.7℉) |
As shown above, a 10% year-on-year decarbonization will align XYZ asset manager’s model portfolio with a 1.5 degrees Celsius warming scenario.
3. Implement
ABC chemical company takes immediate action consistent with its interim targets. For instance, the company can start by reducing the carbon footprint of its processes. This approach carries the lowest risks and costs. But to take larger strides toward its net-zero emissions goal, ABC could draw on renewable energy together with carbon-removal technologies as they are developed.
In the same vein, XYZ asset manager can move toward its decarbonization targets by adopting a benchmark index and reallocating capital. This could include:
- Increasing investment in clean technologies
- Re-weighting securities or selecting those that are “best in class” for ESG metrics
- Reducing risk exposure and targeting companies for shareholder engagement
- Selling holdings in companies with the greatest exposure
All of these actions will help XYZ become better aligned with its investment strategy.
4. Track and Publish Progress
Here, the actions for companies and investors converge. Both groups can measure and monitor progress, disclose results, and adjust as necessary.
For example, XYZ asset manager shares the following year-end results of its decarbonization strategy. The results compare the portfolio and its benchmark on their implied temperature rise and exposure to low-carbon transition categories.
| Portfolio | Benchmark | Difference (Portfolio - Benchmark) |
|
|---|---|---|---|
| Implied temperature rise | 3.2℃ (5.8℉) | 3.4℃ (6.1℉) | -0.2℃ (-0.4℉) |
| Exposure to companies classified as: | |||
| Asset stranding | 0.0% | 0.5% | -0.5% |
| Product transition | 6.1% | 8.1% | -2.0% |
| Operational transition | 5.2% | 7.0% | -1.8% |
| Neutral | 77.6% | 77.8% | -0.2% |
| Solutions | 11.1% | 6.6% | +4.5% |
Asset stranding is the potential for an asset to lose its value well ahead of its anticipated useful life because of the low carbon transition. Companies with product transition risk may suffer from reduced demand for carbon-intensive products and services, while companies with operational transition risk may have increased operational or capital costs due to the low carbon transition.
XYZ asset manager’s portfolio has less risk than the benchmark. XYZ has also significantly reduced its exposure to transition risk to 11.3%, down from 33% in step 1. However, with an implied temperature rise of 3.2 degrees Celsius, the portfolio is far from meeting its 1.5 degrees Celsius warming goal. In response, XYZ begins to intensify pressure on portfolio companies to cut their GHG emissions by at least 10% every year.
A Climate Revolution for Net-Zero Emissions
The time to drive the transition to net-zero emissions is now. By the end of this century, the world is on track to be up to 3.5 degrees Celsius warmer. This could lead to catastrophic flooding, harm to human health, and increased rates of mortality.
As of July 2021, just 10% of the world’s publicly listed companies have aligned with global temperature goals. Preventing the worst effects of climate change will demand the largest economic transformation since the Industrial Revolution. Companies, investors and other capital-market participants can drive this change.


Green
The Carbon Footprint of Major Travel Methods
Going on a cruise ship and flying domestically are the most carbon-intensive travel methods.


The Carbon Footprint of Major Travel Methods
This was originally posted on our Voronoi app. Download the app for free on iOS or Android and discover incredible data-driven charts from a variety of trusted sources.
Did you know that transport accounts for nearly one-quarter of global energy-related carbon dioxide (CO₂) emissions?
This graphic illustrates the carbon footprints of major travel methods measured in grams of carbon dioxide equivalent (CO₂e) emitted per person to travel one kilometer. This includes both CO₂ and other greenhouse gases.
Data is sourced from Our World in Data, the UK Government’s Department for Energy Security and Net Zero, and The International Council on Clean Transportation, as of December 2022.
These figures should be interpreted as approximations, rather than exact numbers. There are many variables at play that determine the actual carbon footprint in any individual case, including vehicle type or model, occupancy, energy mix, and even weather.
Cruise Ships are the Most Carbon-Intensive Travel Method
According to these estimates, taking a cruise ship, flying domestically, and driving alone are some of the most carbon-intensive travel methods.
Cruise ships typically use heavy fuel oil, which is high in carbon content. The average cruise ship weighs between 70,000 to 180,000 metric tons, meaning they require large engines to get moving.
These massive vessels must also generate power for onboard amenities such as lighting, air conditioning, and entertainment systems.
Short-haul flights are also considered carbon-intensive due to the significant amount of fuel consumed during initial takeoff and climbing altitude, relative to a lower amount of cruising.
| Transportation method | CO₂ equivalent emissions per passenger km |
|---|---|
| Cruise Ship | 250 |
| Short-haul flight (i.e. within a U.S. state or European country) | 246 |
| Diesel car | 171 |
| Gas car | 170 |
| Medium-haul flight (i.e. international travel within Europe, or between U.S. states) | 151 |
| Long-haul flight (over 3,700 km, about the distance from LA to NY) | 147 |
| Motorbike | 113 |
| Bus (average) | 96 |
| Plug-in hybrid | 68 |
| Electric car | 47 |
| National rail | 35 |
| Tram | 28 |
| London Underground | 27 |
| Ferry (foot passenger) | 19 |
| Eurostar (International rail) | 4.5 |
Are EVs Greener?
Many experts agree that EVs produce a lower carbon footprint over time versus traditional internal combustion engine (ICE) vehicles.
However, the batteries in electric vehicles charge on the power that comes straight off the electrical grid—which in many places may be powered by fossil fuels. For that reason, the carbon footprint of an EV will depend largely on the blend of electricity sources used for charging.
There are also questions about how energy-intensive it is to build EVs compared to a comparable ICE vehicle.

-

 Debt1 week ago
How Debt-to-GDP Ratios Have Changed Since 2000
-

 Markets2 weeks ago
Ranked: The World’s Top Flight Routes, by Revenue
-

 Countries2 weeks ago
Population Projections: The World’s 6 Largest Countries in 2075
-

 Markets2 weeks ago
The Top 10 States by Real GDP Growth in 2023
-

 Demographics2 weeks ago
The Smallest Gender Wage Gaps in OECD Countries
-

 United States2 weeks ago
Where U.S. Inflation Hit the Hardest in March 2024
-

 Green2 weeks ago
Top Countries By Forest Growth Since 2001
-

 United States2 weeks ago
Ranked: The Largest U.S. Corporations by Number of Employees