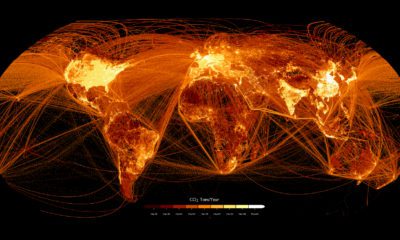

This graphic maps out carbon emissions around the world and where they come from, using data from the European Commission.


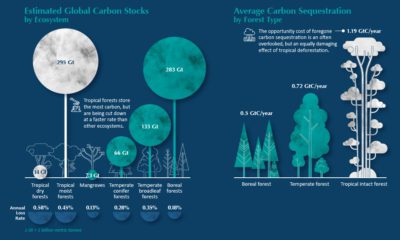
Deforestation is responsible for 12% of all global GHG emissions and is a key obstacle to decelerating rising global temperatures.


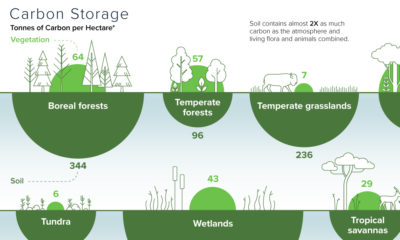
Forests are vital carbon sinks, soaking up about 40% of all emissions annually. Here is the carbon storage of ecosystems around the world.


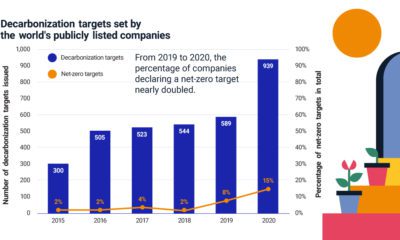
More companies are declaring net-zero emissions targets, but where can they start? Find out the steps companies and investors can take.