Energy
Visualizing the Race for EV Dominance
![]() Subscribe to the Elements free mailing list for more like this
Subscribe to the Elements free mailing list for more like this
Electric Car Companies: Eating Tesla’s Dust
This was originally posted on Elements. Sign up to the free mailing list to get beautiful visualizations on natural resource megatrends in your email every week.
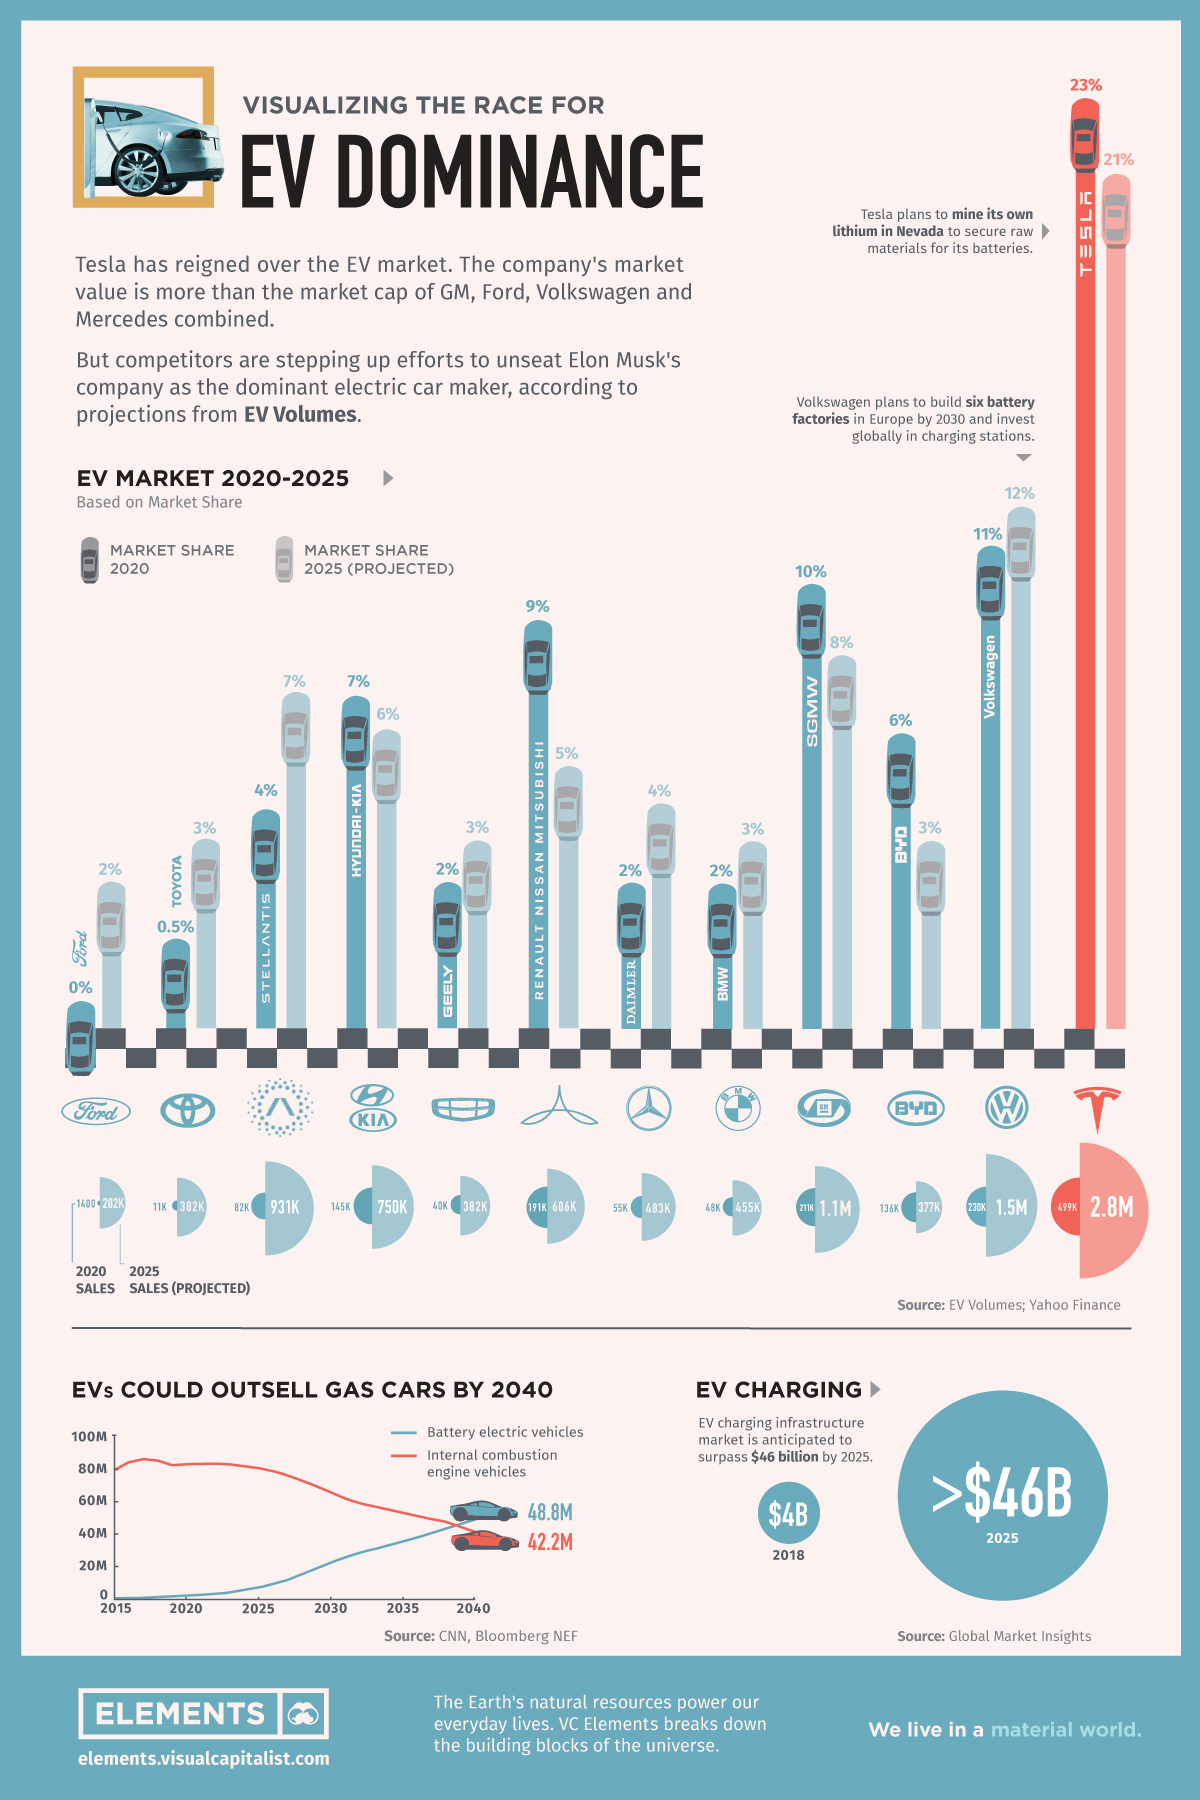
Tesla has reigned supreme among electric car companies, ever since it first released the Roadster back in 2008.
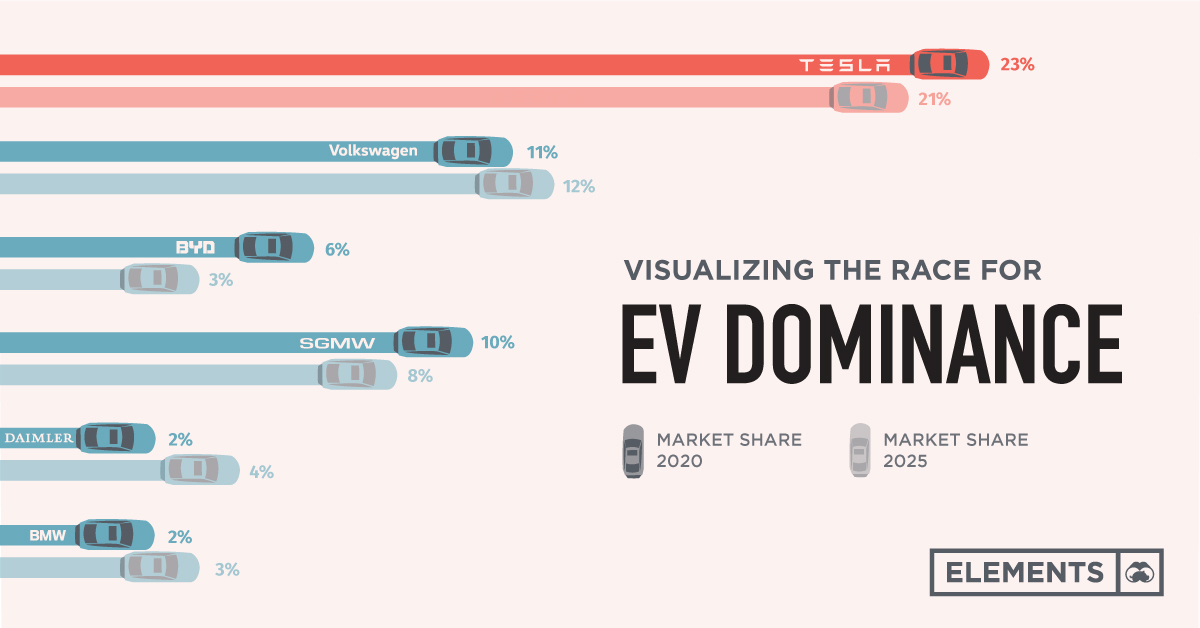
The California-based company headed by Elon Musk ended 2020 with 23% of the EV market and recently became the first automaker to hit a $1 trillion market capitalization. However, competitors like Volkswagen hope to accelerate their own EV efforts to unseat Musk’s company as the dominant manufacturer.
This graphic based on data from EV Volumes compares Tesla and other top carmakers’ positions today—from an all-electric perspective—and gives market share projections for 2025.
Auto Majors Playing Catch-up
According to Wood Mackenzie, Volkswagen will become the largest manufacturer of EVs before 2030. In order to achieve this, the world’s second-biggest carmaker is in talks with suppliers to secure direct access to the raw materials for batteries.
It also plans to build six battery factories in Europe by 2030 and to invest globally in charging stations. Still, according to EV Volumes projections, by 2025 the German company is forecasted to have only 12% of the market versus Tesla’s 21%.
| Company | Sales 2020 | Sales 2025 (projections) | Market cap (Oct '21, USD) |
|---|---|---|---|
| Tesla | 499,000 | 2,800,000 | $1,023B |
| Volkswagen Group | 230,000 | 1,500,000 | $170B |
| BYD | 136,000 | 377,000 | $113B |
| SGMW (GM, Wulling Motors, SAIC) | 211,000 | 1,100,000 | $89B |
| BMW | 48,000 | 455,000 | $67B |
| Daimler (Mercedes-Benz) | 55,000 | 483,000 | $103B |
| Renault-Nissan-Mitsubishi | 191,000 | 606,000 | $39B |
| Geely | 40,000 | 382,000 | $34B |
| Hyundai -Kia | 145,000 | 750,000 | $112B |
| Stellantis | 82,000 | 931,000 | $63B |
| Toyota | 11,000 | 382,000 | $240B |
| Ford | 1,400 | 282,000 | $63B |
Other auto giants are following the same track towards EV adoption.
GM, the largest U.S. automaker, wants to stop selling fuel-burning cars by 2035. The company is making a big push into pure electric vehicles, with more than 30 new models expected by 2025.
Meanwhile, Ford expects 40% of its vehicles sold to be electric by the year 2030. The American carmaker has laid out plans to invest tens of billions of dollars in electric and autonomous vehicle efforts in the coming years.
Tesla’s Brand: A Secret Weapon
When it comes to electric car company brand awareness in the marketplace, Tesla still surpasses all others. In fact, more than one-fourth of shoppers who are considering an EV said Tesla is their top choice.
“They’ve done a wonderful job at presenting themselves as the innovative leader of electric vehicles and therefore, this is translating high awareness among consumers…”
—Rachelle Petusky, Research at Cox Automotive Mobility Group
Tesla recently surpassed Audi as the fourth-largest luxury car brand in the United States in 2020. It is now just behind BMW, Lexus, and Mercedes-Benz.
The Dominance of Electric Car Companies by 2040
BloombergNEF expects annual passenger EV sales to reach 13 million in 2025, 28 million in 2030, and 48 million by 2040, outselling gasoline and diesel models (42 million).
As the EV market continues to grow globally, competitors hope to take a run at Tesla’s lead—or at least stay in the race.


Energy
Charted: 4 Reasons Why Lithium Could Be the Next Gold Rush
Visual Capitalist has partnered with EnergyX to show why drops in prices and growing demand may make now the right time to invest in lithium.


4 Reasons Why You Should Invest in Lithium
Lithium’s importance in powering EVs makes it a linchpin of the clean energy transition and one of the world’s most precious minerals.
In this graphic, Visual Capitalist partnered with EnergyX to explore why now may be the time to invest in lithium.
1. Lithium Prices Have Dropped
One of the most critical aspects of evaluating an investment is ensuring that the asset’s value is higher than its price would indicate. Lithium is integral to powering EVs, and, prices have fallen fast over the last year:
| Date | LiOH·H₂O* | Li₂CO₃** |
|---|---|---|
| Feb 2023 | $76 | $71 |
| March 2023 | $71 | $61 |
| Apr 2023 | $43 | $33 |
| May 2023 | $43 | $33 |
| June 2023 | $47 | $45 |
| July 2023 | $44 | $40 |
| Aug 2023 | $35 | $35 |
| Sept 2023 | $28 | $27 |
| Oct 2023 | $24 | $23 |
| Nov 2023 | $21 | $21 |
| Dec 2023 | $17 | $16 |
| Jan 2024 | $14 | $15 |
| Feb 2024 | $13 | $14 |
Note: Monthly spot prices were taken as close to the 14th of each month as possible.
*Lithium hydroxide monohydrate MB-LI-0033
**Lithium carbonate MB-LI-0029
2. Lithium-Ion Battery Prices Are Also Falling
The drop in lithium prices is just one reason to invest in the metal. Increasing economies of scale, coupled with low commodity prices, have caused the cost of lithium-ion batteries to drop significantly as well.
In fact, BNEF reports that between 2013 and 2023, the price of a Li-ion battery dropped by 82%.
| Year | Price per KWh |
|---|---|
| 2023 | $139 |
| 2022 | $161 |
| 2021 | $150 |
| 2020 | $160 |
| 2019 | $183 |
| 2018 | $211 |
| 2017 | $258 |
| 2016 | $345 |
| 2015 | $448 |
| 2014 | $692 |
| 2013 | $780 |

3. EV Adoption is Sustainable
One of the best reasons to invest in lithium is that EVs, one of the main drivers behind the demand for lithium, have reached a price point similar to that of traditional vehicle.
According to the Kelly Blue Book, Tesla’s average transaction price dropped by 25% between 2022 and 2023, bringing it in line with many other major manufacturers and showing that EVs are a realistic transport option from a consumer price perspective.
| Manufacturer | September 2022 | September 2023 |
|---|---|---|
| BMW | $69,000 | $72,000 |
| Ford | $54,000 | $56,000 |
| Volkswagon | $54,000 | $56,000 |
| General Motors | $52,000 | $53,000 |
| Tesla | $68,000 | $51,000 |
4. Electricity Demand in Transport is Growing
As EVs become an accessible transport option, there’s an investment opportunity in lithium. But possibly the best reason to invest in lithium is that the IEA reports global demand for the electricity in transport could grow dramatically by 2030:
| Transport Type | 2022 | 2025 | 2030 |
|---|---|---|---|
| Buses 🚌 | 23,000 GWh | 50,000 GWh | 130,000 GWh |
| Cars 🚙 | 65,000 GWh | 200,000 GWh | 570,000 GWh |
| Trucks 🛻 | 4,000 GWh | 15,000 GWh | 94,000 GWh |
| Vans 🚐 | 6,000 GWh | 16,000 GWh | 72,000 GWh |
The Lithium Investment Opportunity
Lithium presents a potentially classic investment opportunity. Lithium and battery prices have dropped significantly, and recently, EVs have reached a price point similar to other vehicles. By 2030, the demand for clean energy, especially in transport, will grow dramatically.
With prices dropping and demand skyrocketing, now is the time to invest in lithium.
EnergyX is poised to exploit lithium demand with cutting-edge lithium extraction technology capable of extracting 300% more lithium than current processes.

-

 Lithium5 days ago
Ranked: The Top 10 EV Battery Manufacturers in 2023
Asia dominates this ranking of the world’s largest EV battery manufacturers in 2023.
-

 Energy1 week ago
The World’s Biggest Nuclear Energy Producers
China has grown its nuclear capacity over the last decade, now ranking second on the list of top nuclear energy producers.
-

 Energy1 month ago
The World’s Biggest Oil Producers in 2023
Just three countries accounted for 40% of global oil production last year.
-

 Energy1 month ago
How Much Does the U.S. Depend on Russian Uranium?
Currently, Russia is the largest foreign supplier of nuclear power fuel to the U.S.
-

 Uranium2 months ago
Charted: Global Uranium Reserves, by Country
We visualize the distribution of the world’s uranium reserves by country, with 3 countries accounting for more than half of total reserves.
-

 Energy3 months ago
Visualizing the Rise of the U.S. as Top Crude Oil Producer
Over the last decade, the United States has established itself as the world’s top producer of crude oil, surpassing Saudi Arabia and Russia.


-

 Debt1 week ago
How Debt-to-GDP Ratios Have Changed Since 2000
-

 Markets2 weeks ago
Ranked: The World’s Top Flight Routes, by Revenue
-

 Countries2 weeks ago
Population Projections: The World’s 6 Largest Countries in 2075
-

 Markets2 weeks ago
The Top 10 States by Real GDP Growth in 2023
-

 Demographics2 weeks ago
The Smallest Gender Wage Gaps in OECD Countries
-

 United States2 weeks ago
Where U.S. Inflation Hit the Hardest in March 2024
-

 Green2 weeks ago
Top Countries By Forest Growth Since 2001
-

 United States2 weeks ago
Ranked: The Largest U.S. Corporations by Number of Employees