Politics
Visualizing the Decline of Confidence in American Institutions
Every day, the public relies on a number of major institutions for services and safety. From banks and governments, to media and the military—these institutions play an important role in shaping life as we know it.
Yet, today’s interactive data visualization from Overflow Data shows that America’s confidence in institutions has drastically waned. The data relies on the General Social Survey (GSS) to provide a 40-year overview of how sentiment has changed with respect to 13 different institutions.
Select an institution from the drop-down menu below to see how confidence has changed over time
The Erosion of Confidence
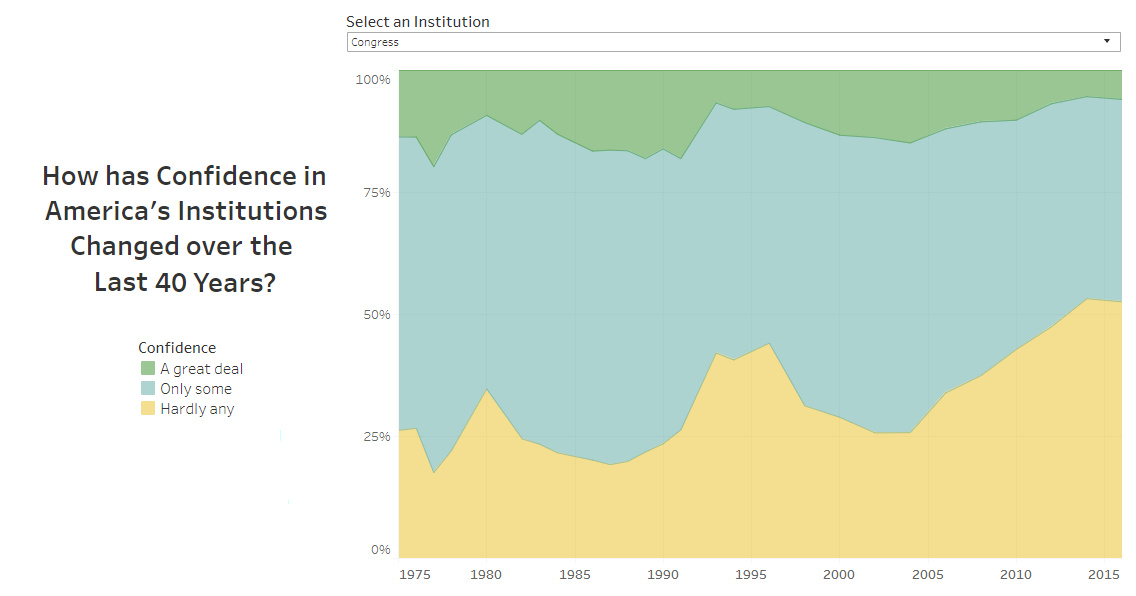
Overall, confidence in most institutions has eroded. Americans find it especially hard to trust their government: the “great deal of confidence” metrics for Congress, the Supreme Court, and the Executive Branch were low to begin with, and have declined further since 1975.
That said, the biggest overall drop belongs to the press, which saw 50% of surveyed Americans saying they have “hardly any confidence” in it in 2016. This is nearly a three-fold increase from 1975, when that number was just 19%. Of course, with the rise of fake news in more recent years, the erosion of confidence in media doesn’t seem to be slowing down.
Here’s a look at the two extremes of sentiment regarding the studied institutions, showing how the opposite measures of “hardly any confidence” and a “great deal of confidence” have changed since 1975:
| Institution | Confidence level | 1975 | 2016 | Change |
|---|---|---|---|---|
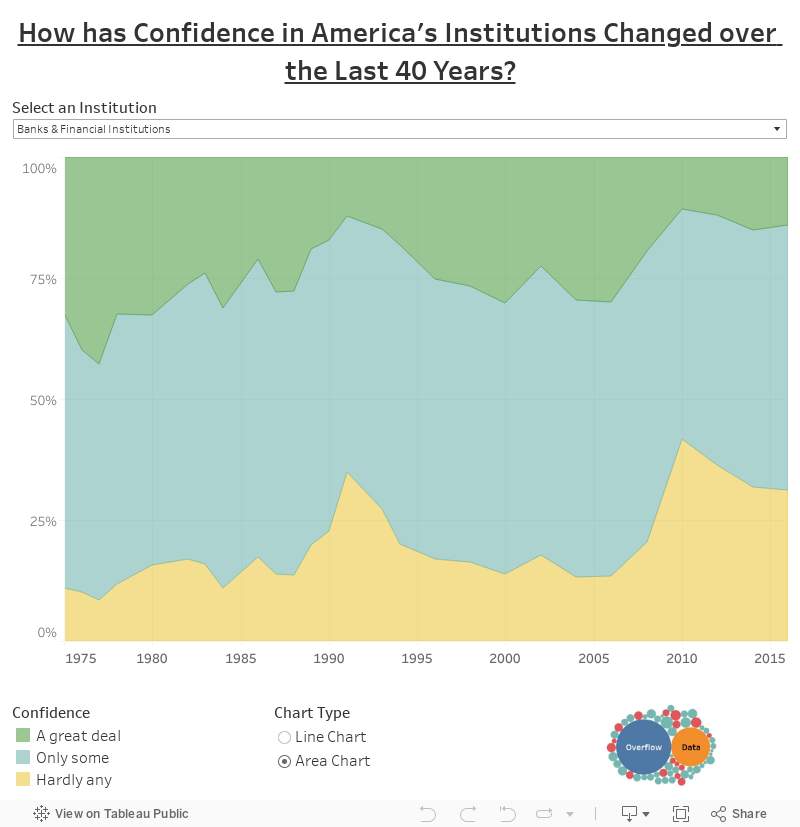
| 🏦 Banks & Financial Institutions | Hardly any | 10.9% | 31.2% | +20.3 p.p. |
| Great deal | 32.3% | 14.1% | -18.2 p.p. | |
| 🗳️ Congress | Hardly any | 26.2% | 52.6% | +26.4 p.p. |
| Great deal | 13.6% | 5.9% | -7.7 p.p. | |
| 🏫 Education | Hardly any | 13.0% | 17.5% | +4.5 p.p. |
| Great deal | 31.5% | 25.6% | -5.9 p.p. | |
| 🏛️ Executive Branch | Hardly any | 29.7% | 42.4% | +12.7 p.p. |
| Great deal | 13.4% | 12.8% | -0.6 p.p. | |
| 🏬 Major Companies | Hardly any | 22.9% | 17.3% | -5.6 p.p. |
| Great deal | 20.5% | 18.3% | -2.2 p.p. | |
| 🏥 Medicine | Hardly any | 17.8% | 13.4% | -4.4 p.p. |
| Great deal | 51.8% | 50.6% | -1.2 p.p. | |
| 🎖️ Military | Hardly any | 14.8% | 7.6% | -7.2 p.p. |
| Great deal | 36.3% | 53.4% | +17.1 p.p. | |
| 💪 Organized Labor | Hardly any | 31.5% | 22.6% | -8.9 p.p. |
| Great deal | 10.2% | 13.9% | +3.7 p.p. | |
| 🙏 Religion | Hardly any | 23.0% | 26.4% | +3.4 p.p. |
| Great deal | 25.8% | 20.0% | -5.8 p.p. | |
| 📰 Press | Hardly any | 19.0% | 50.0% | +31 p.p. |
| Great deal | 24.5% | 7.6% | -16.9 p.p. | |
| 🥼 Scientific Community | Hardly any | 7.4% | 6.1% | -1.3 p.p. |
| Great deal | 41.7% | 42.1% | +0.4 p.p. | |
| 📺 Television | Hardly any | 23.4% | 43.1% | +19.7 p.p. |
| Great deal | 18.4% | 9.8% | -8.6 p.p. | |
| ⚖️ U.S. Supreme Court | Hardly any | 19.2% | 17.4% | -1.8 p.p. |
| Great deal | 31.8% | 26.3% | -5.5 p.p. |
Banks and financial institutions have also suffered a bad rep in the public eye. Their “great deal of confidence” metric has dropped sharply from 32.3% to 14.1% in four decades.
One major exception is the military, which emerges as the most trusted institution. Americans’ faith in the military has also shown the most improvement, with a 17.1 p.p increase in a “great deal of confidence” since 1975.
The Split Widens Further
While measuring public confidence in institutions can be subjective, it provides an understanding of where Americans want to see change and reform take place.
For more on how Americans perceive different institutions and the issues that affect them, see how the public is divided based on political affiliation.


Economy
The Bloc Effect: International Trade with Geopolitical Allies on the Rise
Rising geopolitical tensions are shaping the future of international trade, but what is the effect on trading among G7 and BRICS countries?


The Bloc Effect: International Trade with Allies on the Rise
International trade has become increasingly fragmented over the last five years as countries have shifted to trading more with their geopolitical allies.
This graphic from The Hinrich Foundation, the first in a three-part series covering the future of trade, provides visual context to the growing divide in trade in G7 and pre-expansion BRICS countries, which are used as proxies for geopolitical blocs.
Trade Shifts in G7 and BRICS Countries
This analysis uses IMF data to examine differences in shares of exports within and between trading blocs from 2018 to 2023. For example, we looked at the percentage of China’s exports with other BRICS members as well as with G7 members to see how these proportions shifted in percentage points (pp) over time.
Countries traded nearly $270 billion more with allies in 2023 compared to 2018. This shift came at the expense of trade with rival blocs, which saw a decline of $314 billion.
Country Change in Exports Within Bloc (pp) Change in Exports With Other Bloc (pp)
🇮🇳 India 0.0 3.9
🇷🇺 Russia 0.7 -3.8
🇮🇹 Italy 0.8 -0.7
🇨🇦 Canada 0.9 -0.7
🇫🇷 France 1.0 -1.1
🇪🇺 EU 1.1 -1.5
🇩🇪 Germany 1.4 -2.1
🇿🇦 South Africa 1.5 1.5
🇺🇸 U.S. 1.6 -0.4
🇯🇵 Japan 2.0 -1.7
🇨🇳 China 2.1 -5.2
🇧🇷 Brazil 3.7 -3.3
🇬🇧 UK 10.2 0.5
All shifts reported are in percentage points. For example, the EU saw its share of exports to G7 countries rise from 74.3% in 2018 to 75.4% in 2023, which equates to a 1.1 percentage point increase.
The UK saw the largest uptick in trading with other countries within the G7 (+10.2 percentage points), namely the EU, as the post-Brexit trade slump to the region recovered.
Meanwhile, the U.S.-China trade dispute caused China’s share of exports to the G7 to fall by 5.2 percentage points from 2018 to 2023, the largest decline in our sample set. In fact, partly as a result of the conflict, the U.S. has by far the highest number of harmful tariffs in place.
The Russia-Ukraine War and ensuing sanctions by the West contributed to Russia’s share of exports to the G7 falling by 3.8 percentage points over the same timeframe.
India, South Africa, and the UK bucked the trend and continued to witness advances in exports with the opposing bloc.
Average Trade Shifts of G7 and BRICS Blocs
Though results varied significantly on a country-by-country basis, the broader trend towards favoring geopolitical allies in international trade is clear.
Bloc Change in Exports Within Bloc (pp) Change in Exports With Other Bloc (pp)
Average 2.1 -1.1
BRICS 1.6 -1.4
G7 incl. EU 2.4 -1.0
Overall, BRICS countries saw a larger shift away from exports with the other bloc, while for G7 countries the shift within their own bloc was more pronounced. This implies that though BRICS countries are trading less with the G7, they are relying more on trade partners outside their bloc to make up for the lost G7 share.
A Global Shift in International Trade and Geopolitical Proximity
The movement towards strengthening trade relations based on geopolitical proximity is a global trend.
The United Nations categorizes countries along a scale of geopolitical proximity based on UN voting records.
According to the organization’s analysis, international trade between geopolitically close countries rose from the first quarter of 2022 (when Russia first invaded Ukraine) to the third quarter of 2023 by over 6%. Conversely, trade with geopolitically distant countries declined.
The second piece in this series will explore China’s gradual move away from using the U.S. dollar in trade settlements.
Visit the Hinrich Foundation to learn more about the future of geopolitical trade

-

 Economy3 days ago
Economic Growth Forecasts for G7 and BRICS Countries in 2024
The IMF has released its economic growth forecasts for 2024. How do the G7 and BRICS countries compare?
-

 United States2 weeks ago
Ranked: The Largest U.S. Corporations by Number of Employees
We visualized the top U.S. companies by employees, revealing the massive scale of retailers like Walmart, Target, and Home Depot.
-

 United States2 weeks ago
Where U.S. Inflation Hit the Hardest in March 2024
We visualized product categories that saw the highest % increase in price due to U.S. inflation as of March 2024.
-

 Economy1 month ago
G20 Inflation Rates: Feb 2024 vs COVID Peak
We visualize inflation rates across G20 countries as of Feb 2024, in the context of their COVID-19 pandemic peak.
-

 Jobs1 month ago
Mapped: Unemployment Claims by State
This visual heatmap of unemployment claims by state highlights New York, California, and Alaska leading the country by a wide margin.
-

 Economy2 months ago
Confidence in the Global Economy, by Country
Will the global economy be stronger in 2024 than in 2023?


-

 Debt1 week ago
How Debt-to-GDP Ratios Have Changed Since 2000
-

 Markets2 weeks ago
Ranked: The World’s Top Flight Routes, by Revenue
-

 Demographics2 weeks ago
Population Projections: The World’s 6 Largest Countries in 2075
-

 Markets2 weeks ago
The Top 10 States by Real GDP Growth in 2023
-

 Demographics2 weeks ago
The Smallest Gender Wage Gaps in OECD Countries
-
United States2 weeks ago
Where U.S. Inflation Hit the Hardest in March 2024
-

 Green2 weeks ago
Top Countries By Forest Growth Since 2001
-
United States2 weeks ago
Ranked: The Largest U.S. Corporations by Number of Employees