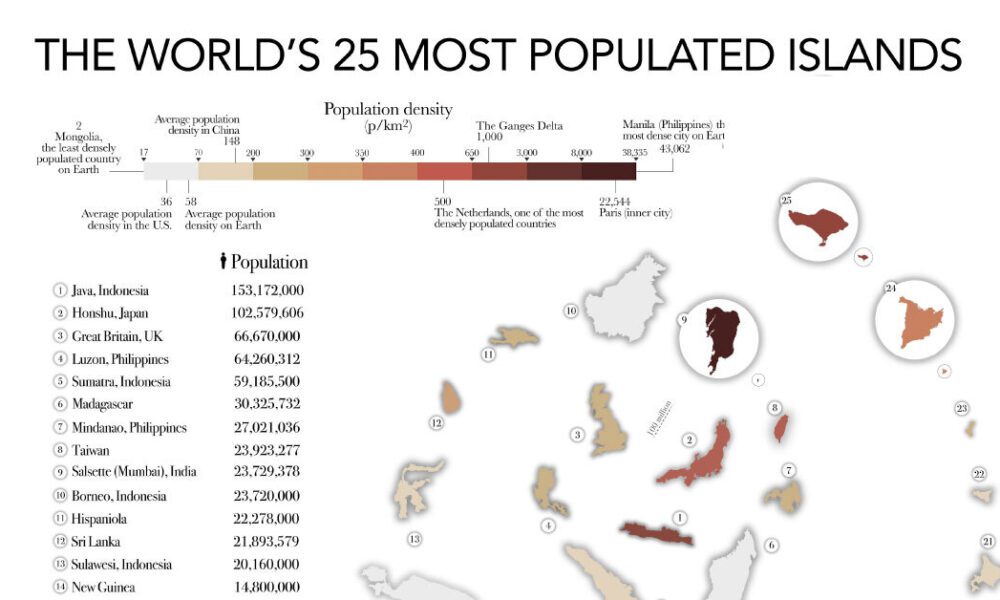
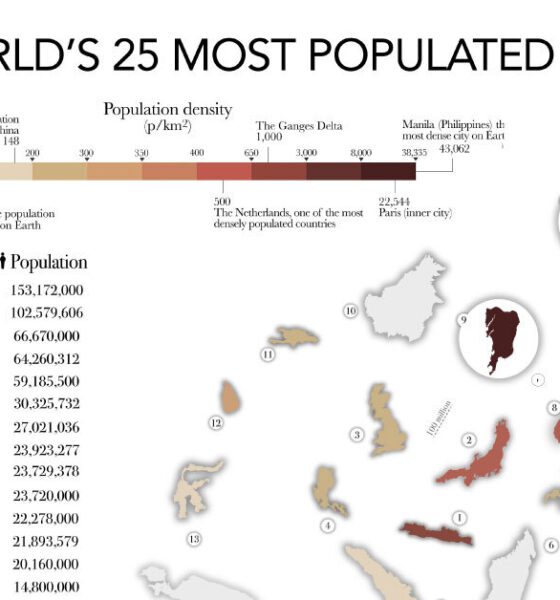

The most populated islands of the earth are teeming hubs of human activity, a far cry from the remote paradises...


The gender gap in corporate America is still prevalent, especially in leadership roles. In 2021, only 8.2% of Fortune 500 CEOs were female.

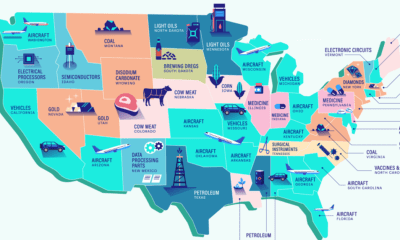
Petroleum is the top import in twelve states, making it the most commonly imported commodity across America. Here are America’s top imports.

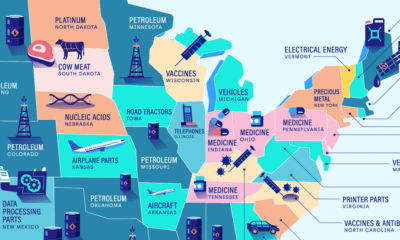
From Nevada gold to Maine’s top-tier lobsters, here are America’s top exports by state.
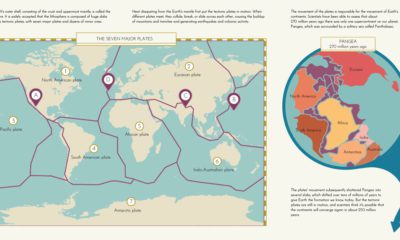

This graphic provides an explanation of plate tectonics and highlights the seven major tectonic plates that make up Earth’s outer crust.
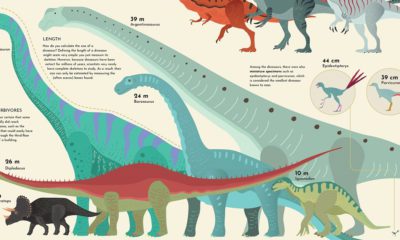

The largest dinosaur that ever lived was as long as a 13-story building. We show how the sizes of dinosaurs measured up.


This graphic compares the cost of living and purchasing power of 578 cities worldwide, using New York City as a benchmark for comparison.


Wind is a great renewable energy source, but the spread of potential power is uneven. This graphic maps the average wind speed of the continental U.S.
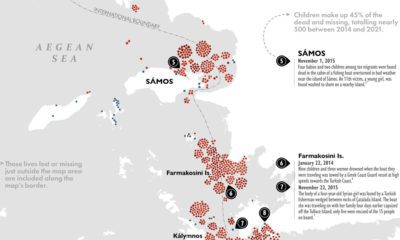

Each year, thousands of migrants take the journey along the Eastern Mediterranean to get to the EU. Some never make it to their destination.
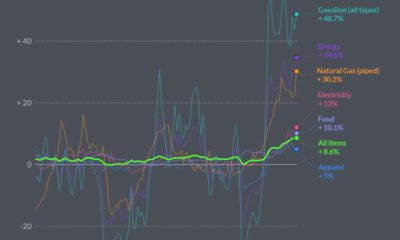

In May 2022, U.S. Inflation was the highest its been since 1981. Here’s a look at which products saw the biggest price jumps.


Scientists believe we've only discovered about 5% of the universe. Here's a map of what we've found so far, visualized using a log scale.