Markets
Mapped: The Top U.S. Imports by State
Article/Editing:
Click to view a larger version of the graphic.
Mapped: The Top U.S. Imports by State
In 2021, the U.S. brought in approximately $2.83 trillion worth of goods from its various international trading partners.
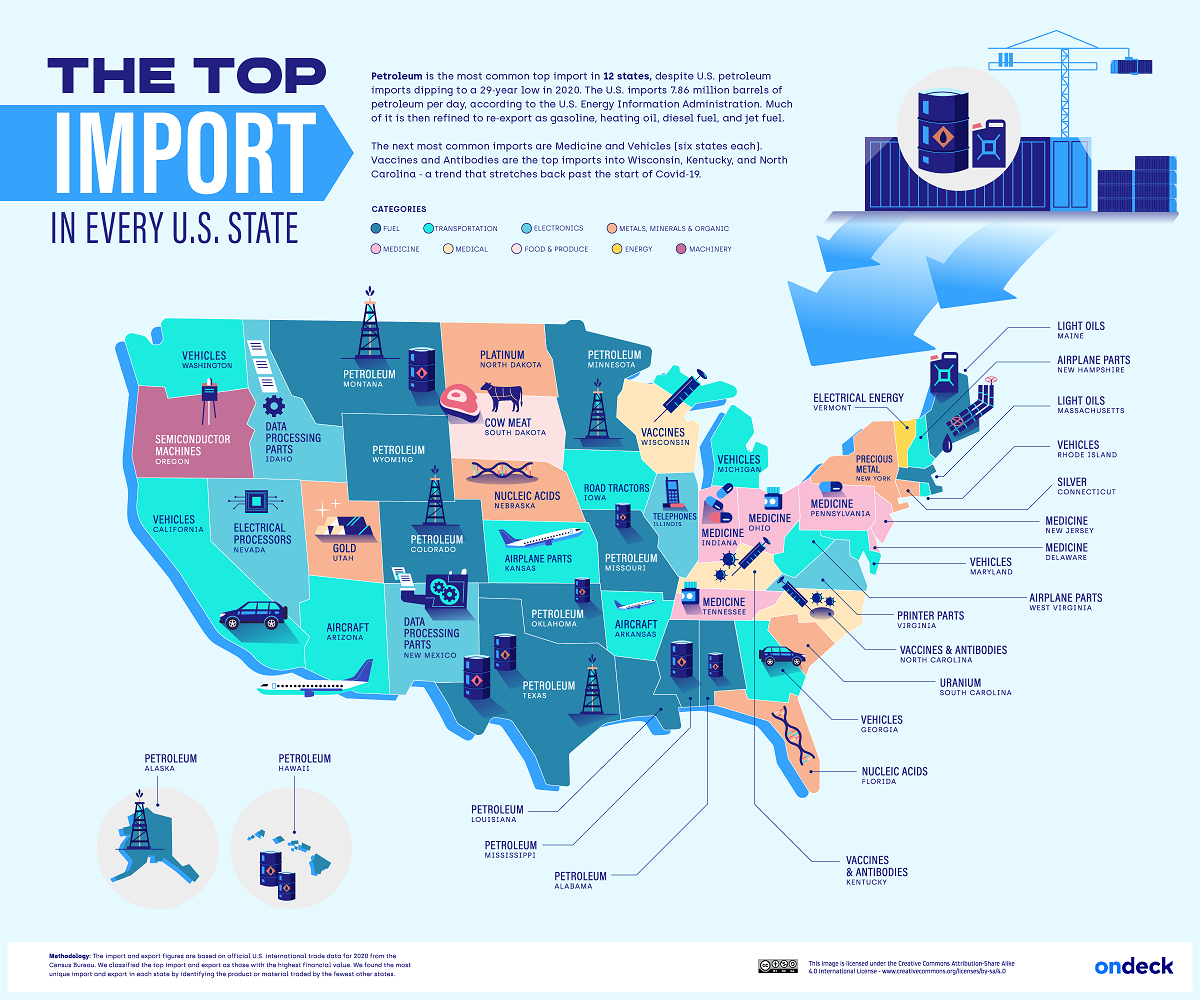
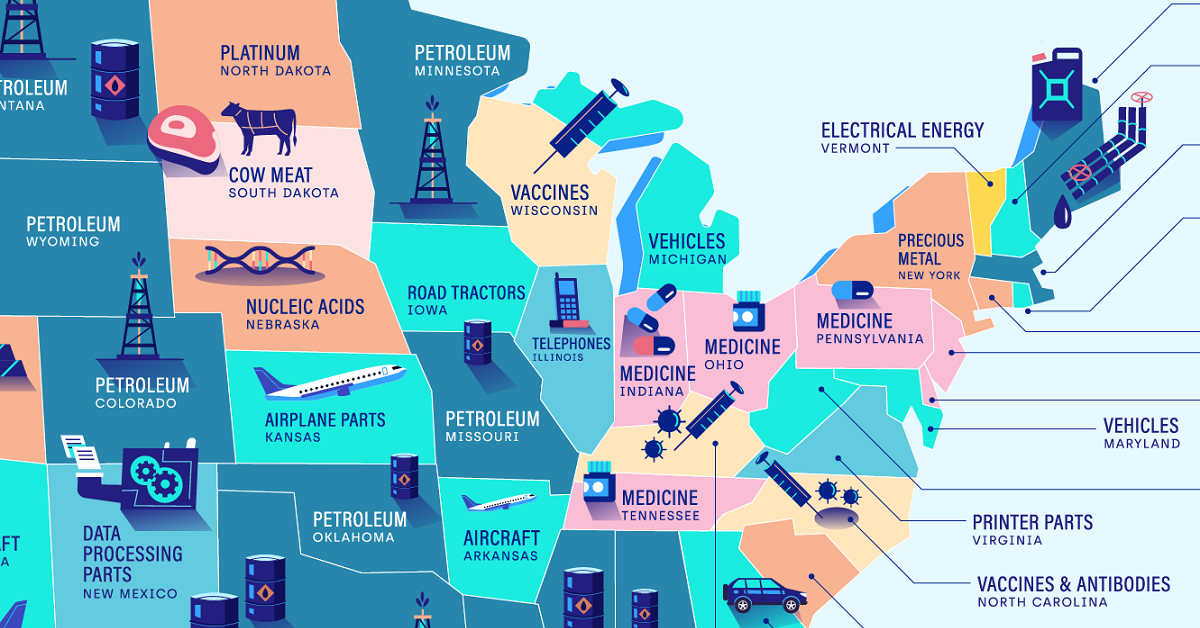
But what types of goods are most commonly imported throughout different parts of America? This graphic by OnDeck shows the top import in every U.S. state, using January 2022 data from the U.S. Census Bureau.
The Most Popular Categories of U.S. Imports
Petroleum is the most popular import in 12 states, making it the most common import across America. In 2021, about 72% of imported petroleum was crude oil, which was then domestically refined into products like gasoline, diesel, or jet fuel.
| State | Top Import |
|---|---|
| Alabama | Petroleum |
| Alaska | Petroleum |
| Arizona | Aircraft |
| Arkansas | Aircraft |
| California | Vehicles |
| Colorado | Petroleum |
| Connecticut | Silver |
| Delaware | Medicine |
| Florida | Nucleic Acids |
| Georgia | Vehicles |
| Hawaii | Petroleum |
| Idaho | Data Processing Parts |
| Illinois | Telephones |
| Indiana | Medicine |
| Iowa | Road Tractors |
| Kansas | Aircraft |
| Kentucky | Vaccines and Antibodies |
| Louisiana | Petroleum |
| Maine | Light Oils |
| Maryland | Vehicles |
| Massachusetts | Light Oils |
| Michigan | Vehicles |
| Minnesota | Petroleum |
| Mississippi | Petroleum |
| Missouri | Petroleum |
| Montana | Petroleum |
| Nebraska | Nucleic Acids |
| Nevada | Electrical Processors |
| New Hampshire | Aircraft |
| New Jersey | Medicine |
| New Mexico | Data Processing Parts |
| New York | Precious Metal |
| North Carolina | Vaccines and Antibodies |
| North Dakota | Platinum |
| Ohio | Medicine |
| Oklahoma | Petroleum |
| Oregon | Semiconductor Machines |
| Pennsylvania | Medicine |
| Rhode Island | Vehicles |
| South Carolina | Uranium |
| South Dakota | Cow Meat |
| Tennessee | Medicine |
| Texas | Petroleum |
| Utah | Gold |
| Vermont | Electrical Energy |
| Virginia | Printer Parts |
| Washington | Vehicles |
| West Virginia | Aircraft |
| Wisconsin | Vaccines |
| Wyoming | Petroleum |
A majority of that imported petroleum came from Canada, while roughly 11% was imported from OPEC countries, and 8% came from Russia. Of course, the latter figure will likely dip in 2022 because of the ban on Russian imports implemented by the Biden administration in response to the Russia-Ukraine conflict.
After petroleum, vehicles and medicine were tied for the second most-imported goods, with both categories being the most popular import in six states each.
Somewhat related to medicine are nucleic acids, which were the top imports in Florida and Nebraska. Nucleic acids are natural polymers that are used in biological processes like protein synthesis or messenger RNA (mRNA) translation. It’s worth noting that several COVID-19 vaccines, including those produced by Moderna and Pfizer-BioNTech, are mRNA vaccines.
The Most Unique U.S. Imports
In addition to outlining the most popular imports in each U.S. state, OnDeck highlights each state’s most unique import, visualized in the graphic below.
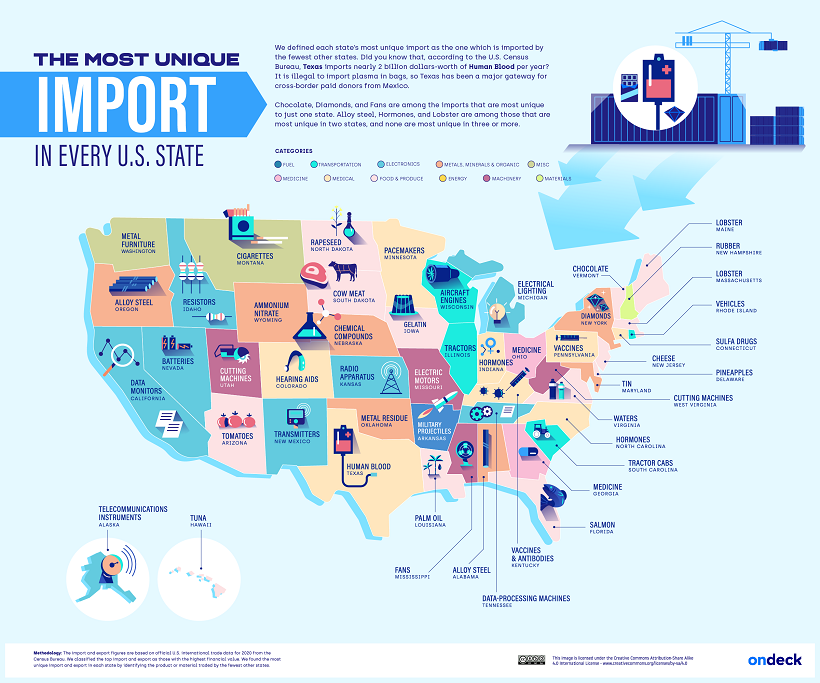
OnDeck defines each state’s “most unique” import as the category of goods that was imported by the fewest other states.
Salmon was Florida’s most unique import. This makes sense considering the Sunshine State is home to some of the country’s biggest seafood wholesalers, including North Star Seafood (owned by Sysco) and Tampa Bay Fisheries.
Another example is Delaware’s high imports of pineapples, totaling around $60.2 million in pineapples per year. This time, the culprit is Dole plc (formerly the Dole Food Company), the largest producer of fruit and vegetables in the world. Until 2021, the company’s headquarters were based in Delaware, and it still receives pineapple imports to the Port of Wilmington in the state’s largest city.

This article was published as a part of Visual Capitalist's Creator Program, which features data-driven visuals from some of our favorite Creators around the world.


Markets
Mapped: Europe’s GDP Per Capita, by Country
Which European economies are richest on a GDP per capita basis? This map shows the results for 44 countries across the continent.


Mapped: Europe’s GDP Per Capita, by Country (2024)
This was originally posted on our Voronoi app. Download the app for free on iOS or Android and discover incredible data-driven charts from a variety of trusted sources.
Europe is home to some of the largest and most sophisticated economies in the world. But how do countries in the region compare with each other on a per capita productivity basis?
In this map, we show Europe’s GDP per capita levels across 44 nations in current U.S. dollars. Data for this visualization and article is sourced from the International Monetary Fund (IMF) via their DataMapper tool, updated April 2024.
Europe’s Richest and Poorest Nations, By GDP Per Capita
Luxembourg, Ireland, and Switzerland, lead the list of Europe’s richest nations by GDP per capita, all above $100,000.
| Rank | Country | GDP Per Capita (2024) |
|---|---|---|
| 1 | 🇱🇺 Luxembourg | $131,380 |
| 2 | 🇮🇪 Ireland | $106,060 |
| 3 | 🇨🇭 Switzerland | $105,670 |
| 4 | 🇳🇴 Norway | $94,660 |
| 5 | 🇮🇸 Iceland | $84,590 |
| 6 | 🇩🇰 Denmark | $68,900 |
| 7 | 🇳🇱 Netherlands | $63,750 |
| 8 | 🇸🇲 San Marino | $59,410 |
| 9 | 🇦🇹 Austria | $59,230 |
| 10 | 🇸🇪 Sweden | $58,530 |
| 11 | 🇧🇪 Belgium | $55,540 |
| 12 | 🇫🇮 Finland | $55,130 |
| 13 | 🇩🇪 Germany | $54,290 |
| 14 | 🇬🇧 UK | $51,070 |
| 15 | 🇫🇷 France | $47,360 |
| 16 | 🇦🇩 Andorra | $44,900 |
| 17 | 🇲🇹 Malta | $41,740 |
| 18 | 🇮🇹 Italy | $39,580 |
| 19 | 🇨🇾 Cyprus | $37,150 |
| 20 | 🇪🇸 Spain | $34,050 |
| 21 | 🇸🇮 Slovenia | $34,030 |
| 22 | 🇪🇪 Estonia | $31,850 |
| 23 | 🇨🇿 Czech Republic | $29,800 |
| 24 | 🇵🇹 Portugal | $28,970 |
| 25 | 🇱🇹 Lithuania | $28,410 |
| 26 | 🇸🇰 Slovakia | $25,930 |
| 27 | 🇱🇻 Latvia | $24,190 |
| 28 | 🇬🇷 Greece | $23,970 |
| 29 | 🇭🇺 Hungary | $23,320 |
| 30 | 🇵🇱 Poland | $23,010 |
| 31 | 🇭🇷 Croatia | $22,970 |
| 32 | 🇷🇴 Romania | $19,530 |
| 33 | 🇧🇬 Bulgaria | $16,940 |
| 34 | 🇷🇺 Russia | $14,390 |
| 35 | 🇹🇷 Türkiye | $12,760 |
| 36 | 🇲🇪 Montenegro | $12,650 |
| 37 | 🇷🇸 Serbia | $12,380 |
| 38 | 🇦🇱 Albania | $8,920 |
| 39 | 🇧🇦 Bosnia & Herzegovina | $8,420 |
| 40 | 🇲🇰 North Macedonia | $7,690 |
| 41 | 🇧🇾 Belarus | $7,560 |
| 42 | 🇲🇩 Moldova | $7,490 |
| 43 | 🇽🇰 Kosovo | $6,390 |
| 44 | 🇺🇦 Ukraine | $5,660 |
| N/A | 🇪🇺 EU Average | $44,200 |
Note: Figures are rounded.
Three Nordic countries (Norway, Iceland, Denmark) also place highly, between $70,000-90,000. Other Nordic peers, Sweden and Finland rank just outside the top 10, between $55,000-60,000.
Meanwhile, Europe’s biggest economies in absolute terms, Germany, UK, and France, rank closer to the middle of the top 20, with GDP per capitas around $50,000.
Finally, at the end of the scale, Eastern Europe as a whole tends to have much lower per capita GDPs. In that group, Ukraine ranks last, at $5,660.
A Closer Look at Ukraine
For a broader comparison, Ukraine’s per capita GDP is similar to Iran ($5,310), El Salvador ($5,540), and Guatemala ($5,680).
According to experts, Ukraine’s economy has historically underperformed to expectations. After the fall of the Berlin Wall, the economy contracted for five straight years. Its transition to a Western, liberalized economic structure was overshadowed by widespread corruption, a limited taxpool, and few revenue sources.
Politically, its transformation from authoritarian regime to civil democracy has proved difficult, especially when it comes to institution building.
Finally, after the 2022 invasion of the country, Ukraine’s GDP contracted by 30% in a single year—the largest loss since independence. Large scale emigration—to the tune of six million refugees—is also playing a role.
Despite these challenges, the country’s economic growth has somewhat stabilized while fighting continues.

-

 Markets5 days ago
Mapped: The Most Valuable Company in Each Southeast Asian Country
-

 Markets2 weeks ago
The Top Private Equity Firms by Country
-

 Jobs2 weeks ago
The Best U.S. Companies to Work for According to LinkedIn
-

 Economy2 weeks ago
Ranked: The Top 20 Countries in Debt to China
-

 Politics1 week ago
Charted: Trust in Government Institutions by G7 Countries
-

 Energy1 week ago
Mapped: The Age of Energy Projects in Interconnection Queues, by State
-

 Mining1 week ago
Visualizing Global Gold Production in 2023
-

 Markets1 week ago
Visualized: Interest Rate Forecasts for Advanced Economies