Leadership
Visualizing Gender Diversity in Corporate America
Article/Editing:
There’s been a massive push to increase diversity and inclusion in the workplace.
However, it appears corporate America still has a ways to go, particularly when it comes to diverse representation in corporate leadership roles. In 2021, only 8.2% of Fortune 500 CEOs were female. Of those females, 85% of them were white.
This graphic by Zainab Ayodimeji highlights the current state of diversity in corporate America, reminding us that there are still significant gender and racial gaps.
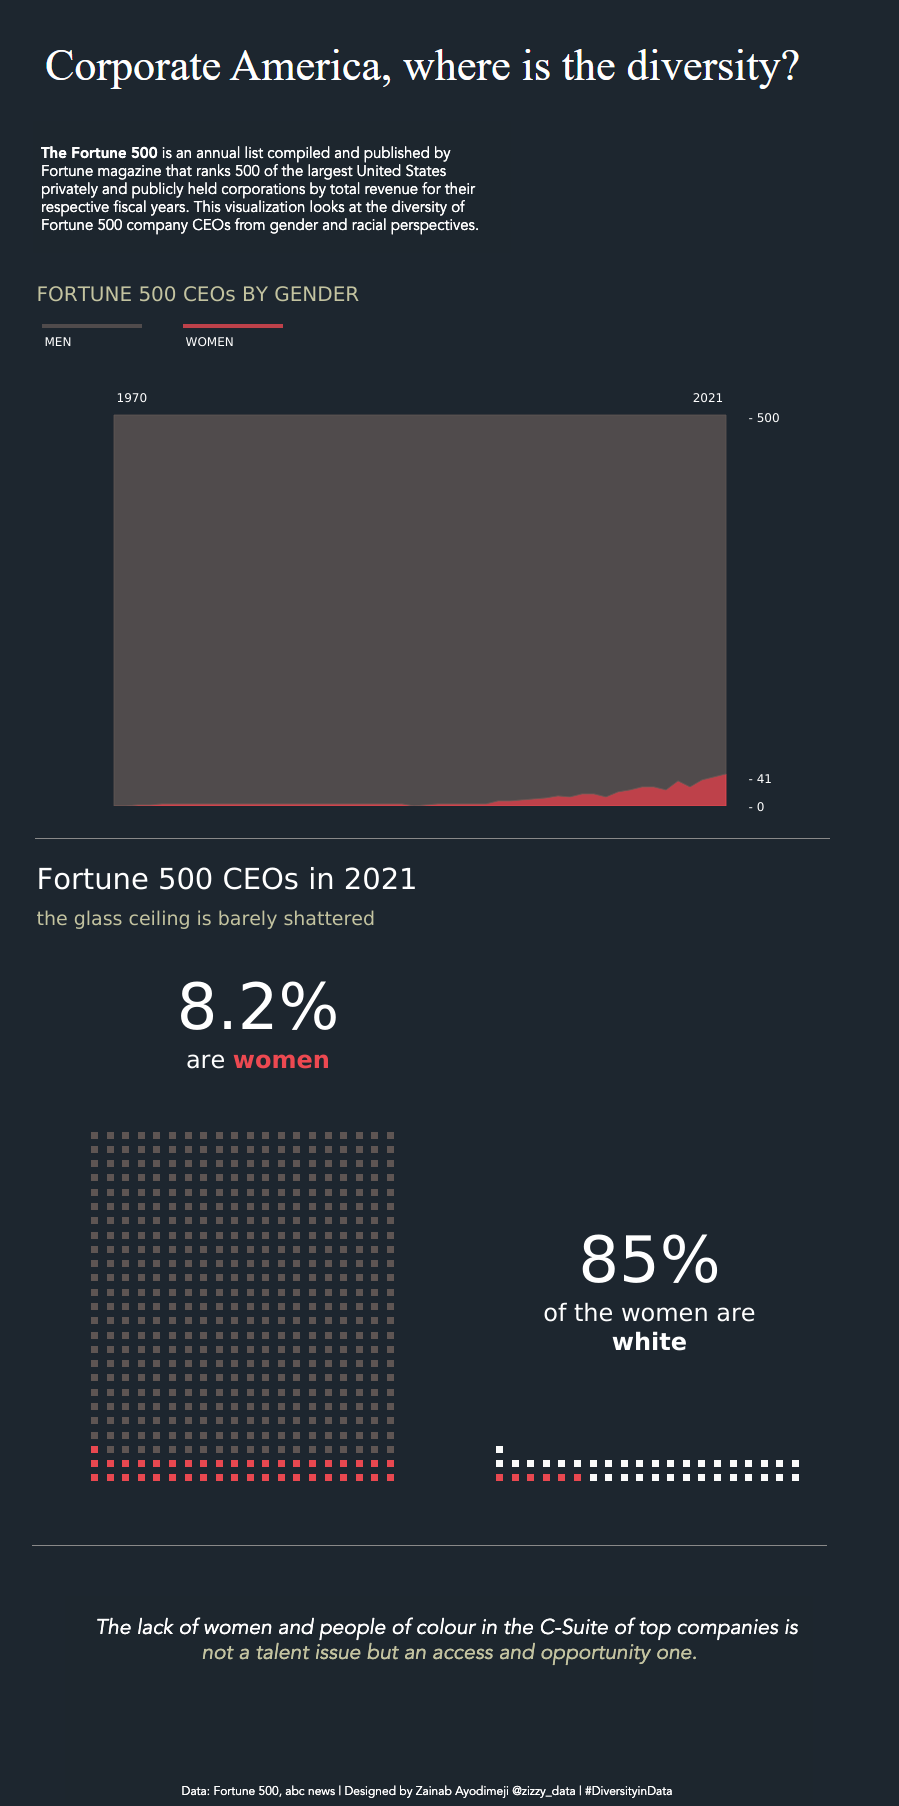
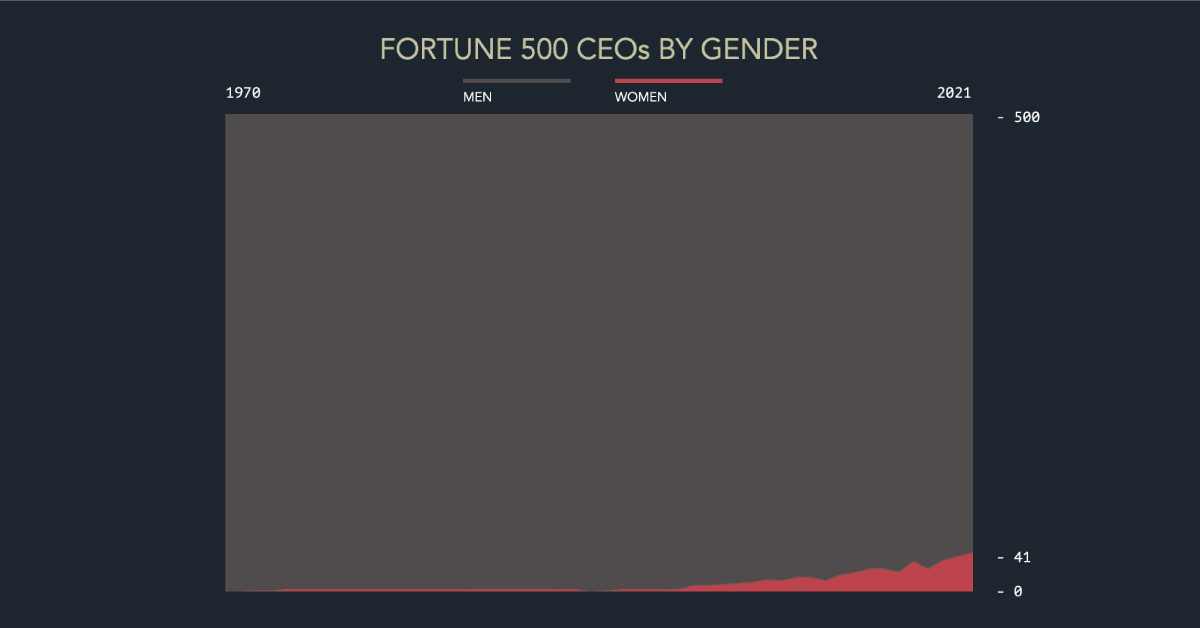
Five Decades of Fortune 500 CEOs
Since 1955, Fortune Magazine has released its annual Fortune 500 list that ranks the 500 largest U.S. companies, ranked by total revenue earned each fiscal year.
For the first 17 years of its publication, there were no female CEOs on the Fortune 500. Then in 1972, Katharine Graham became CEO of the Washington Post, making her the first-ever female CEO of a Fortune 500 company.
Following Graham, a few other women joined the ranks, such as Marion Sandler, co-CEO of Golden West Financial Corporation, and Linda Wachner, CEO of Warnaco Group. But apart from those few outliers, Fortune 500 CEOs remained almost exclusively male for the next few decades.
At the turn of the millennium, things started to change. Women-led companies started to appear more frequently on the Fortune 500. Here’s a breakdown that shows the number of women CEOs on the list, from 1999 to 2021:
| Year | Fortune 500 # of Women CEOs | % of Total |
|---|---|---|
| 1999 | 2 | 0.4% |
| 2000 | 2 | 0.4% |
| 2001 | 3 | 0.6% |
| 2002 | 7 | 1.4% |
| 2003 | 7 | 1.4% |
| 2004 | 8 | 1.6% |
| 2005 | 9 | 1.8% |
| 2006 | 10 | 2.0% |
| 2007 | 13 | 2.6% |
| 2008 | 12 | 2.4% |
| 2009 | 15 | 3.0% |
| 2010 | 15 | 3.0% |
| 2011 | 12 | 2.4% |
| 2012 | 18 | 3.6% |
| 2013 | 20 | 4.0% |
| 2014 | 24 | 4.8% |
| 2015 | 24 | 4.8% |
| 2016 | 21 | 4.2% |
| 2017 | 32 | 6.4% |
| 2018 | 24 | 4.8% |
| 2019 | 33 | 6.6% |
| 2020 | 39 | 7.8% |
| 2021 | 41 | 8.2% |
Slowly, women of color started to appear on the list as well. In 1999, Andrea Jung, the CEO of Avon, became the first East Asian female CEO in the Fortune 500. And in 2009, Xerox CEO Ursula Burns was the first Black woman to become CEO of a Fortune 500 company.
By 2021, 41 of the Fortune 500 companies were led by women—8.2% of the overall list.
While this increasing total is a clear trend, it’s important to note that women make up nearly 50% of the global population, meaning genders are still not equally represented in corporate leadership.
The Financial Benefits of Diverse Workplaces
Along with the number of societal and cultural benefits that come with a diverse workplace, research indicates that diversity can also be financially beneficial to corporations, and enhance a company’s bottom line.
A study by the Council of Foreign Relations found that gender equality in the workforce could add up to $28 trillion in global GDP.
According to the Council of Foreign Relations, a number of policy changes are needed to help close the gender gap in the workforce, such as legislation to promote women’s access to capital and financial services, or tax credits for childcare support.

This article was published as a part of Visual Capitalist's Creator Program, which features data-driven visuals from some of our favorite Creators around the world.


Leadership
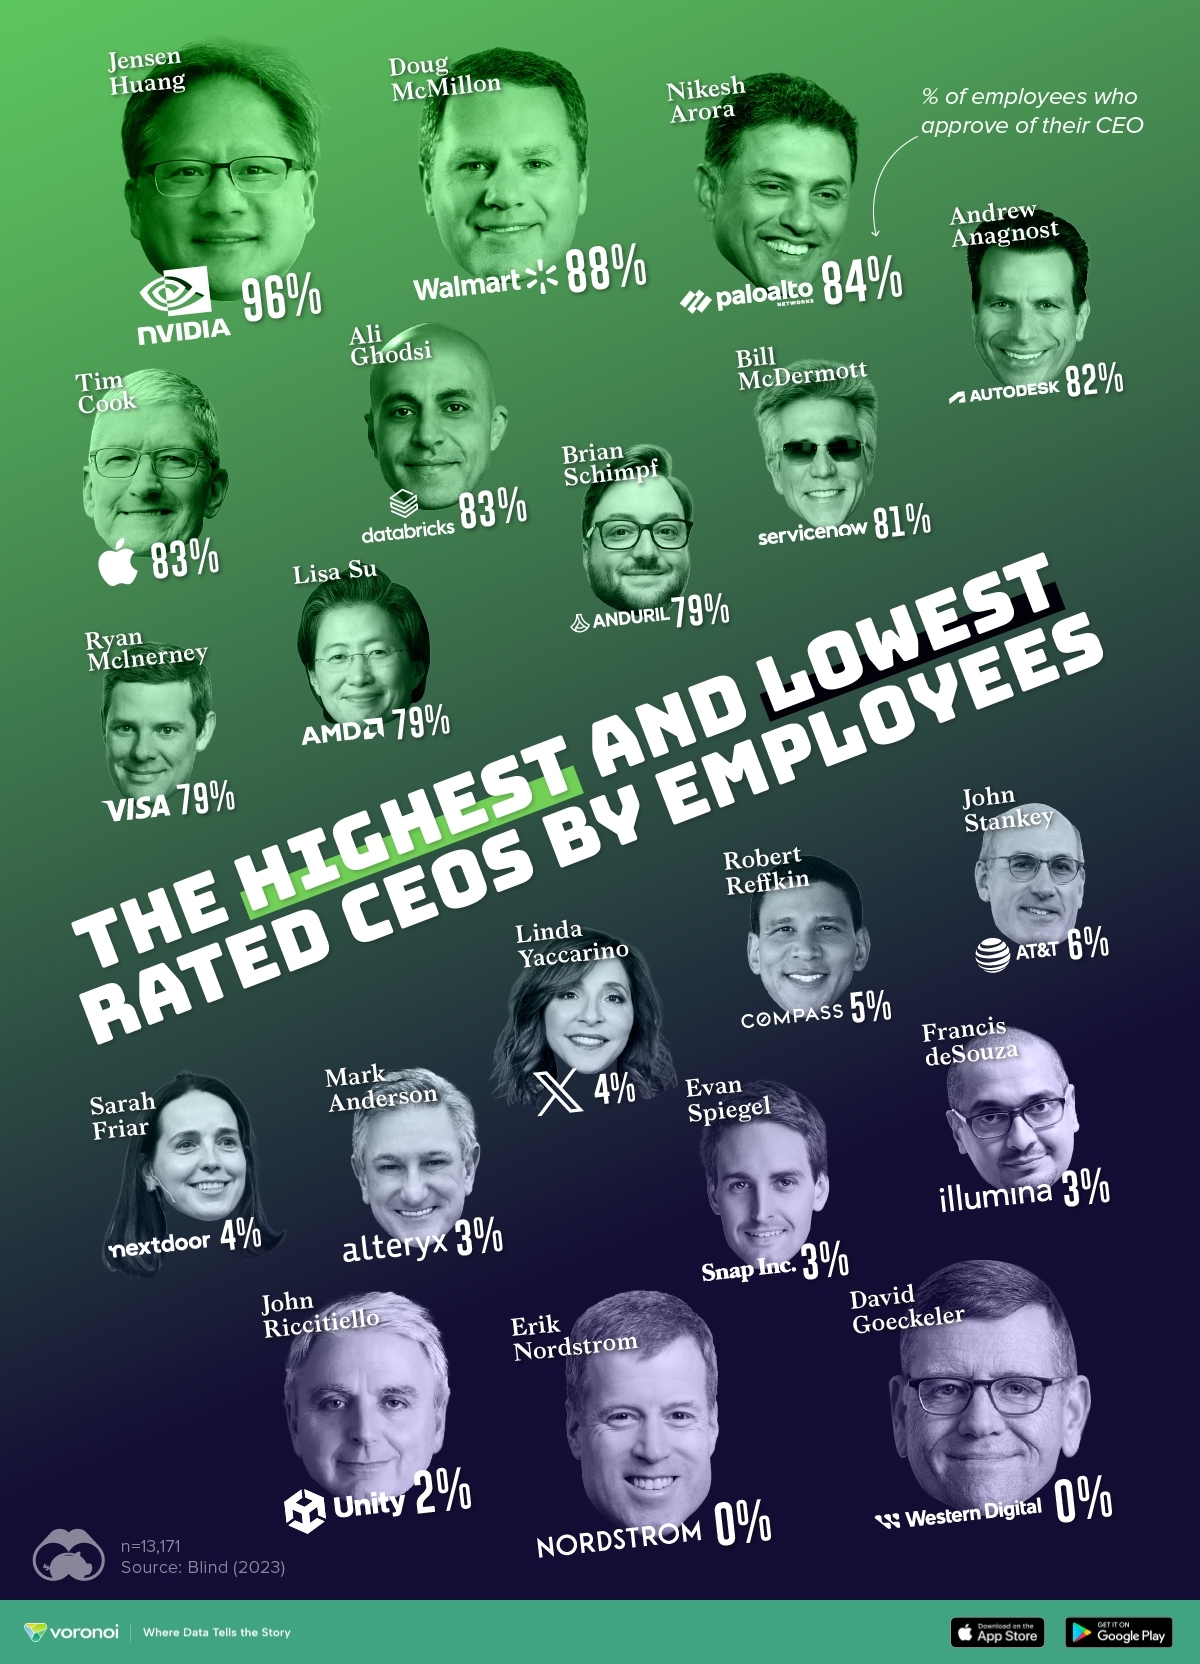
Who Are America’s Most Popular CEOs?
Social network Blind polled 13,000+ respondents on whether they approved or disapproved of the way their CEO handled the job, generating the approval rating of more than 100 CEOs.
Who Are America’s Most Popular CEOs?
What do the employees at America’s largest companies think of the leadership?
To answer that, we visualize CEO approval ratings gathered by professional social network Blind.
The results are based on a survey of 13,171 verified professionals in the U.S., conducted between August 18th–23rd, 2023. Respondents were asked if they approve or disapprove of the way their CEO is handling their job.
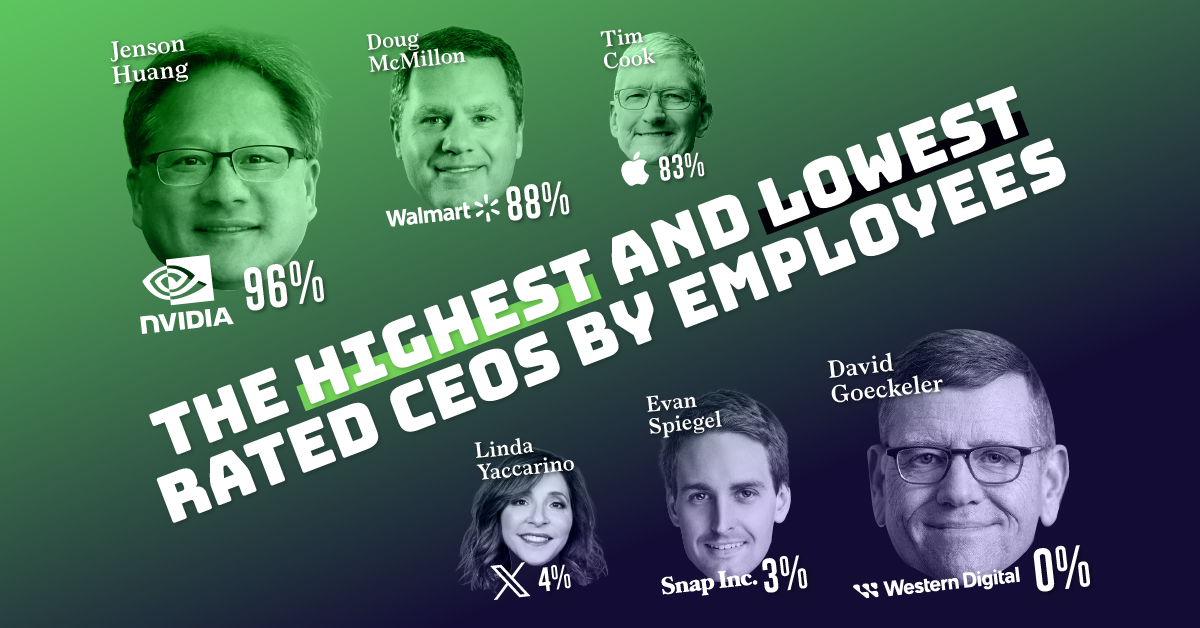
Top 10 Popular CEOs By Their Employees’ Approval Ratings
By far, the most popular CEO right now (according to Blind’s respondents anyway) is Nvidia’s Jensen Huang, with an astonishing 96% approval rating.
Huang’s numbers point to a theme in the data. Blind notes that there is a correlation between company stock performance and CEO approval rating. Nvidia’s critical role in the artificial intelligence hype train has sent shares up nearly 3x year-on-year. Their financials for the last three quarters show that profit is already up more than four-fold from last year.
Crucially, Huang also avoided layoffs that were otherwise rampant in the tech industry, helping his popularity amongst the staff.
Here are the top 10 most popular CEOs according to Blind’s poll.
| Rank | Company | CEO | Approve (%) |
|---|---|---|---|
| 1 | Nvidia | Jensen Huang | 96% |
| 2 | Walmart | Doug McMillon | 88% |
| 3 | Palo Alto Networks | Nikesh Arora | 84% |
| 4 | Apple | Tim Cook | 83% |
| 5 | Databricks | Ali Ghodsi | 83% |
| 6 | Autodesk | Andrew Anagnost | 82% |
| 7 | ServiceNow | Bill McDermott | 81% |
| 8 | Anduril Industries | Brian Schimpf | 79% |
| 9 | AMD | Lisa Su | 79% |
| 10 | Visa | Ryan Mclnerney | 79% |
In fact, the Blind survey uncovered that all of the 10 most popular CEOs, with the exception of Andrew Anag from AutoDesk, did not cut jobs in the last year.
The opposite is true for some of the lowest-rated CEOs.
The Least Popular CEOs By Employee Approval Ratings
Eric Nordstrom (Nordstrom) and David Goeckeler (Western Digital) shared the lowest approval rating possible in the poll: 0%. From Blind’s methodology section, this means not a single surveyed employee answered “strongly approve” or “somewhat approve” to the question.
Both companies cut nearly 200 jobs in 2023, with Nordstrom also responsible for the job losses amongst the company’s wage workers, who staffed the many retail stores the company shuttered.
Here’s the top 10 least popular CEOs according to Blind’s poll.
| Rank | Company | CEO | Approve (%) |
|---|---|---|---|
| 1 | Nordstrom | Erik Nordstrom | 0% |
| 2 | Western Digital | David Goeckeler | 0% |
| 3 | Unity Technologies | John Riccitiello | 2% |
| 4 | Illumina | Francis deSouza | 3% |
| 5 | Snap | Evan Spiegel | 3% |
| 6 | Alteryx | Mark Anderson | 3% |
| 7 | X (formerly Twitter) | Linda Yaccarino | 4% |
| 8 | Nextdoor | Sarah Friar | 4% |
| 9 | Compass | Robert Reffkin | 5% |
| 10 | AT&T | John Stankey | 6% |
Also featuring on this list of least-liked CEOs: Evan Spiegel (3%), who reduced Snap’s workforce by a fifth and Linda Yaccarino (4%), who heads X (formerly Twitter) that has been in turmoil since Elon Musk acquired the company in October, 2022.

-

 Markets1 week ago
Ranked: The Largest U.S. Corporations by Number of Employees
-

 Green3 weeks ago
Ranked: Top Countries by Total Forest Loss Since 2001
-

 Money2 weeks ago
Where Does One U.S. Tax Dollar Go?
-

 Automotive2 weeks ago
Almost Every EV Stock is Down After Q1 2024
-

 AI2 weeks ago
The Stock Performance of U.S. Chipmakers So Far in 2024
-

 Markets2 weeks ago
Charted: Big Four Market Share by S&P 500 Audits
-

 Real Estate2 weeks ago
Ranked: The Most Valuable Housing Markets in America
-

 Money2 weeks ago
Which States Have the Highest Minimum Wage in America?