Misc
Missing Migrants: Visualizing Lost Lives Along the Mediterranean Sea
Article/Editing:
Missing Migrants: Lost Lives Along the Mediterranean Sea
Each year, thousands of migrants flee war-torn countries in search of asylum.
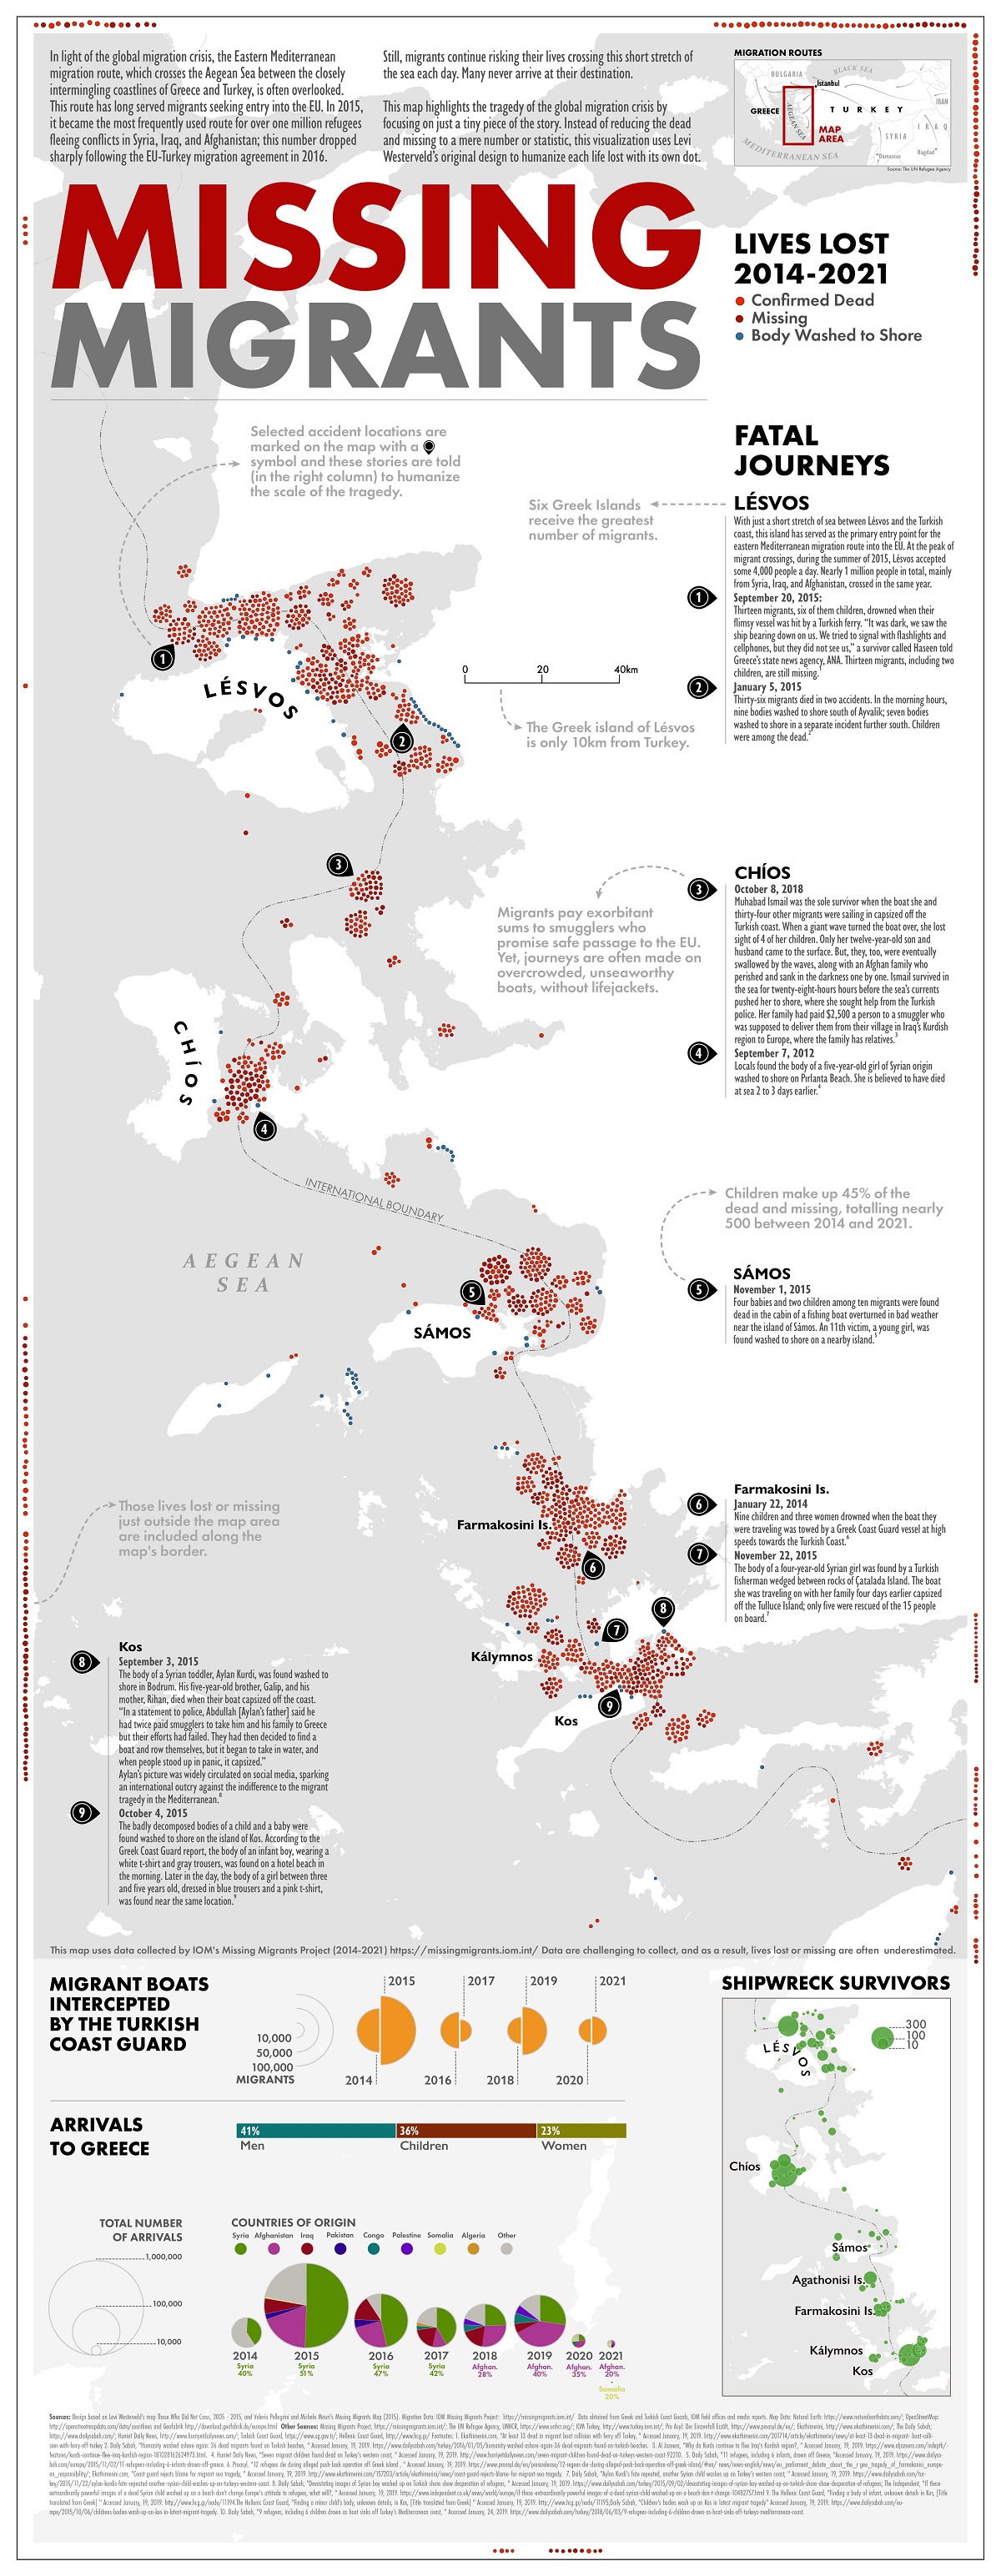
Even before the migrant crisis caused by the Russo-Ukrainian War, Europe has been the focal point in the past decade. Many refugees from conflicts in Africa and Asia, including those from Syria, Afghanistan, and Iraq, and have traveled to Europe along the Eastern Mediterranean migration route—a dangerous passage across the Aegean Sea that weaves along the coastlines of Greece and Turkey.
The journey to reach Europe is risky, and some of the migrants who attempt the crossing never make it. Using data from the International Organization for Migration (IOM), this map by Elbie Bentley visualizes the reported deaths and disappearances along the Eastern Mediterranean from 2014 to 2021.
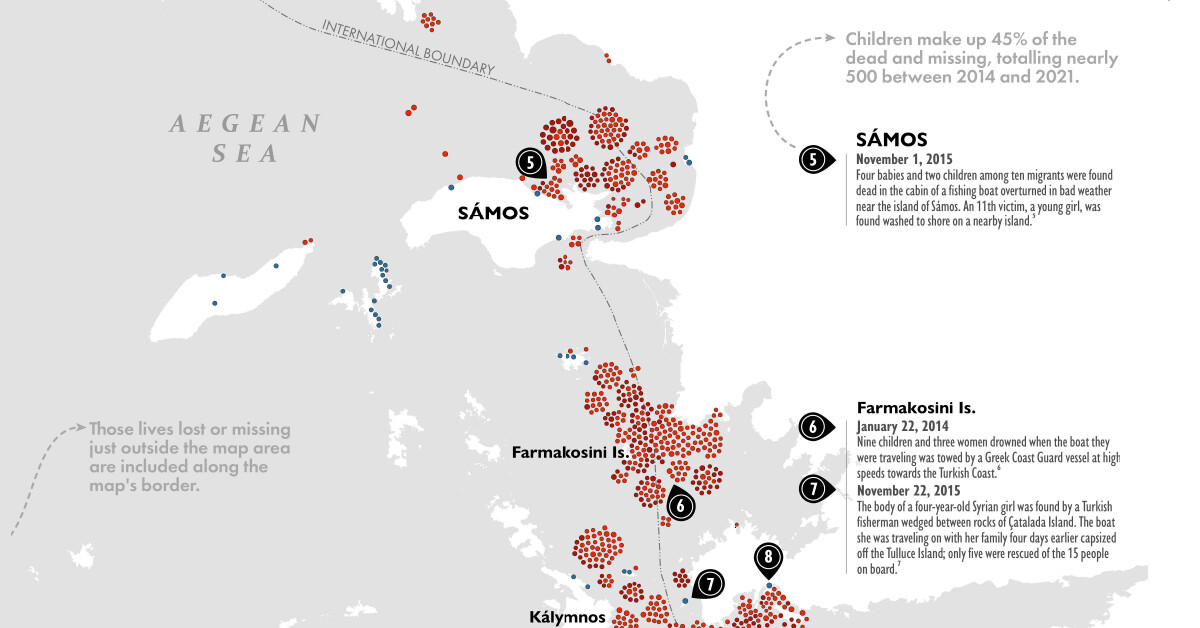
Inspired by Levi Westerveld’s Those Who Did Not Cross, each lost life is captured with its own dot, in an effort to humanize the data.
The 2015 European Crisis
1,863 deaths and disappearances were reported along the Eastern Mediterranean between the years of 2014 and 2021.
Almost half of those recordings came from 2015 during the European migrant crisis, when a record-breaking one million people sought asylum in the EU.
About 800,000 of the one million migrants traveled to Greece through Turkey, with many of the refugees escaping Syria’s civil war.
| European Migrant Crisis by Year | Reported deaths and disappearances |
|---|---|
| 2014 | 101 |
| 2015 | 804 |
| 2016 | 434 |
| 2017 | 62 |
| 2018 | 174 |
| 2019 | 71 |
| 2020 | 106 |
| 2021 | 111 |
In an attempt to control the situation, the EU and Turkey signed a migration deal in March 2016 that agreed to send back migrants who did not receive official permission to enter the EU.
Though the agreement drastically reduced the number of people traveling through Turkey to Greece, thousands still make the dangerous journey across the Aegean Sea each year. In 2021, 111 people were reported dead or missing along the Eastern Mediterranean.
The Dangerous Journey
According to the International Organization for Migration, the most common cause of death along the Eastern Mediterranean is drowning.
While the journey is only 5.4 nautical miles or less, transportation conditions to Greece are not always safe. Boats are sometimes forced into tumultuous waters, according to migrants who’ve experienced the journey firsthand.
And these boats are often severely underequipped and overcrowded—rubber dinghies designed to carry a dozen people are sometimes loaded with up to 60 passengers.
Safer means of transportation are available, but the costs are steep. According to Frontex, the European Border and Coast Guard Agency, it could cost a family an average of €10,000 to travel by yacht.
Rescue Efforts for Migrants is Needed
Further complicating the dangerous journey is a lack of rescue resources.
According to a 2021 report by IOM, the EU does not currently have a dedicated search and rescue team. Instead, the onus is on individual states to patrol their own waters.
Until the crisis is better addressed or local conflicts begin to resolve, there will be an urgent need for increased rescue operations and a standardized migration protocol to help mitigate the number of migrant deaths and disappearances each year.

This article was published as a part of Visual Capitalist's Creator Program, which features data-driven visuals from some of our favorite Creators around the world.


VC+
VC+: Get Our Key Takeaways From the IMF’s World Economic Outlook
A sneak preview of the exclusive VC+ Special Dispatch—your shortcut to understanding IMF’s World Economic Outlook report.

Have you read IMF’s latest World Economic Outlook yet? At a daunting 202 pages, we don’t blame you if it’s still on your to-do list.
But don’t worry, you don’t need to read the whole April release, because we’ve already done the hard work for you.
To save you time and effort, the Visual Capitalist team has compiled a visual analysis of everything you need to know from the report—and our VC+ Special Dispatch is available exclusively to VC+ members. All you need to do is log into the VC+ Archive.
If you’re not already subscribed to VC+, make sure you sign up now to access the full analysis of the IMF report, and more (we release similar deep dives every week).
For now, here’s what VC+ members get to see.
Your Shortcut to Understanding IMF’s World Economic Outlook
With long and short-term growth prospects declining for many countries around the world, this Special Dispatch offers a visual analysis of the key figures and takeaways from the IMF’s report including:
- The global decline in economic growth forecasts
- Real GDP growth and inflation forecasts for major nations in 2024
- When interest rate cuts will happen and interest rate forecasts
- How debt-to-GDP ratios have changed since 2000
- And much more!

Get the Full Breakdown in the Next VC+ Special Dispatch
VC+ members can access the full Special Dispatch by logging into the VC+ Archive, where you can also check out previous releases.
Make sure you join VC+ now to see exclusive charts and the full analysis of key takeaways from IMF’s World Economic Outlook.
Don’t miss out. Become a VC+ member today.
What You Get When You Become a VC+ Member
VC+ is Visual Capitalist’s premium subscription. As a member, you’ll get the following:
- Special Dispatches: Deep dive visual briefings on crucial reports and global trends
- Markets This Month: A snappy summary of the state of the markets and what to look out for
- The Trendline: Weekly curation of the best visualizations from across the globe
- Global Forecast Series: Our flagship annual report that covers everything you need to know related to the economy, markets, geopolitics, and the latest tech trends
- VC+ Archive: Hundreds of previously released VC+ briefings and reports that you’ve been missing out on, all in one dedicated hub
You can get all of the above, and more, by joining VC+ today.

-

 Mining1 week ago
Gold vs. S&P 500: Which Has Grown More Over Five Years?
-

 Markets2 weeks ago
Ranked: The Most Valuable Housing Markets in America
-

 Money2 weeks ago
Which States Have the Highest Minimum Wage in America?
-

 AI2 weeks ago
Ranked: Semiconductor Companies by Industry Revenue Share
-

 Markets2 weeks ago
Ranked: The World’s Top Flight Routes, by Revenue
-

 Countries2 weeks ago
Population Projections: The World’s 6 Largest Countries in 2075
-

 Markets2 weeks ago
The Top 10 States by Real GDP Growth in 2023
-

 Demographics2 weeks ago
The Smallest Gender Wage Gaps in OECD Countries