Science
Comparing the Sizes of Dinosaurs in the Lost World
Article/Editing:
Click to view a larger version of the graphic.
Comparing the Sizes of Dinosaurs in the Lost World
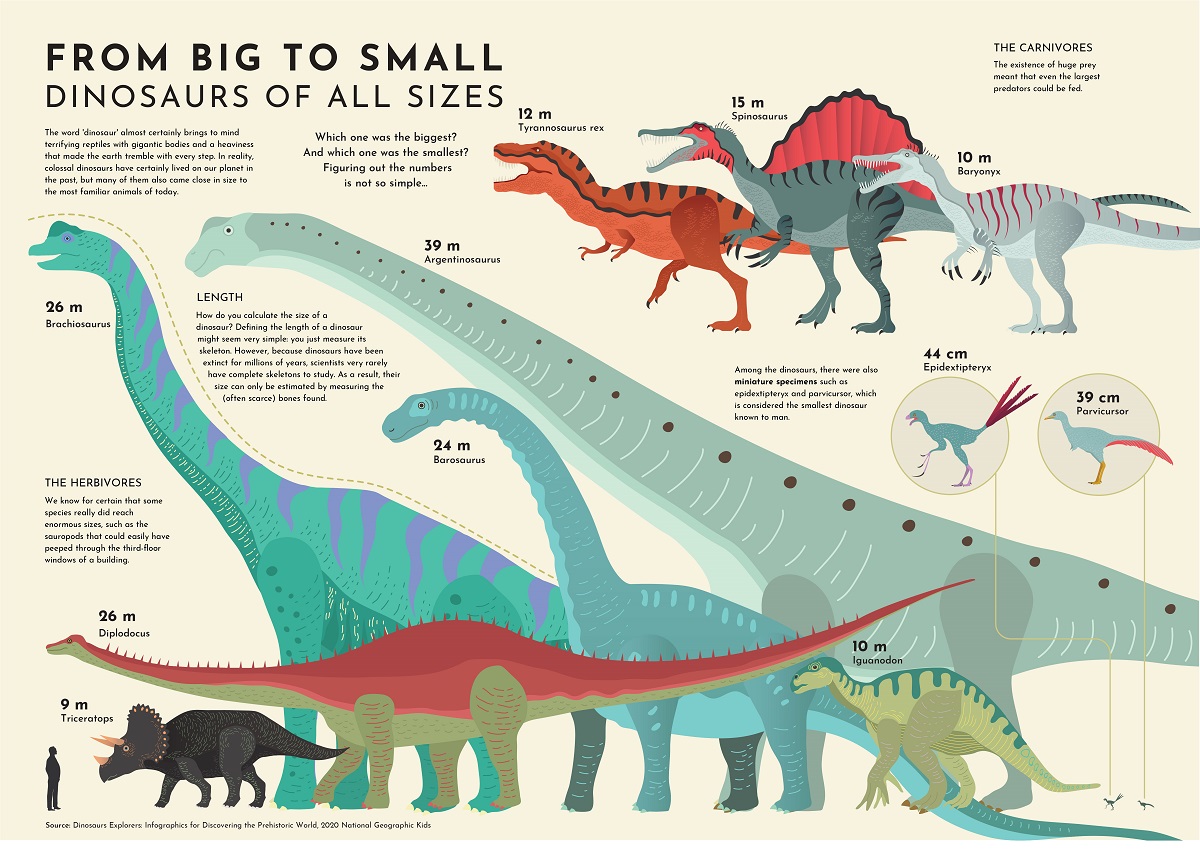
When dinosaurs inhabited the Earth over 66 million years ago, their sizes and species varied dramatically.
While geological evidence is far from complete, fossil evidence suggests that the largest dinosaurs were comparable to the length of a Boeing 737 or the weight of 12 elephants. Meanwhile, the smallest were similar to the size of a chicken or bird.
In this infographic from Giulia De Amicis we compare the sizes of dinosaurs to get a sense of their vast scale and diversity.
Sizes of Dinosaurs Compared to Modern Day Life
Towering as high as 39 meters, the Argentinosaurus or ‘Argentina lizard’ is currently thought to be the largest dinosaur ever discovered. It was a sauropod, a subgroup of dinosaurs with very long necks and long tails, four wide legs for support, and relatively smaller heads.
In 1987, its bones were unearthed in the Patagonia region of Argentina, a destination well-known for prehistoric fossils. For comparison’s sake, the length of the Argentinosaurus is as high as a 13-story building.
| Name | Length (Meters) | Length (Feet) |
|---|---|---|
| Argentinosaurus | 39 m | 128 ft |
| Blue Whale | 30 m | 98 ft |
| Brachiosaurus | 26 m | 85 ft |
| Diplodocus | 26 m | 85 ft |
| Barosaurus | 24 m | 79 ft |
| Spinosaurus | 15 m | 49 ft |
| Tyrannosaurus rex | 12 m | 30 ft |
| Iguanodon | 10 m | 33 ft |
| Baryonyx | 10 m | 33 ft |
| Triceratops | 9 m | 30 ft |
| African Elephant | 7 m | 23 ft |
| Human | 1.8 m | 6 ft |
| Epidextipteryx | 44 cm | 1.4 ft |
| Parvicursor | 39 cm | 1.3 ft |
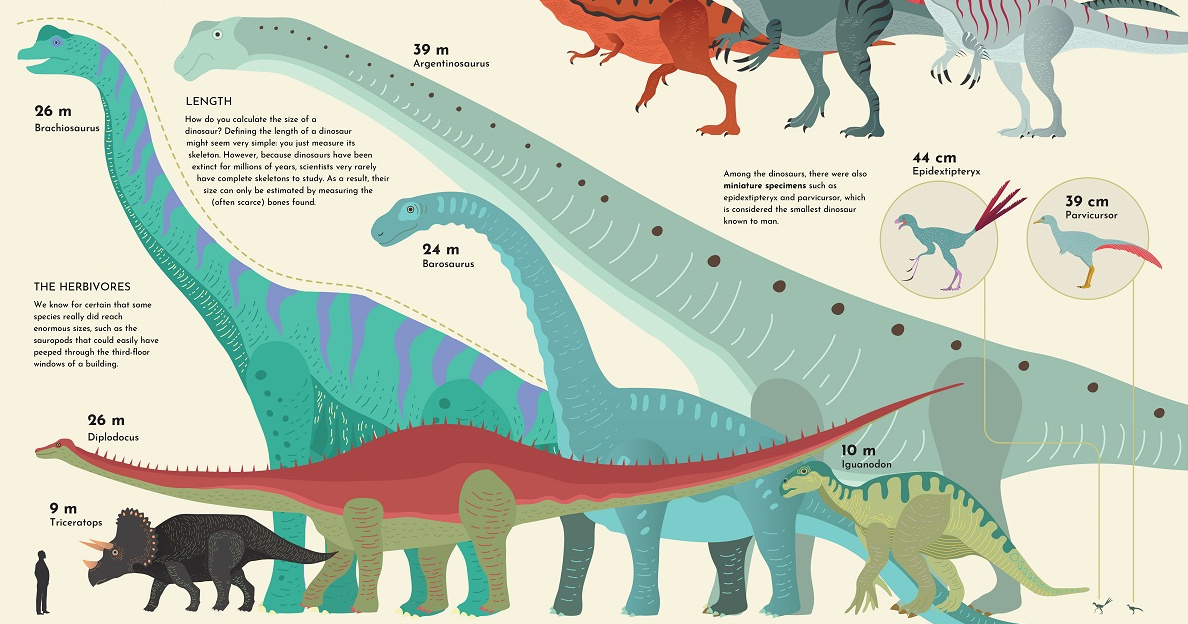
Other sauropods were also massive, including the Brachiosaurus, or ‘arm lizard’—it was roughly the size of a blue whale.
Fossil evidence discovered in 1900 in the Colorado Valley showed that the Brachiosaurus lived in the late Jurassic Period, 140-155 million years ago. Similarly, the Tyrannosaurus rex (12 m) also lived in North America, but during the Late Cretaceous period some 80 million years later.
Among the smallest dinosaurs were the Parvicursor (literally ‘small runner’) and Epidextipteryx (literally ‘display feather’). Both were under 45 centimeters, similar to a modern mid-sized bird.
The Age of Giants
Not only were the dinosaurs sheerly colossal in size, but so too was their mass.
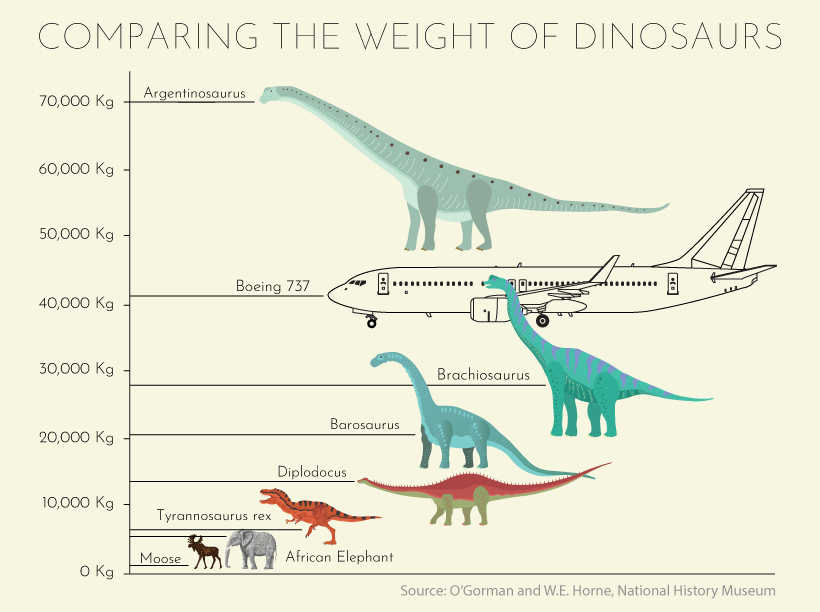
Consider how the Argentinosaurus was about the weight of a typical rocket at 75,000 kg, or twice the mass of a Boeing 737. And there were many heavy dinosaurs, such as the Diplodocus (meaning ‘double beam’) which weighed a hefty 13,000 kg.
Sizes of Dinosaurs In Question
How do we know these sizes and weights?
Scientists use discovered bones, impressions, and completed fossils to come up with ranges of estimates. The more complete a fossil and the more similar fossils exist, the more accurate the estimate that scientists can make.
But amid discoveries of the largest dinosaurs on earth, many paleontologists have questioned size claims. Due to incomplete fossil records, some estimates are based on as little as a handful of bone records. For instance, just 20% of the Brachiosaurus’ skeleton has been discovered.
At the same time, techniques such as 3-D scanning continue to be refined, and there are now many different techniques being used to estimate size. That said, one study has shown that even diverse sizing techniques typically arrive at similar results.
With access to virtual fossils, broad archeological datasets, as well as advancing techniques and new discoveries, the understanding of the sizes of dinosaurs continues to evolve.

This article was published as a part of Visual Capitalist's Creator Program, which features data-driven visuals from some of our favorite Creators around the world.


Science
Visualizing the Average Lifespans of Mammals
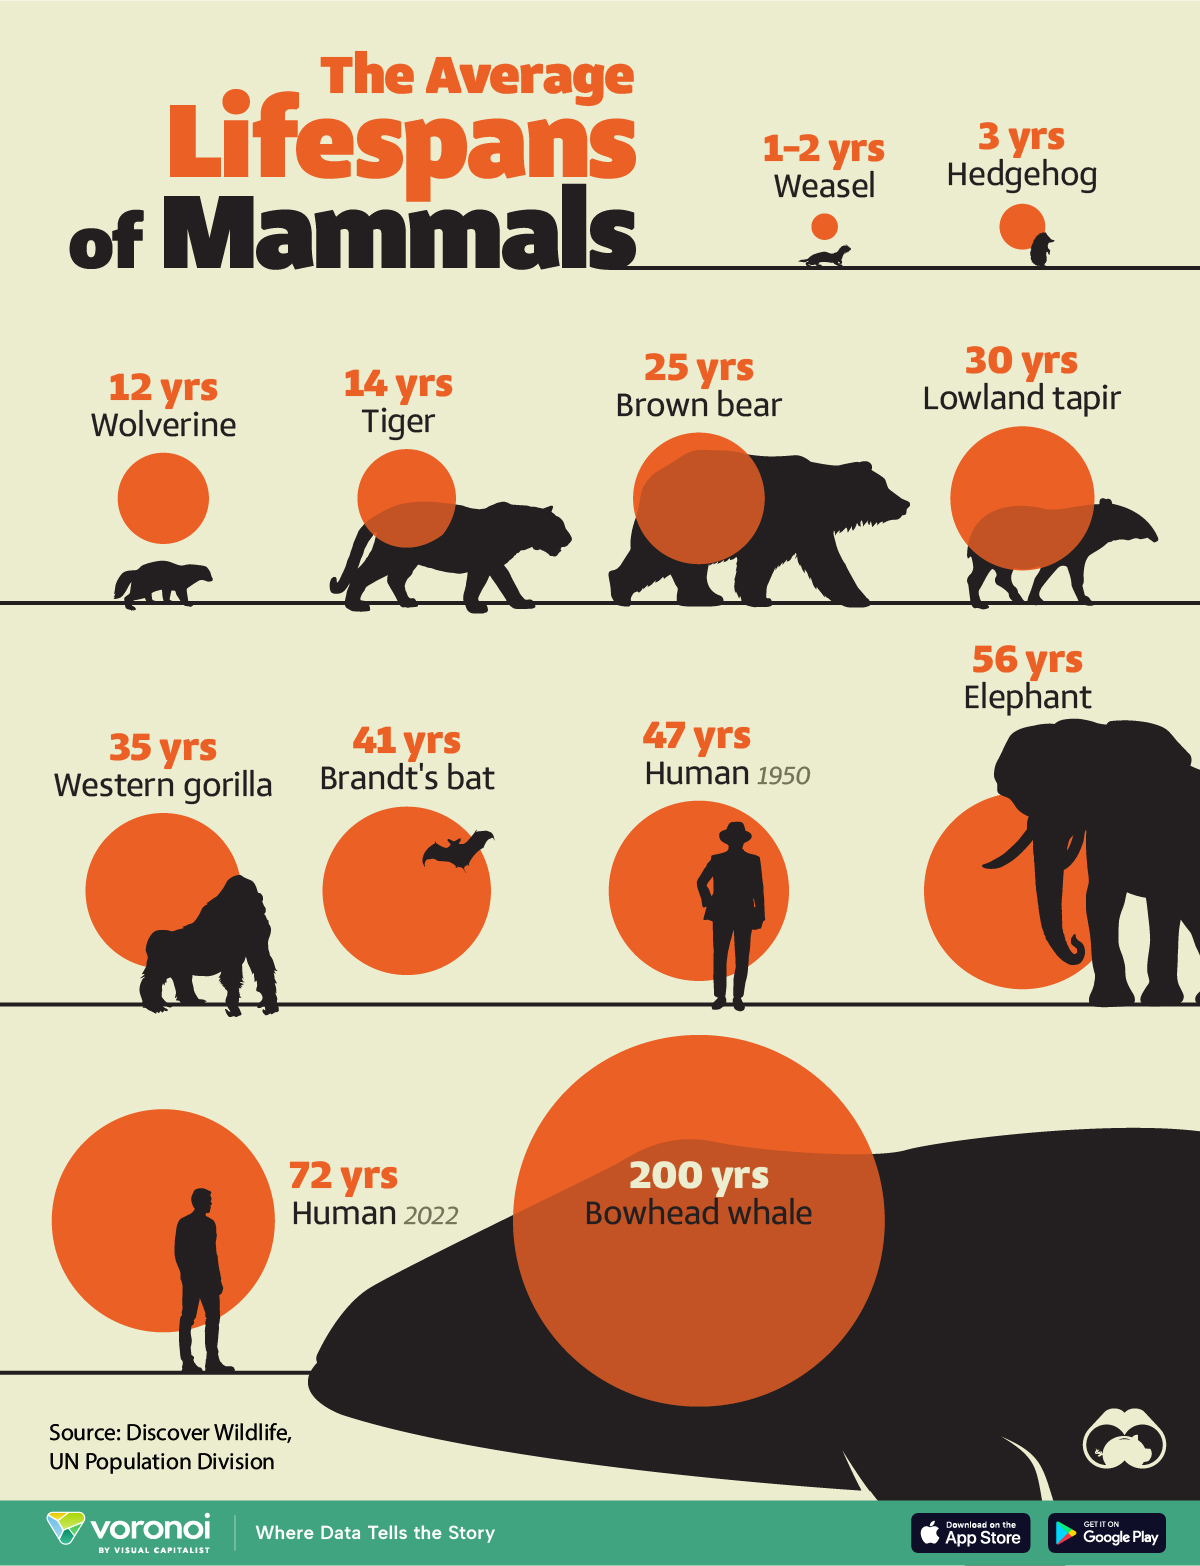
While smaller animals such as weasels typically live 1-2 years, larger counterparts can thrive for decades.
Visualizing the Average Lifespans of Mammals
This was originally posted on our Voronoi app. Download the app for free on iOS or Android and discover incredible data-driven charts from a variety of trusted sources.
Mammals, though comprising a small fraction of Earth’s creatures, hold vital ecological roles globally. They are crucial for maintaining ecosystem health through services like pollination, seed dispersal, and predator-prey dynamics.
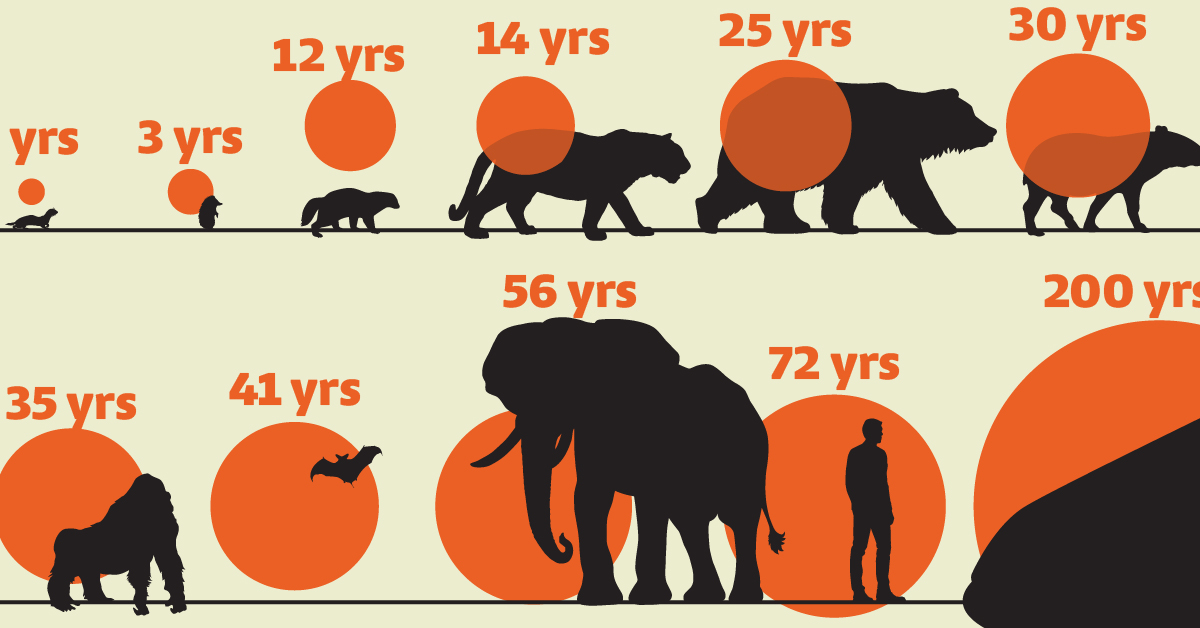
In this visualization, we depict the average lifespans of mammals, using data from Discover Wildlife and the United Nations.
Human Lifespans on the Rise
Defined as warm-blooded creatures with hair or fur, mammals nurse their young with milk from mammary glands. While smaller animals such as weasels typically live 1-2 years, larger counterparts like elephants can thrive for decades, and bowhead whales can live for 200 years, or even longer.
| Animal | Average lifespan (years) |
|---|---|
| Weasel | 1 to 2 |
| Hedgehog | 3 |
| Wolverine | 12 |
| Tiger | 14 |
| Brown bear | 25 |
| Lowland tapir | 30 |
| Western gorilla | 35 |
| Brandt's bat | 41 |
| Humans (1950) | 47 |
| Elephant | 56 |
| Humans (2022) | 72 |
| Bowhead whale | 200 |
Notably, human lifespans have experienced a remarkable surge. According to the UN Population Division, the global average life expectancy has surged from 47 years in 1950 to 72 years in 2022, marking a 25-year increase. This is attributed to advancements in nutrition, medication, and essential resources.
However, as human longevity flourishes, it can have an adverse effect on wildlife mammal populations. To put this into numbers, over the past 100,000 years, the surge in human population has precipitated an 85% reduction in wild mammal biomass.
Today, livestock dominates 62% of the world’s mammal biomass, with humans accounting for 34%, while wild mammals comprise only 4%.
Despite a decline in mammal diversity, the total biomass of terrestrial mammals has significantly increased, expanding approximately ninefold over the past 10,000 years.
Curious to learn more about mammals? Check out this graphic that shows the biomass of all the world’s mammals.

-

 Green1 week ago
Ranked: The Countries With the Most Air Pollution in 2023
-

 Automotive2 weeks ago
Almost Every EV Stock is Down After Q1 2024
-

 AI2 weeks ago
The Stock Performance of U.S. Chipmakers So Far in 2024
-

 Markets2 weeks ago
Charted: Big Four Market Share by S&P 500 Audits
-

 Real Estate2 weeks ago
Ranked: The Most Valuable Housing Markets in America
-

 Money2 weeks ago
Which States Have the Highest Minimum Wage in America?
-

 AI2 weeks ago
Ranked: Semiconductor Companies by Industry Revenue Share
-

 Travel2 weeks ago
Ranked: The World’s Top Flight Routes, by Revenue