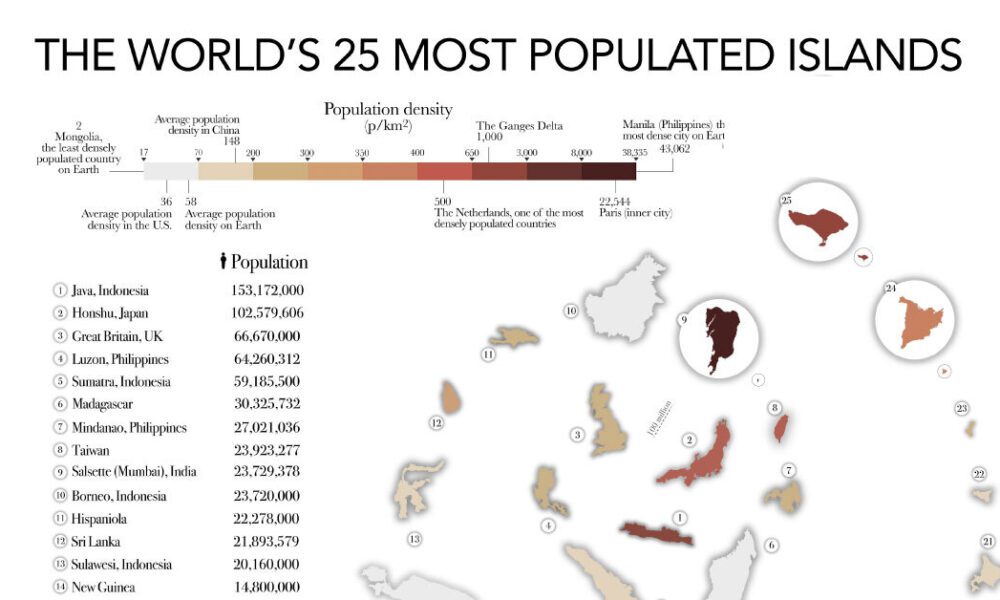
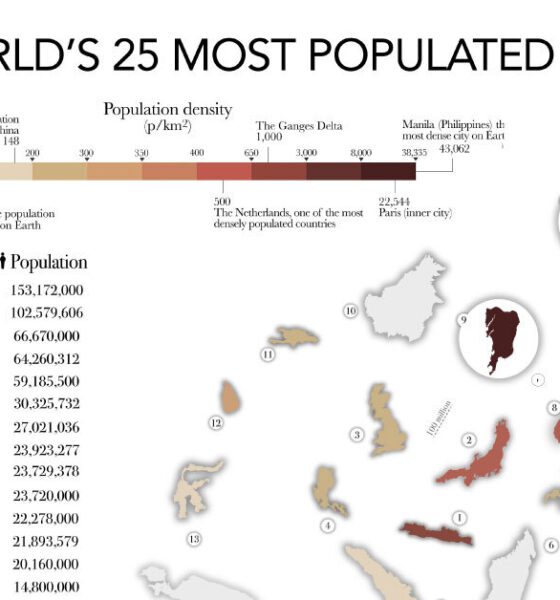

The most populated islands of the earth are teeming hubs of human activity, a far cry from the remote paradises...
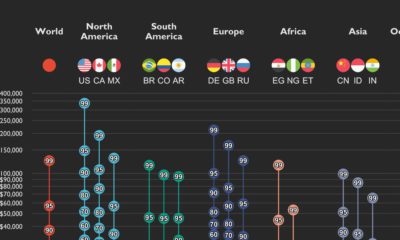

This graphic shows income distributions in 16 different countries around the world, using data from the World Inequality Database.
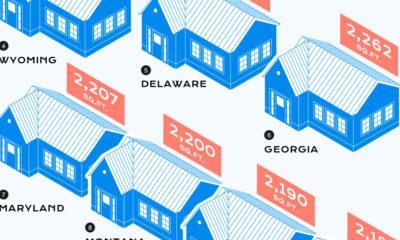

Over the last century, the median home size in the U.S. has skyrocketed. Here’s a look at which states have the biggest and smallest homes.


This graphic shows the 32 teams that will be playing in the 2022 FIFA World Cup, and breaks down the groups and each team's World Ranking
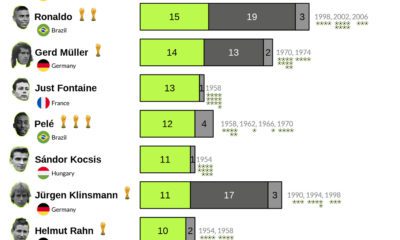

Who are history's top international goal scorers? These graphics highlight the players with the most goals scored in FIFA World Cup history.
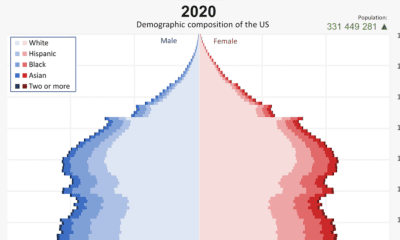

From 1901 to 2020, the U.S. population has changed significantly. This video reveals the change in America's demographics over 100+ years.
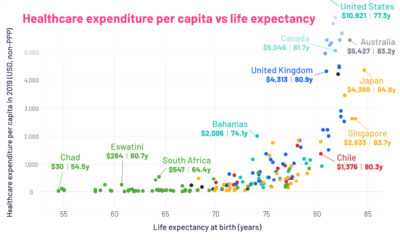

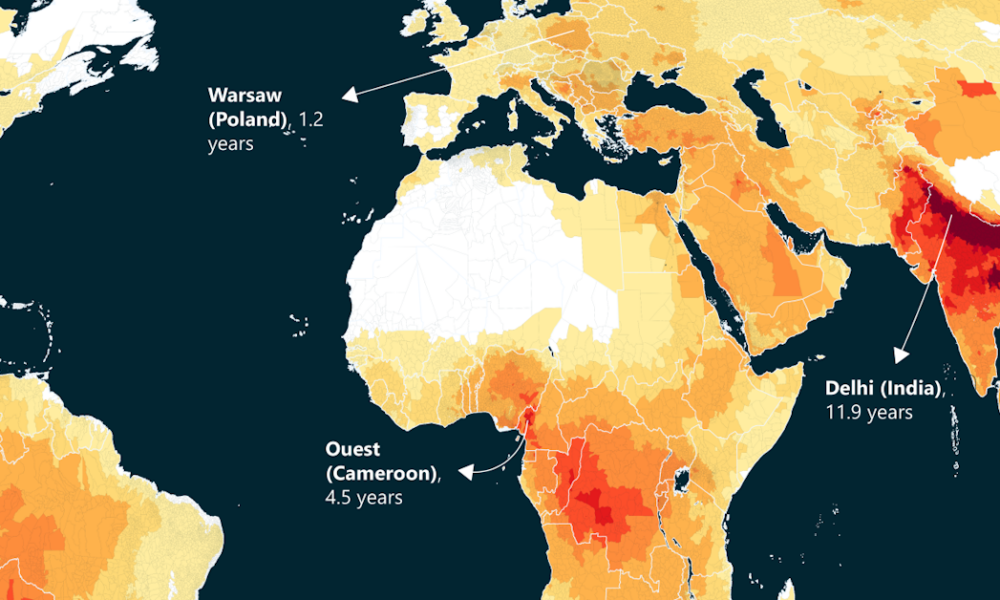
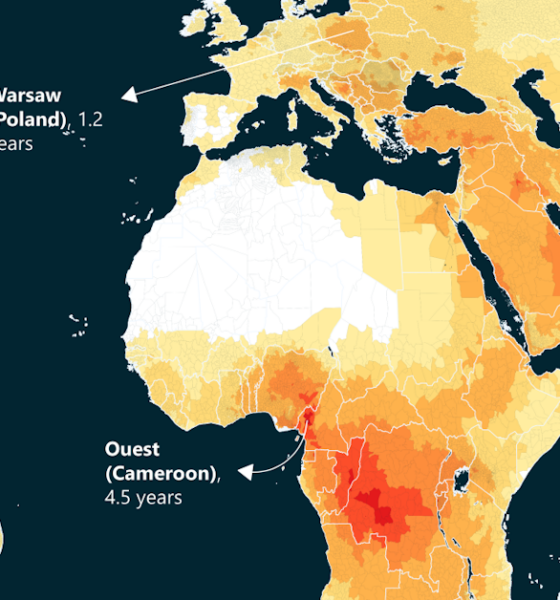
This graphic looks at average life expectancies in countries around the world, compared to each country's healthcare spending per capita.
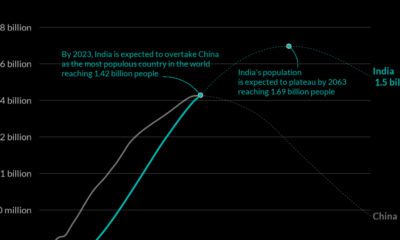

India's population growth is happening faster than predicted. The country will overtake China as the world’s most populated country in 2023.
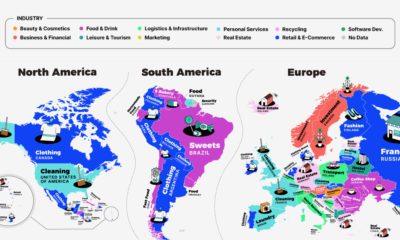

This series of maps shows a regional breakdown of the most popular types of businesses people want to start, based on online search results.


This chart looks at some of the common items that are sold on the Dark Web, and how much they sold for on average in 2022.
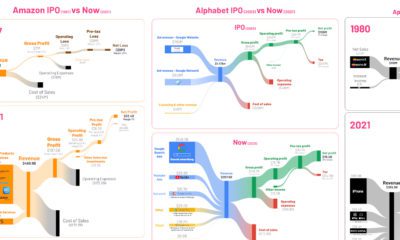

See the financials of major companies like Amazon and Tesla visualized, comparing their first year post-IPO with the most recent numbers.