Real Estate
The Median Home Size in Every U.S. State in 2022
Article/Editing:
The Median Home Size in Every U.S. State in 2022
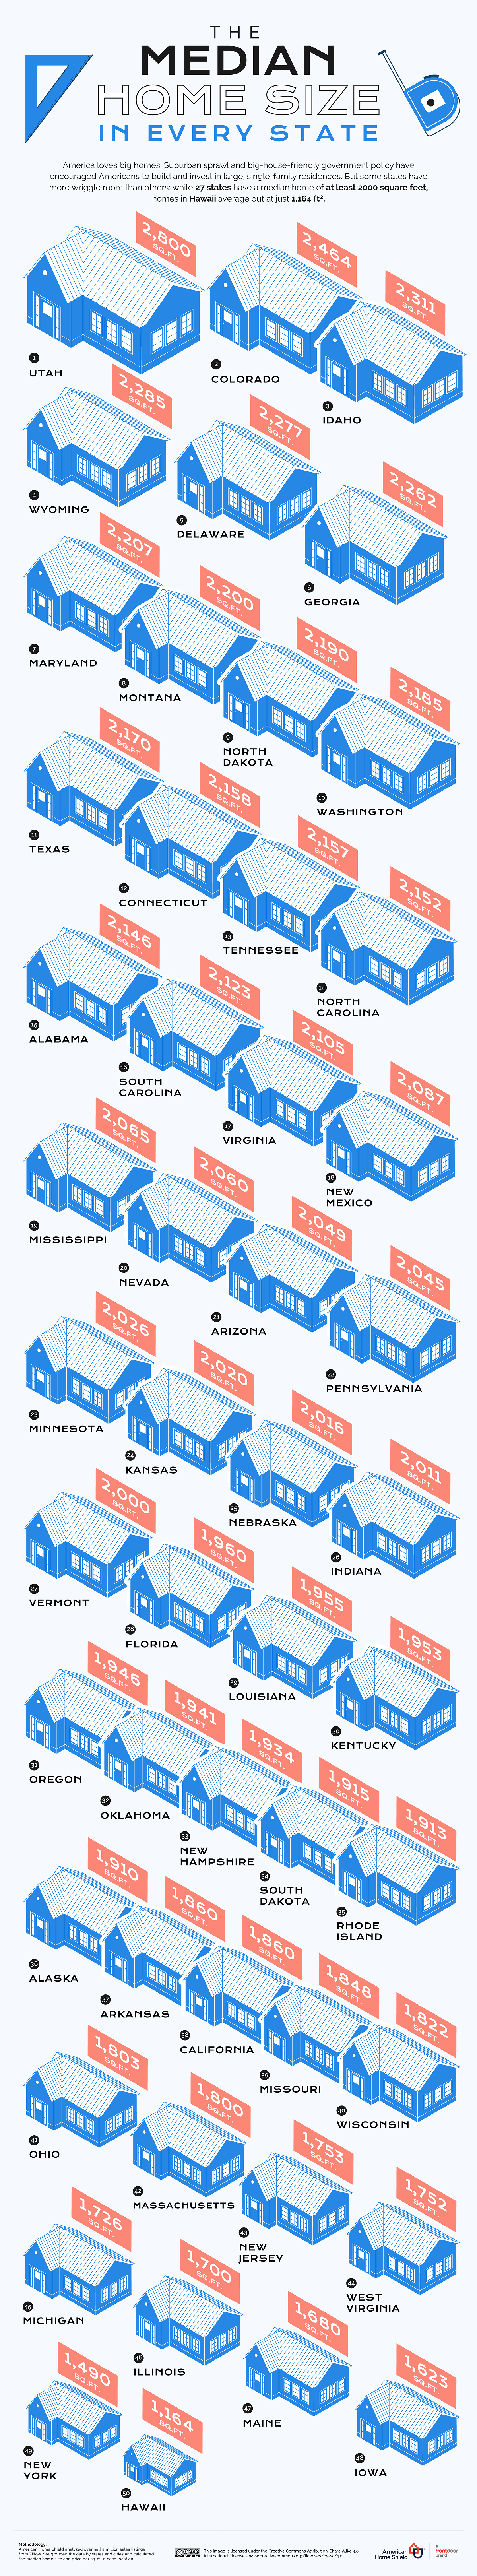
Over the last century, home sizes in the U.S. have skyrocketed. In 1949, the typical single-family home was just 909 square feet—by 2021, it had shot up to 2,480 square feet.
While U.S. homes are getting larger on the whole, they still vary drastically depending on the location. What areas in the U.S. have the largest homes, and which ones have the smallest?
This graphic by American Home Shield uses data from the 2022 American Home Size Index to show the median home size in every U.S. state.
The 2022 American Home Size Index
The index uses data from 474,157 listings of both houses and condos for sale on Zillow as of May 2022. After the data was compiled, it was organized by state and city, and the median home size was then calculated for each area.
According to the findings, there was a strong correlation with the size of a home and the age of the area’s housing stock. For instance, Utah is the U.S. state with the largest median home size at 2,800 square feet. And since the state’s median home was built in 1989, it has the third-youngest home stock of any state across the country.
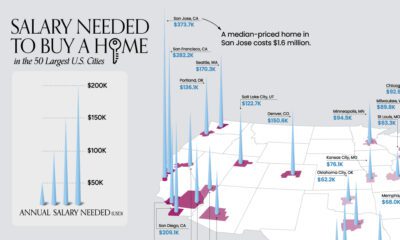
This trend is apparent on a city-level as well. Here’s a look at home sizes across America’s top 50 most populated cities (with available data):
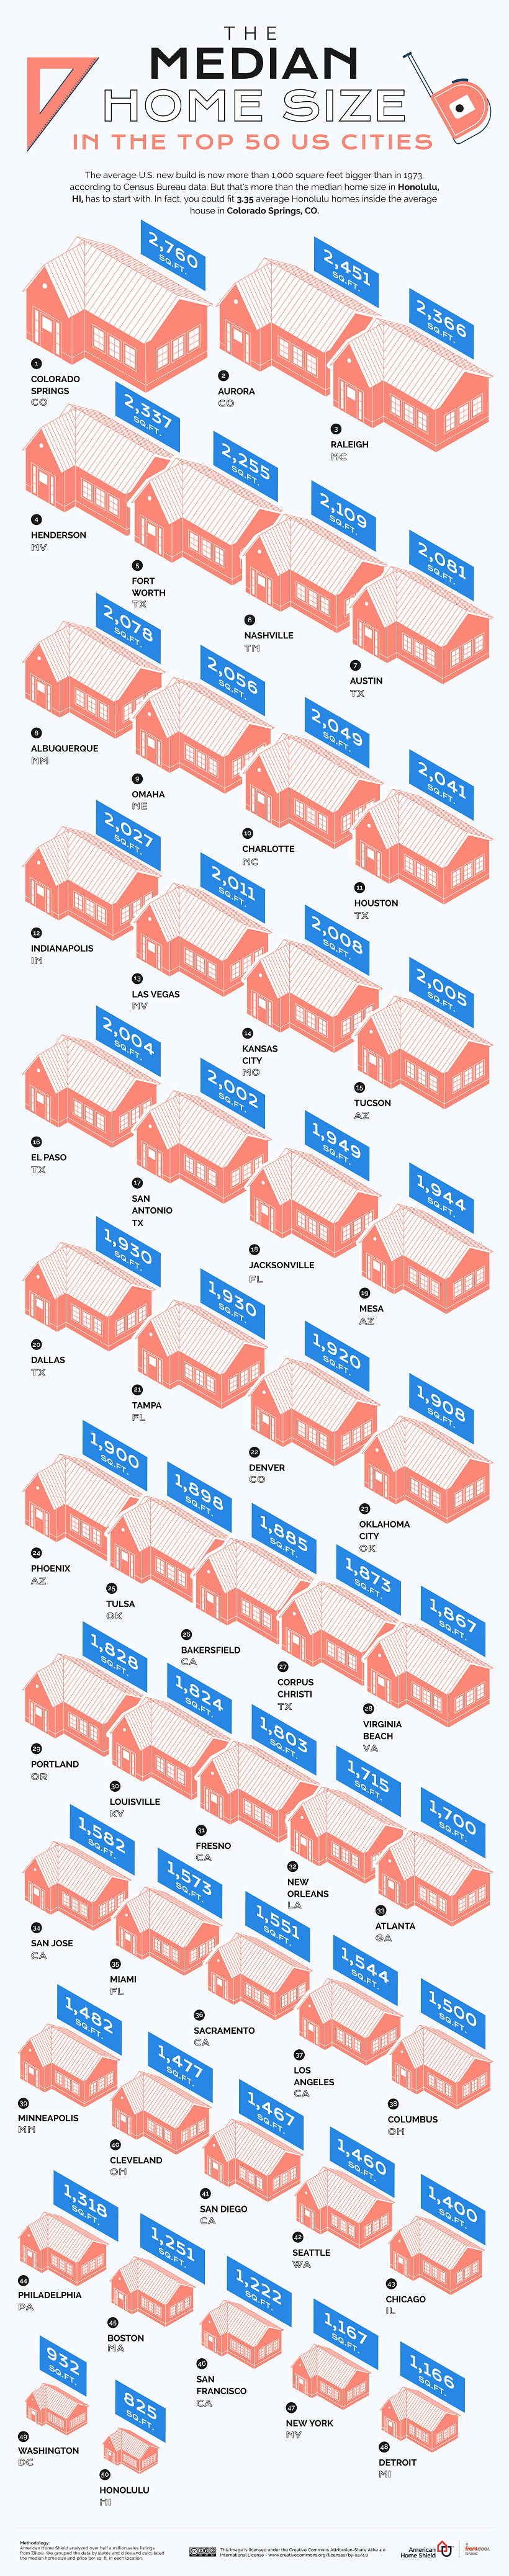
As the graphic shows, up-and-coming tech hubs like Raleigh and Colorado Springs have some of the largest homes.
Colorado Springs in particular has seen a significant influx in employment over the last few years, which has attracted high-income tech workers to the area driven up demand for spacious single-family dwellings.
The Price of Real Estate Compared to Home Size
The data also showed an inverse relationship between an area’s median price of real estate and the median home size. For instance, Hawaii has the smallest median home size of any state, as well as the most expensive at $743.86 per square foot.
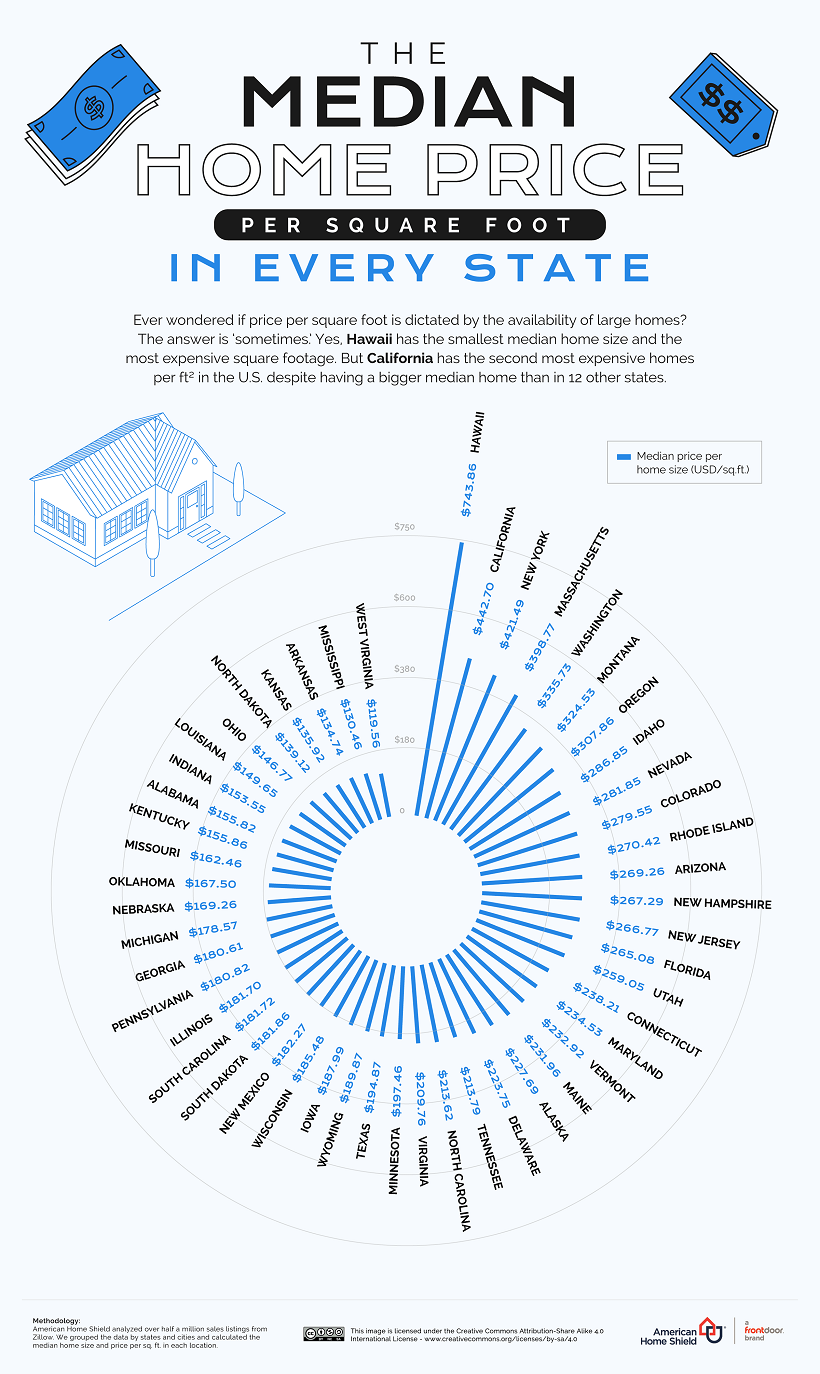
This trend is apparent in the state of New York as well, which had the second smallest median home size. Home costs in the state were a median $421.49 per square foot, the third-most expensive of any state.
Lot Size vs. Home Size
Interestingly, while home sizes in the U.S. have gotten larger over time, lot sizes have shrunk over the years.
In 1978, the median lot size for a U.S. property was 18,760 square feet, but by 2020, this figure had dropped to a record low of 13,896 square feet.
With lot sizes shrinking, will there come a point where home size growth across the country starts to plateau, or even shrink?

This article was published as a part of Visual Capitalist's Creator Program, which features data-driven visuals from some of our favorite Creators around the world.


Real Estate
Ranked: The Most Valuable Housing Markets in America
The U.S. residential real estate market is worth a staggering $47.5 trillion. Here are the most valuable housing markets in the country.
The Most Valuable Housing Markets in America
This was originally posted on our Voronoi app. Download the app for free on iOS or Android and discover incredible data-driven charts from a variety of trusted sources.
The residential real estate market in the U.S. stands as one of the largest asset classes in the country, worth $47.5 trillion in 2023.
Despite a slowdown in home sales, the total value of homes increased $2.4 trillion last year as low inventory levels pushed up prices. Affordable metropolitan areas saw steady price growth, while expensive metros experienced slower price appreciation.
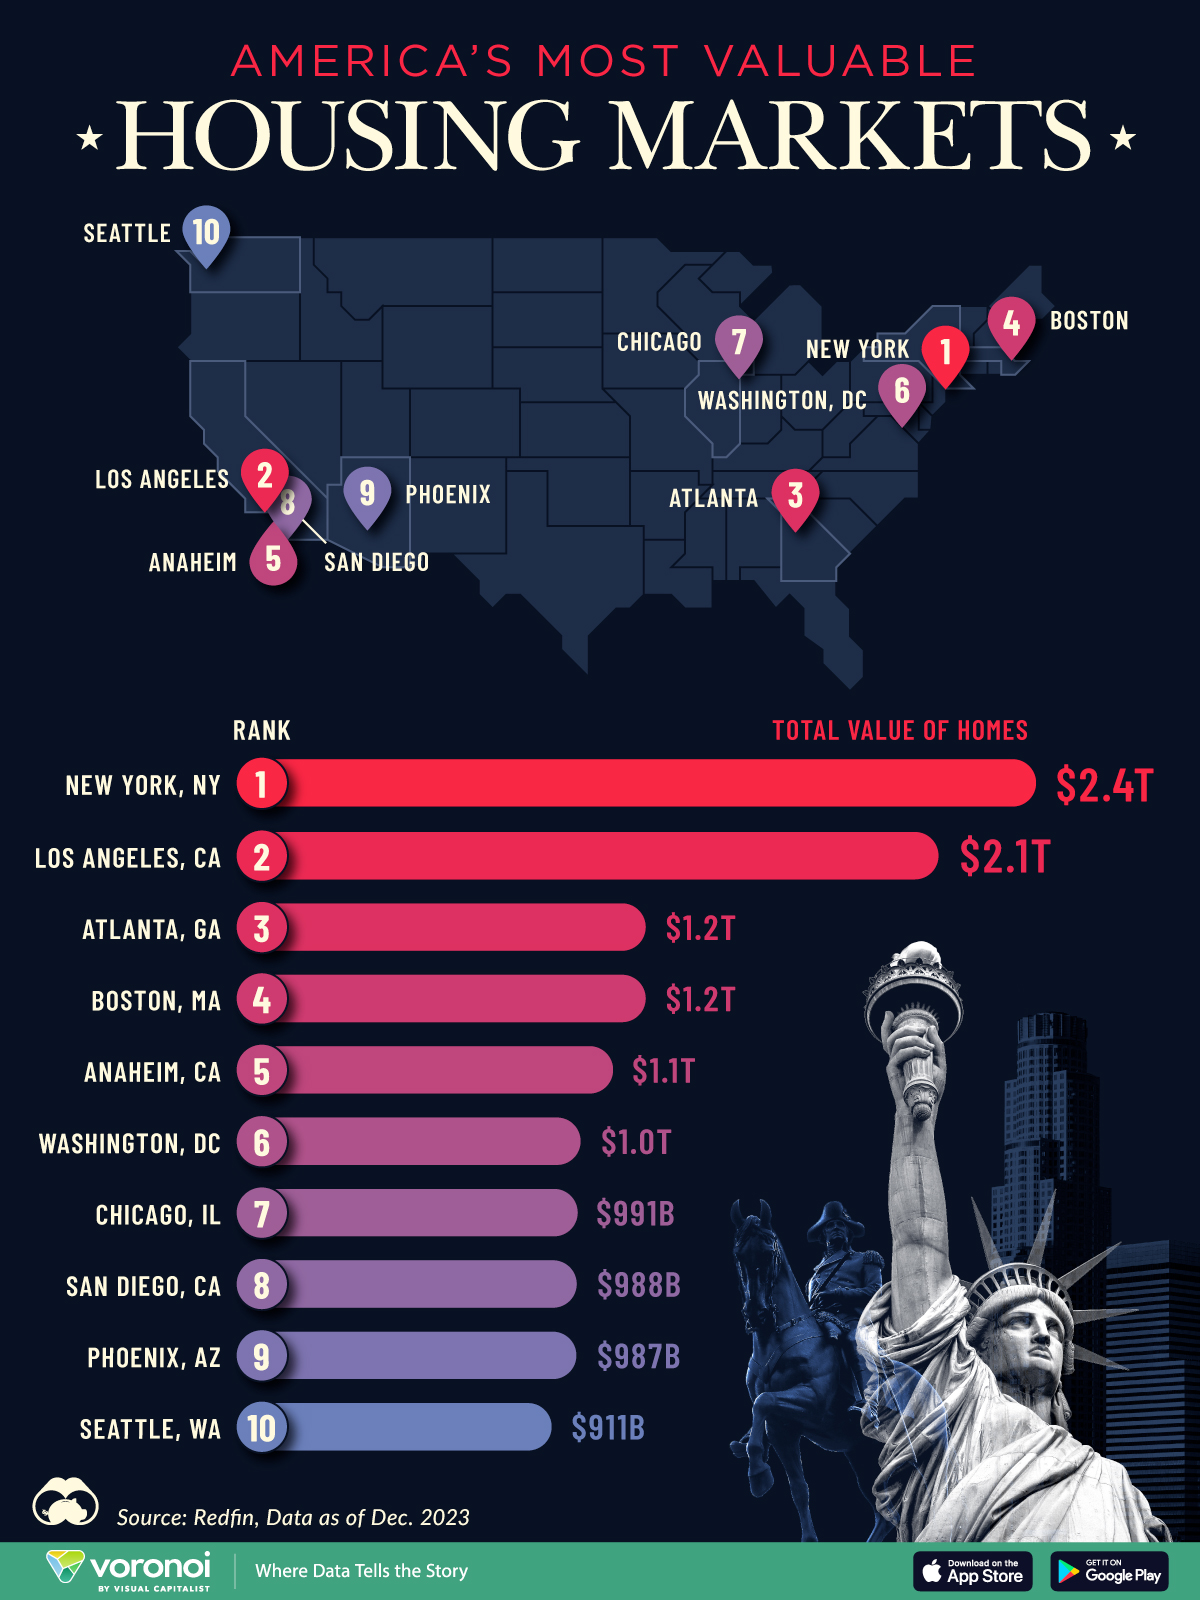
This graphic shows America’s most valuable housing markets, using data from Redfin.
Top U.S. Residential Real Estate Markets
To calculate the largest U.S. housing markets, Redfin analyzed 90 million properties covering single-family homes, townhouses, condos, and two-to four-unit multifamily properties.
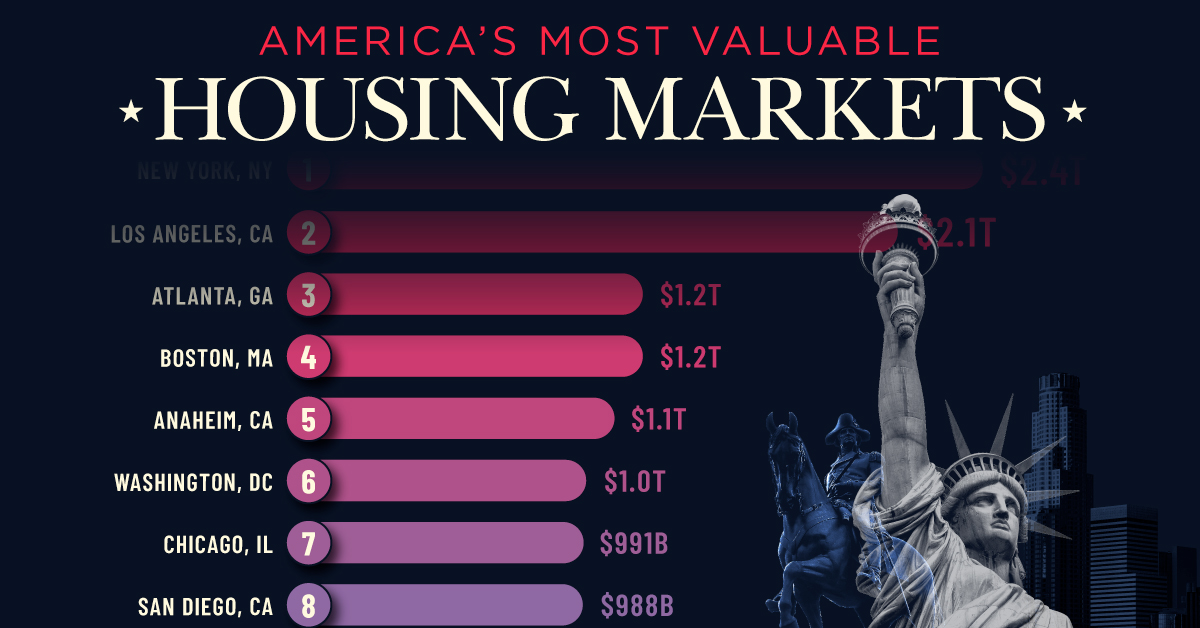
Below, we show the most valuable residential markets as of December 2023:
| Rank | U.S. Metro | Total Value of Homes | Total Value of Homes YoY Change |
|---|---|---|---|
| 1 | New York, NY | $2.4T | -1.0% |
| 2 | Los Angeles, CA | $2.1T | +4.3% |
| 3 | Atlanta, GA | $1.2T | +6.2% |
| 4 | Boston, MA | $1.2T | +8.3% |
| 5 | Anaheim, CA | $1.1T | +8.0% |
| 6 | Washington, DC | $1.0T | +6.2% |
| 7 | Chicago, IL | $991B | +7.4% |
| 8 | San Diego, CA | $988B | +9.4% |
| 9 | Phoenix, AZ | $987B | +4.2% |
| 10 | Seattle, WA | $911B | +4.6% |
With a housing market worth $2.4 trillion, New York, NY tops the list.
Unlike the majority of large U.S. cities, the aggregate value of homes declined as buyers became increasingly priced out of the market. At the same time, homeowners hesitated to sell in order to lock in low mortgage rates. In fact, more than 80% of mortgage holders in New York City have interest rates that are 5% or lower.
Los Angeles, CA falls in second, with a residential real estate market worth $2.0 trillion. Last year, existing home sales tumbled 24.8%, falling to the lowest point since 2007. However, the housing shortage led prices to increase amid high demand. The median sale price climbed to $975,000 in February 2024, a 5.9% jump compared to the same time last year.
Atlanta, GA ranks third and is the most overpriced housing market in the country according to one countrywide analysis. Homes have been selling for 41.7% more than their worth as of the February 2024 data update.
People are flocking to the city for many reasons. General housing affordability is a major driver, along with its thriving tech center. Along with this, state tax credits have increasingly made it a hub for the TV and film industries, earning it the moniker “Y’allywood”. Another factor in Atlanta’s inflating housing market are large investment firms, which own a huge footprint of homes in the city.
Editor’s note: For those wondering about the Bay Area, the data groups cities like San Francisco ($657 billion), San Jose ($821 billion), and Oakland ($881 billion) as individual entities, which puts them outside the cutoff. See the Redfin data for the full list of cities.

-

 Green2 weeks ago
Ranked: Top Countries by Total Forest Loss Since 2001
-

 Travel1 week ago
Ranked: The World’s Top Flight Routes, by Revenue
-

 Technology2 weeks ago
Ranked: Semiconductor Companies by Industry Revenue Share
-

 Money2 weeks ago
Which States Have the Highest Minimum Wage in America?
-

 Real Estate2 weeks ago
Ranked: The Most Valuable Housing Markets in America
-

 Markets2 weeks ago
Charted: Big Four Market Share by S&P 500 Audits
-

 AI2 weeks ago
The Stock Performance of U.S. Chipmakers So Far in 2024
-

 Automotive2 weeks ago
Almost Every EV Stock is Down After Q1 2024