Healthcare
Charted: Healthcare Spending and Life Expectancy, by Country
Article/Editing:
Charted: Healthcare Spending and Life Expectancy, by Country
Over the last century, life expectancy at birth has more than doubled across the globe, largely thanks to innovations and discoveries in various medical fields around sanitation, vaccines, and preventative healthcare.
Yet, while the average life expectancy for humans has increased significantly on a global scale, there’s still a noticeable gap in average life expectancies between different countries.
What’s the explanation for this divide? According to World Bank data compiled by Truman Du, it may be partially related to the amount of money a country spends on its healthcare.
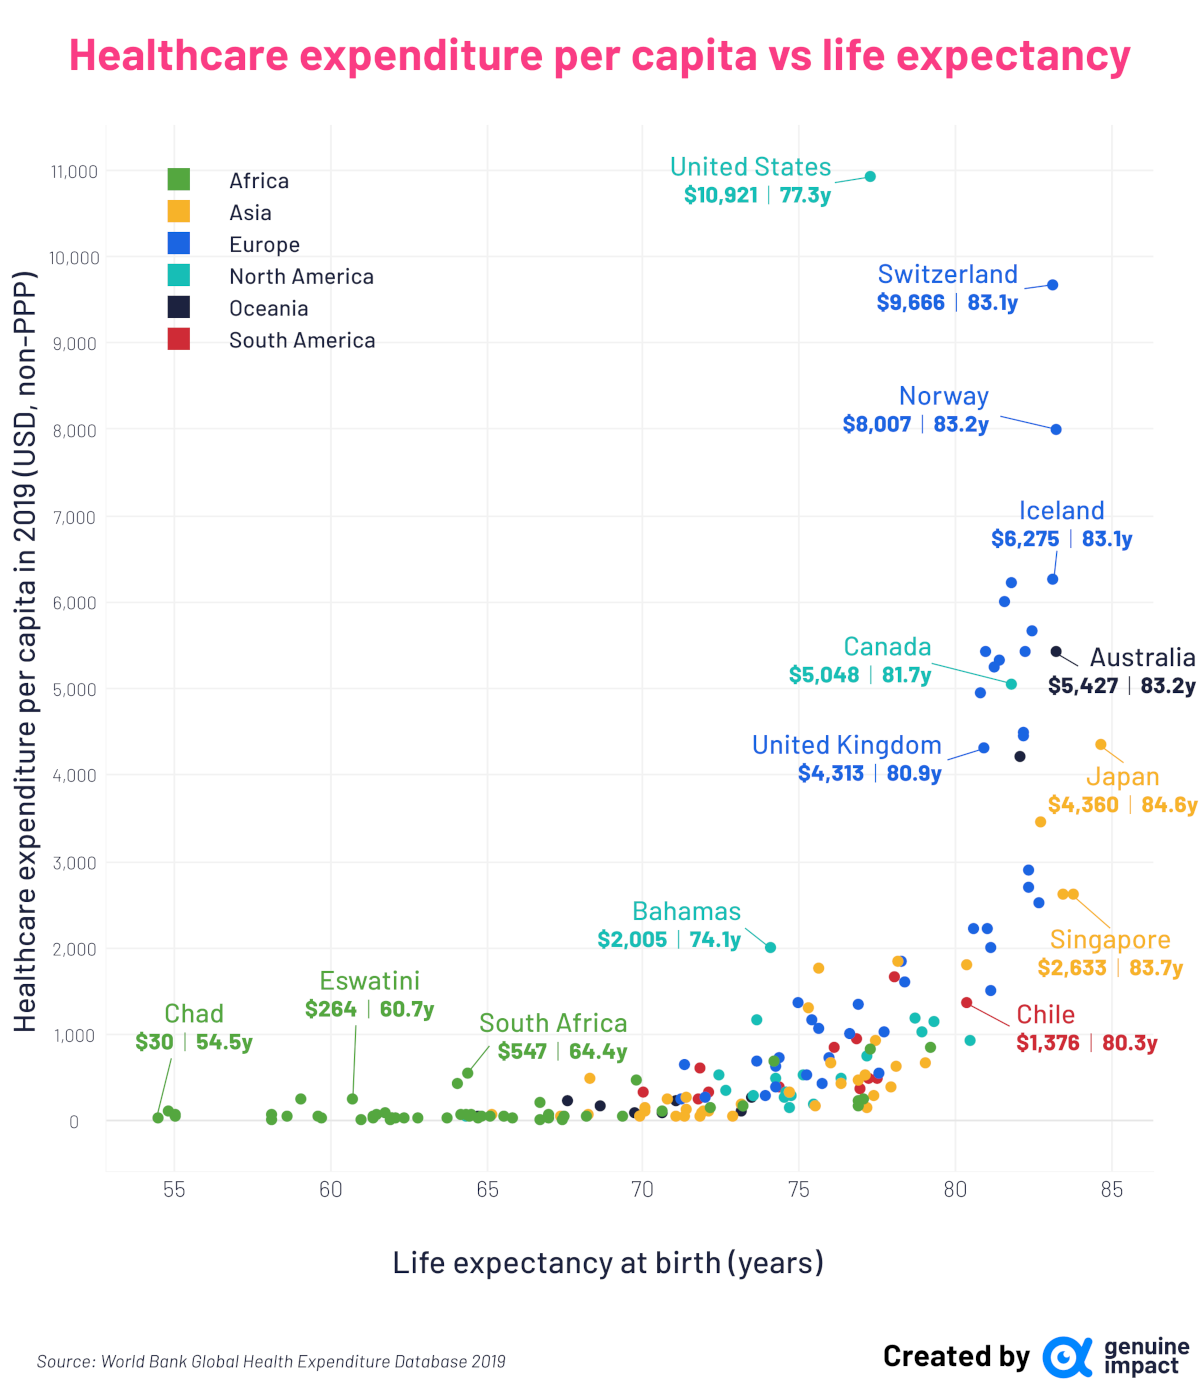
More Spending Generally Means More Years
The latest available data from the World Bank includes both the healthcare spending per capita of 178 different countries and their average life expectancy.
Perhaps unsurprisingly, the analysis found that countries that spent more on healthcare tended to have higher average life expectancies up until reaching the 80-year mark.
| Country | Health expenditure per capita (USD, 2019) | Life expectancy at birth, total (years, 2020) |
|---|---|---|
| Japan | $4,360 | 85 |
| Singapore | $2,633 | 84 |
| Korea, Rep. | $2,625 | 83 |
| Norway | $8,007 | 83 |
| Australia | $5,427 | 83 |
| Switzerland | $9,666 | 83 |
| Iceland | $6,275 | 83 |
| Israel | $3,456 | 83 |
| Malta | $2,532 | 83 |
| Sweden | $5,671 | 82 |
| Italy | $2,906 | 82 |
| Spain | $2,711 | 82 |
| Ireland | $5,429 | 82 |
| France | $4,492 | 82 |
| Finland | $4,450 | 82 |
| New Zealand | $4,211 | 82 |
| Canada | $5,048 | 82 |
| Luxembourg | $6,221 | 82 |
| Denmark | $6,003 | 82 |
| Netherlands | $5,335 | 81 |
| Austria | $5,242 | 81 |
| Cyprus | $1,996 | 81 |
| Greece | $1,501 | 81 |
| Portugal | $2,221 | 81 |
| Germany | $5,440 | 81 |
| United Kingdom | $4,313 | 81 |
| Belgium | $4,960 | 81 |
| Slovenia | $2,219 | 81 |
| Costa Rica | $922 | 80 |
| Qatar | $1,807 | 80 |
| Chile | $1,376 | 80 |
| Barbados | $1,143 | 79 |
| Maldives | $854 | 79 |
| Lebanon | $663 | 79 |
| Cuba | $1,032 | 79 |
| Panama | $1,193 | 79 |
| Estonia | $1,599 | 78 |
| Czech Republic | $1,844 | 78 |
| United Arab Emirates | $1,843 | 78 |
| Oman | $625 | 78 |
| Uruguay | $1,661 | 78 |
| Turkiye | $396 | 78 |
| Croatia | $1,040 | 78 |
| Bosnia and Herzegovina | $554 | 78 |
| Colombia | $495 | 77 |
| Bahrain | $940 | 77 |
| Thailand | $296 | 77 |
| United States | $10,921 | 77 |
| Seychelles | $840 | 77 |
| Ecuador | $486 | 77 |
| Antigua and Barbuda | $760 | 77 |
| Sri Lanka | $161 | 77 |
| China | $535 | 77 |
| Algeria | $248 | 77 |
| Peru | $370 | 77 |
| Morocco | $174 | 77 |
| Tunisia | $233 | 77 |
| Iran, Islamic Rep. | $470 | 77 |
| Slovak Republic | $1,342 | 77 |
| Argentina | $946 | 77 |
| Poland | $1,014 | 77 |
| St. Lucia | $502 | 76 |
| Malaysia | $437 | 76 |
| Brazil | $853 | 76 |
| Brunei Darussalam | $672 | 76 |
| Montenegro | $735 | 76 |
| North Macedonia | $437 | 76 |
| Hungary | $1,062 | 76 |
| Kuwait | $1,759 | 76 |
| Vietnam | $181 | 75 |
| Honduras | $188 | 75 |
| Latvia | $1,167 | 75 |
| Saudi Arabia | $1,316 | 75 |
| Armenia | $524 | 75 |
| Mexico | $540 | 75 |
| Lithuania | $1,370 | 75 |
| Belize | $293 | 75 |
| Nicaragua | $161 | 75 |
| Jordan | $334 | 75 |
| Jamaica | $327 | 75 |
| Guatemala | $271 | 75 |
| Paraguay | $388 | 74 |
| Romania | $739 | 74 |
| Dominican Republic | $491 | 74 |
| Serbia | $641 | 74 |
| Belarus | $399 | 74 |
| Mauritius | $686 | 74 |
| Bahamas | $2,005 | 74 |
| Georgia | $291 | 74 |
| Trinidad and Tobago | $1,168 | 74 |
| Bulgaria | $698 | 74 |
| El Salvador | $300 | 74 |
| Samoa | $272 | 73 |
| Cabo Verde | $178 | 73 |
| Solomon Islands | $112 | 73 |
| Azerbaijan | $193 | 73 |
| Bangladesh | $46 | 73 |
| St. Vincent and the Grenadines | $355 | 73 |
| Grenada | $534 | 72 |
| Egypt, Arab Rep. | $150 | 72 |
| Bhutan | $116 | 72 |
| Venezuela, RB | $339 | 72 |
| Moldova | $284 | 72 |
| Indonesia | $120 | 72 |
| Uzbekistan | $99 | 72 |
| Suriname | $619 | 72 |
| Kyrgyz Republic | $62 | 72 |
| Bolivia | $246 | 72 |
| Kazakhstan | $273 | 71 |
| Philippines | $142 | 71 |
| Russian Federation | $653 | 71 |
| Tajikistan | $62 | 71 |
| Ukraine | $248 | 71 |
| Nepal | $53 | 71 |
| Tonga | $242 | 71 |
| Iraq | $253 | 71 |
| Vanuatu | $104 | 71 |
| Sao Tome and Principe | $108 | 71 |
| Mongolia | $163 | 70 |
| Cambodia | $113 | 70 |
| Guyana | $326 | 70 |
| India | $64 | 70 |
| Botswana | $482 | 70 |
| Timor-Leste | $93 | 70 |
| Rwanda | $51 | 69 |
| Kiribati | $172 | 69 |
| Turkmenistan | $500 | 68 |
| Lao PDR | $68 | 68 |
| Senegal | $59 | 68 |
| Fiji | $236 | 68 |
| Djibouti | $62 | 67 |
| Pakistan | $39 | 67 |
| Madagascar | $20 | 67 |
| Myanmar | $60 | 67 |
| Kenya | $83 | 67 |
| Ethiopia | $27 | 67 |
| Gabon | $215 | 67 |
| Eritrea | $25 | 67 |
| Tanzania | $40 | 66 |
| Sudan | $47 | 66 |
| Afghanistan | $66 | 65 |
| Mauritania | $58 | 65 |
| Congo, Rep. | $49 | 65 |
| Papua New Guinea | $65 | 65 |
| Malawi | $30 | 65 |
| Comoros | $72 | 65 |
| Liberia | $53 | 64 |
| South Africa | $547 | 64 |
| Ghana | $75 | 64 |
| Haiti | $57 | 64 |
| Zambia | $69 | 64 |
| Namibia | $427 | 64 |
| Uganda | $32 | 64 |
| Niger | $31 | 63 |
| Gambia, The | $30 | 62 |
| Benin | $29 | 62 |
| Burkina Faso | $42 | 62 |
| Guinea | $43 | 62 |
| Burundi | $21 | 62 |
| Zimbabwe | $103 | 62 |
| Angola | $71 | 61 |
| Mozambique | $39 | 61 |
| Togo | $51 | 61 |
| Congo, Dem. Rep. | $21 | 61 |
| Eswatini | $264 | 61 |
| Mali | $34 | 60 |
| Cameroon | $54 | 60 |
| Equatorial Guinea | $255 | 59 |
| Guinea-Bissau | $63 | 59 |
| Cote d'Ivoire | $75 | 58 |
| South Sudan | $23 | 58 |
| Sierra Leone | $46 | 55 |
| Nigeria | $71 | 55 |
| Lesotho | $124 | 55 |
| Chad | $30 | 55 |
However, there were a few slight exceptions. For instance, while the United States has the largest spending of any country included in the dataset, its average life expectancy of 77 years is lower than many other countries that spend far less per capita.
What’s going on in the United States? While there are several intermingling factors at play, some researchers believe a big contributor is the country’s higher infant mortality rate, along with its higher relative rate of violence among young adults.
On the other end of the spectrum, Japan, Singapore, and South Korea have the highest life expectancies on the list despite their relatively low spending per capita.
It’s worth mentioning that this wasn’t always the case—in the 1960s, Japan’s life expectancy was actually the lowest among the G7 countries, and South Korea’s was below 60 years, making it one of the top 30 countries by improved life expectancy:
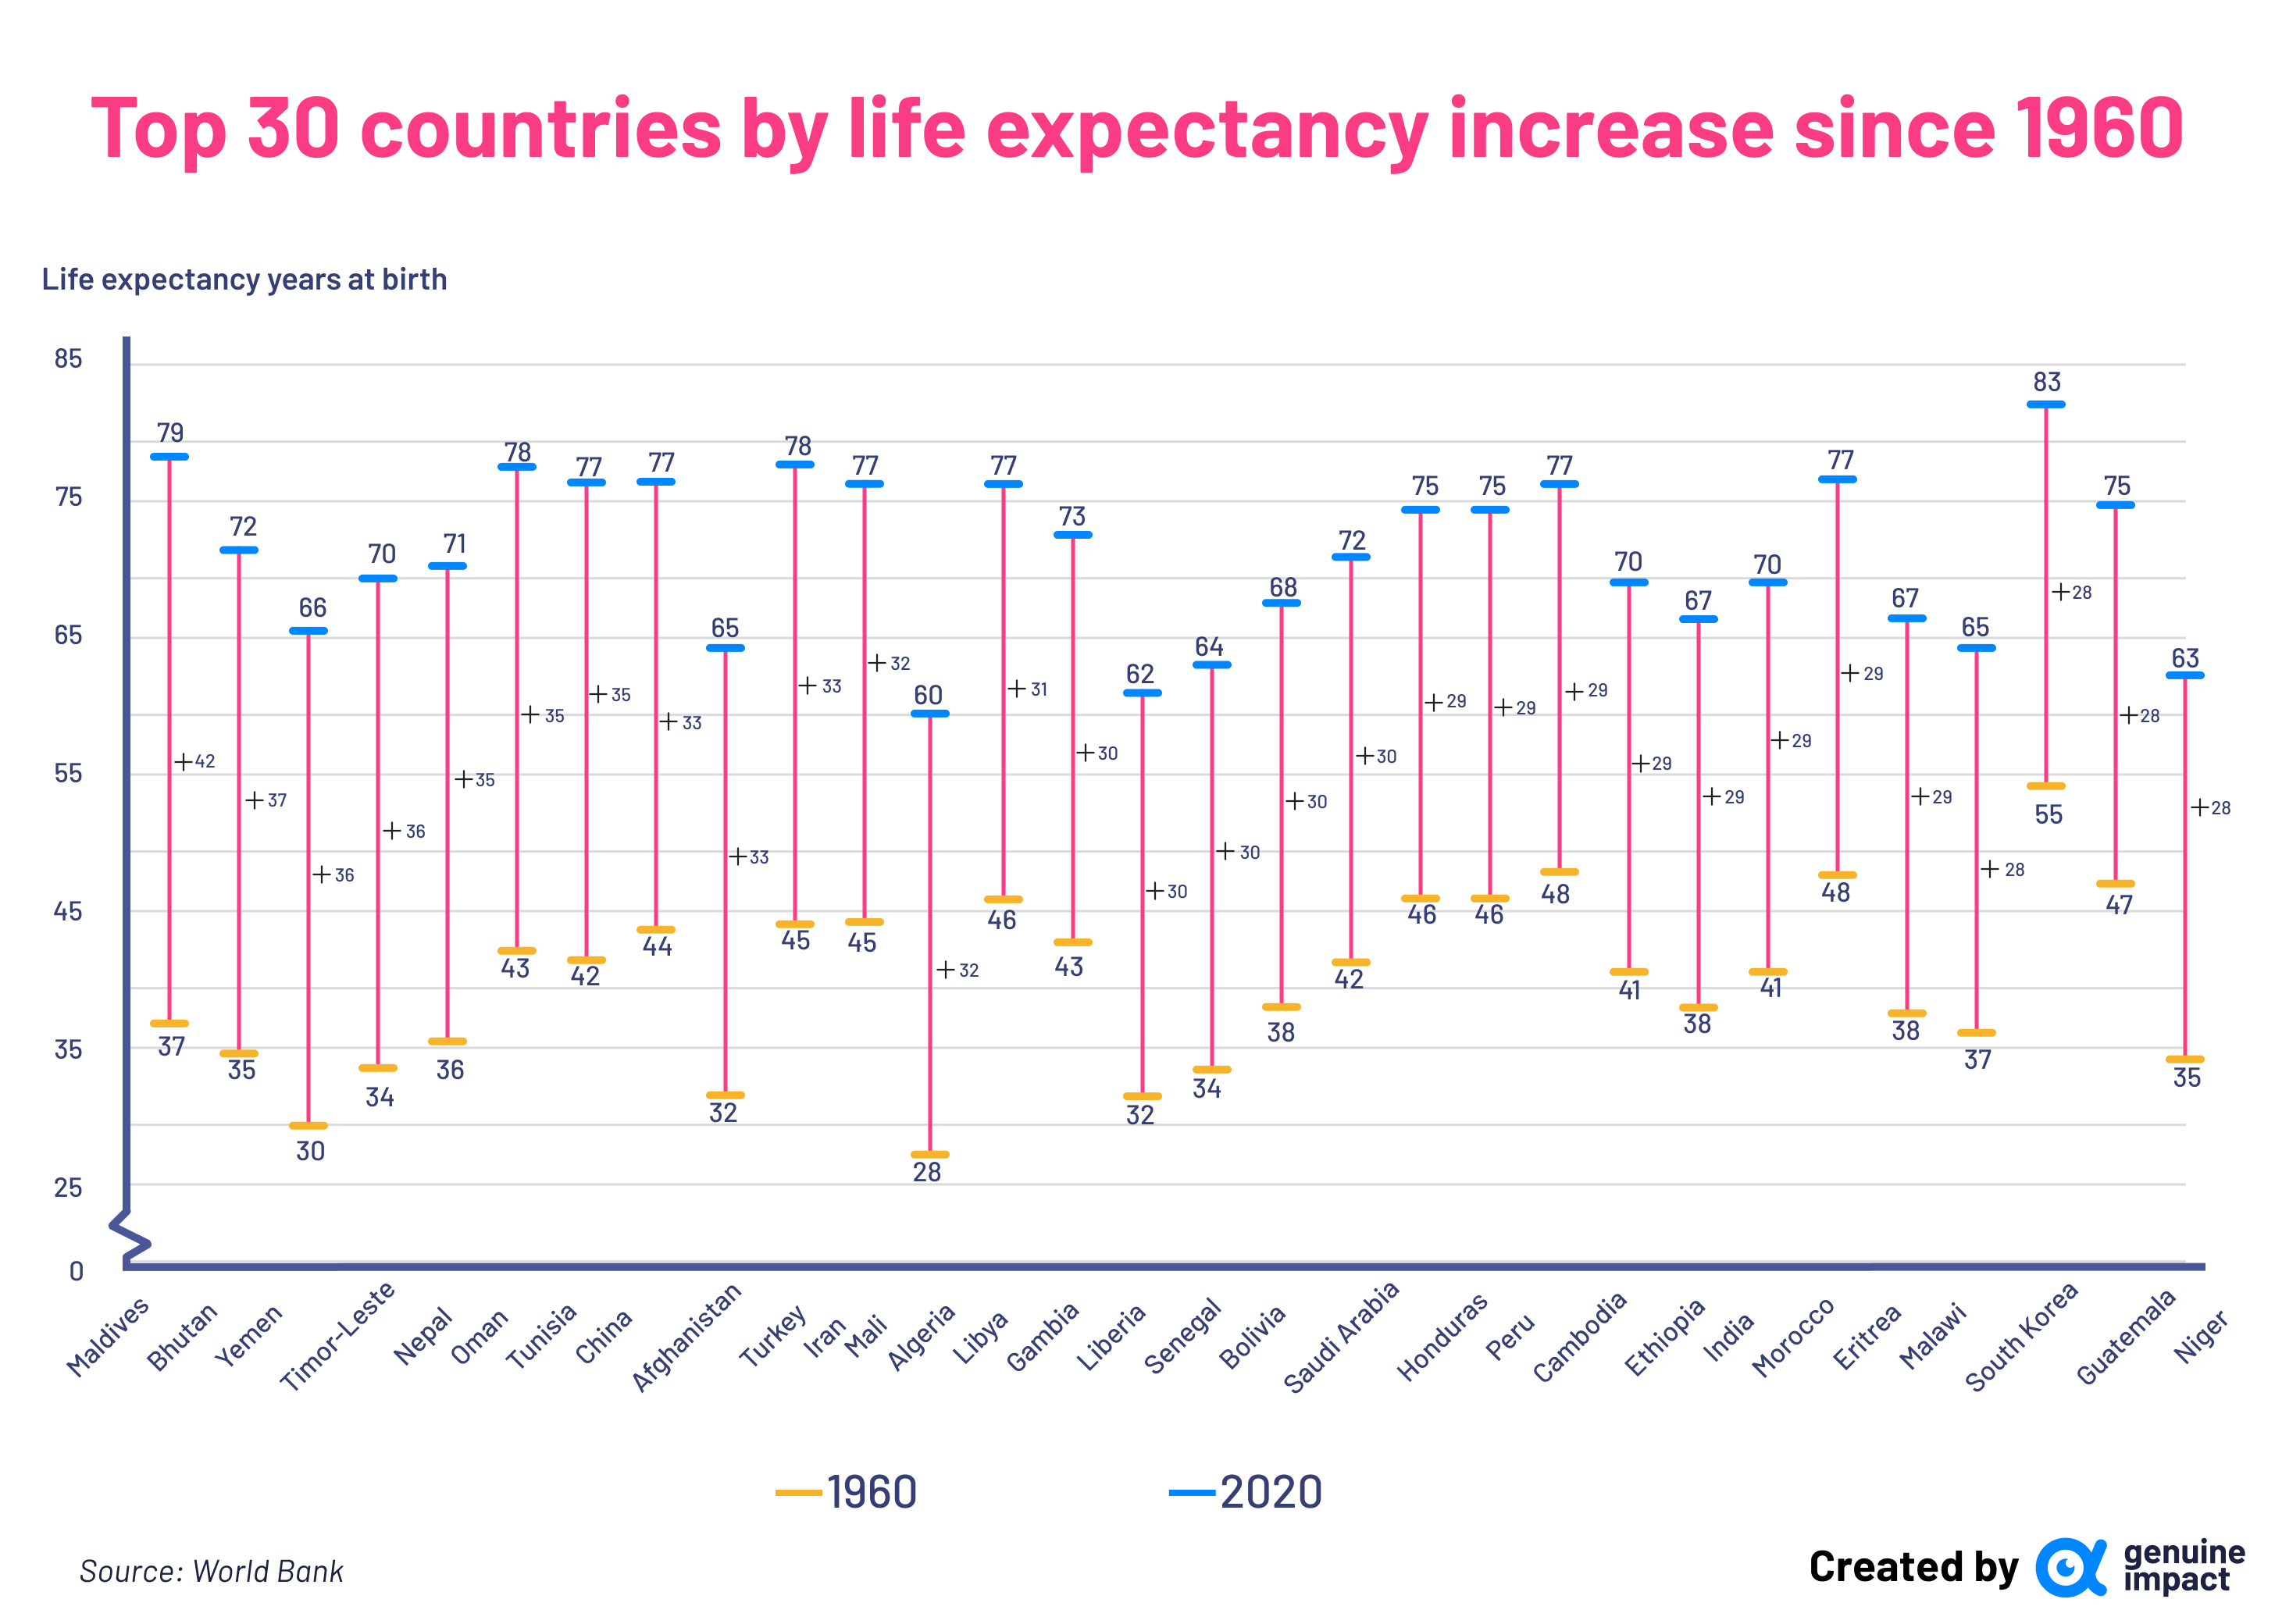
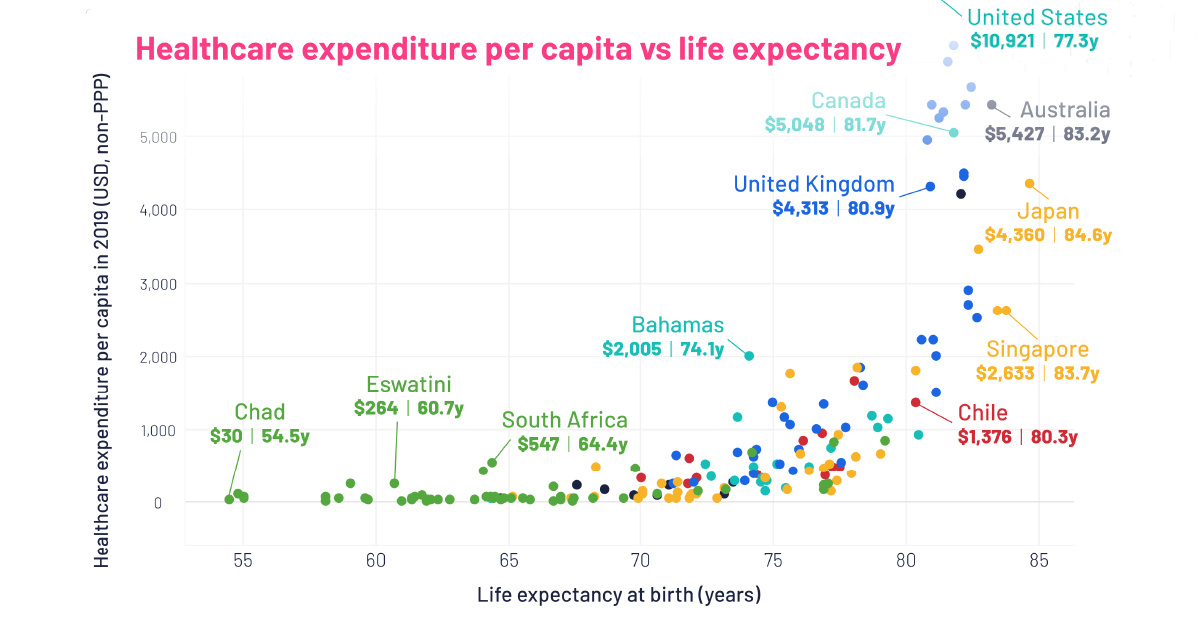
View the full-size infographic
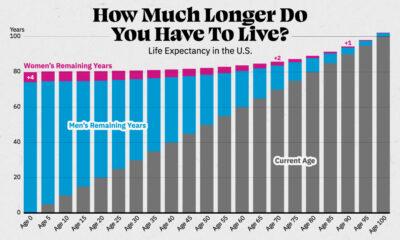
In fact, the last 60 years have seen many countries substantially increase their average life expectancies from the 30-40 year range to 70+ years. But as the header chart shows, there are still many countries lagging behind in Africa, Asia, and Oceania.
How High Can Average Life Expectancy Go?
Since people are living longer than they’ve ever lived before, how much higher will average life expectancies be in another 100 years?
Recent research published in Nature Communications suggests that, under the right circumstances, human beings have the potential to live up to 150 years.
Projections from the UN predict that growth will be divided, with developed countries seeing higher life expectancies than developing regions.
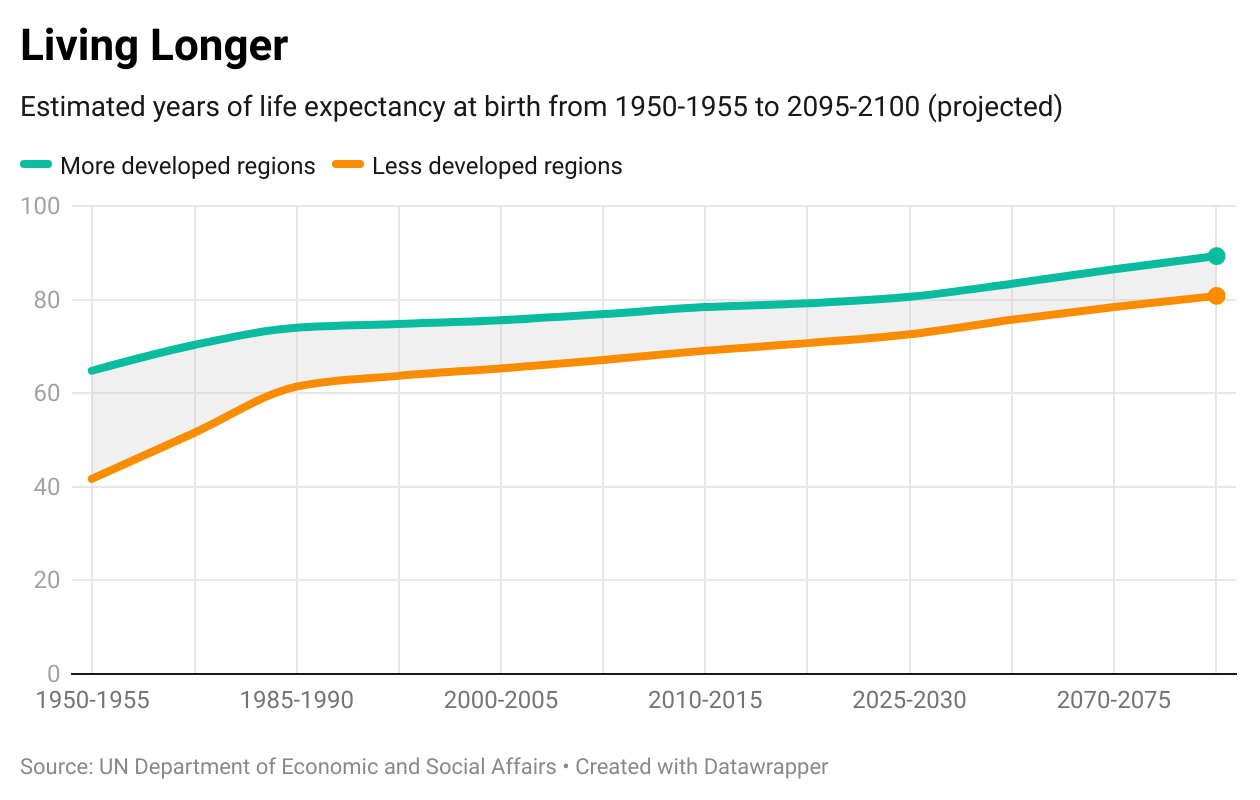
However, as seen in the above chart from the World Economic Forum and using UN data, it’s likely the gap between developed and developing countries will narrow over time.

This article was published as a part of Visual Capitalist's Creator Program, which features data-driven visuals from some of our favorite Creators around the world.


Healthcare
The Cost of an EpiPen in Major Markets
This visualization compares EpiPen prices around the world, with the U.S. having the highest prices by far.


The Cost of an EpiPen in Major Markets
This was originally posted on our Voronoi app. Download the app for free on iOS or Android and discover incredible data-driven charts from a variety of trusted sources.
EpiPens are auto-injectors containing epinephrine, a drug that can treat or reverse severe allergic reactions, potentially preventing death.
The global epinephrine market was valued at $1.75 billion in 2022 and is projected to reach $4.08 billion by 2030. North America represents over 60% of the market.
EpiPens, however, can be prohibitively expensive in some regions.
In this graphic, we present estimated EpiPen prices in major global markets, compiled by World Population Review and converted to U.S. dollars as of August 2023.
Why are U.S. Prices so High?
The U.S. stands out as the most expensive market for EpiPens, despite over 1 million Americans having epinephrine prescriptions. After Mylan (now part of Pfizer) acquired the rights to produce EpiPens in the U.S. in 2007, the cost of a two-pack skyrocketed to $600, up from about $60.
| Country | Price (USD) |
|---|---|
| 🇺🇸 U.S. | 300* |
| 🇯🇵 Japan | 98 |
| 🇩🇪 Germany | 85 |
| 🇨🇦 Canada | 80 |
| 🇫🇷 France | 76 |
| 🇦🇺 Australia | 66 |
| 🇬🇧 UK | 61 |
| 🇮🇳 India | 30 |
*Per unit cost. Commonly sold as a two-pack, meaning total cost is equal to $600
Former Mylan CEO Heather Bresch defended the price hikes to Congress, citing minimal profit margins. Mylan eventually settled with the U.S. government for a nine-figure sum.
Notably, EpiPens are available at a fraction of the cost in other developed countries like Japan, Germany, and Canada.
Making EpiPens More Affordable
Efforts to improve EpiPen affordability are underway in several U.S. states. For instance, the Colorado House approved a $60 price cap on epinephrine, now under review by the state Senate.
Similar measures in Rhode Island, Delaware, Missouri, and Vermont aim to ensure insurance coverage for epinephrine, which is not currently mandatory, although most health plans cover it.

-

 Real Estate2 weeks ago
Visualizing America’s Shortage of Affordable Homes
-

 Technology1 week ago
Ranked: Semiconductor Companies by Industry Revenue Share
-

 Money1 week ago
Which States Have the Highest Minimum Wage in America?
-

 Real Estate1 week ago
Ranked: The Most Valuable Housing Markets in America
-

 Business2 weeks ago
Charted: Big Four Market Share by S&P 500 Audits
-

 AI2 weeks ago
The Stock Performance of U.S. Chipmakers So Far in 2024
-

 Misc2 weeks ago
Almost Every EV Stock is Down After Q1 2024
-

 Money2 weeks ago
Where Does One U.S. Tax Dollar Go?