Misc
Ranked: The Top Goal Scorers in FIFA World Cup History
Article/Editing:
Ranked: The Top Goal Scorers in FIFA World Cup History
With the 2022 FIFA World Cup around the corner, soccer (or football) fans have their eyes set on how their favorite teams and players will perform.
But history shows that some players, and teams, are far more proficient in goals and wins than others. After all, with only 32 teams competing and the field quickly whittling down, there aren’t many chances for players to make their mark.
Who are history’s most prolific goal scorers? This series of graphics from Pablo Alvarez breaks down the top goal scorers in FIFA World Cup history, and their goals per appearances.
The World’s Cup Top Goal Scorers
Since the inaugural World Cup tournament in 1930, there have been 21 tournaments held across 17 countries.
At the first World Cup in Uruguay, 13 national teams competed for the championship trophy. The tournament then included 16 teams until 1982, when it expanded to 24 teams. Most recently, FIFA expanded to the current 32-team format starting in 1998.
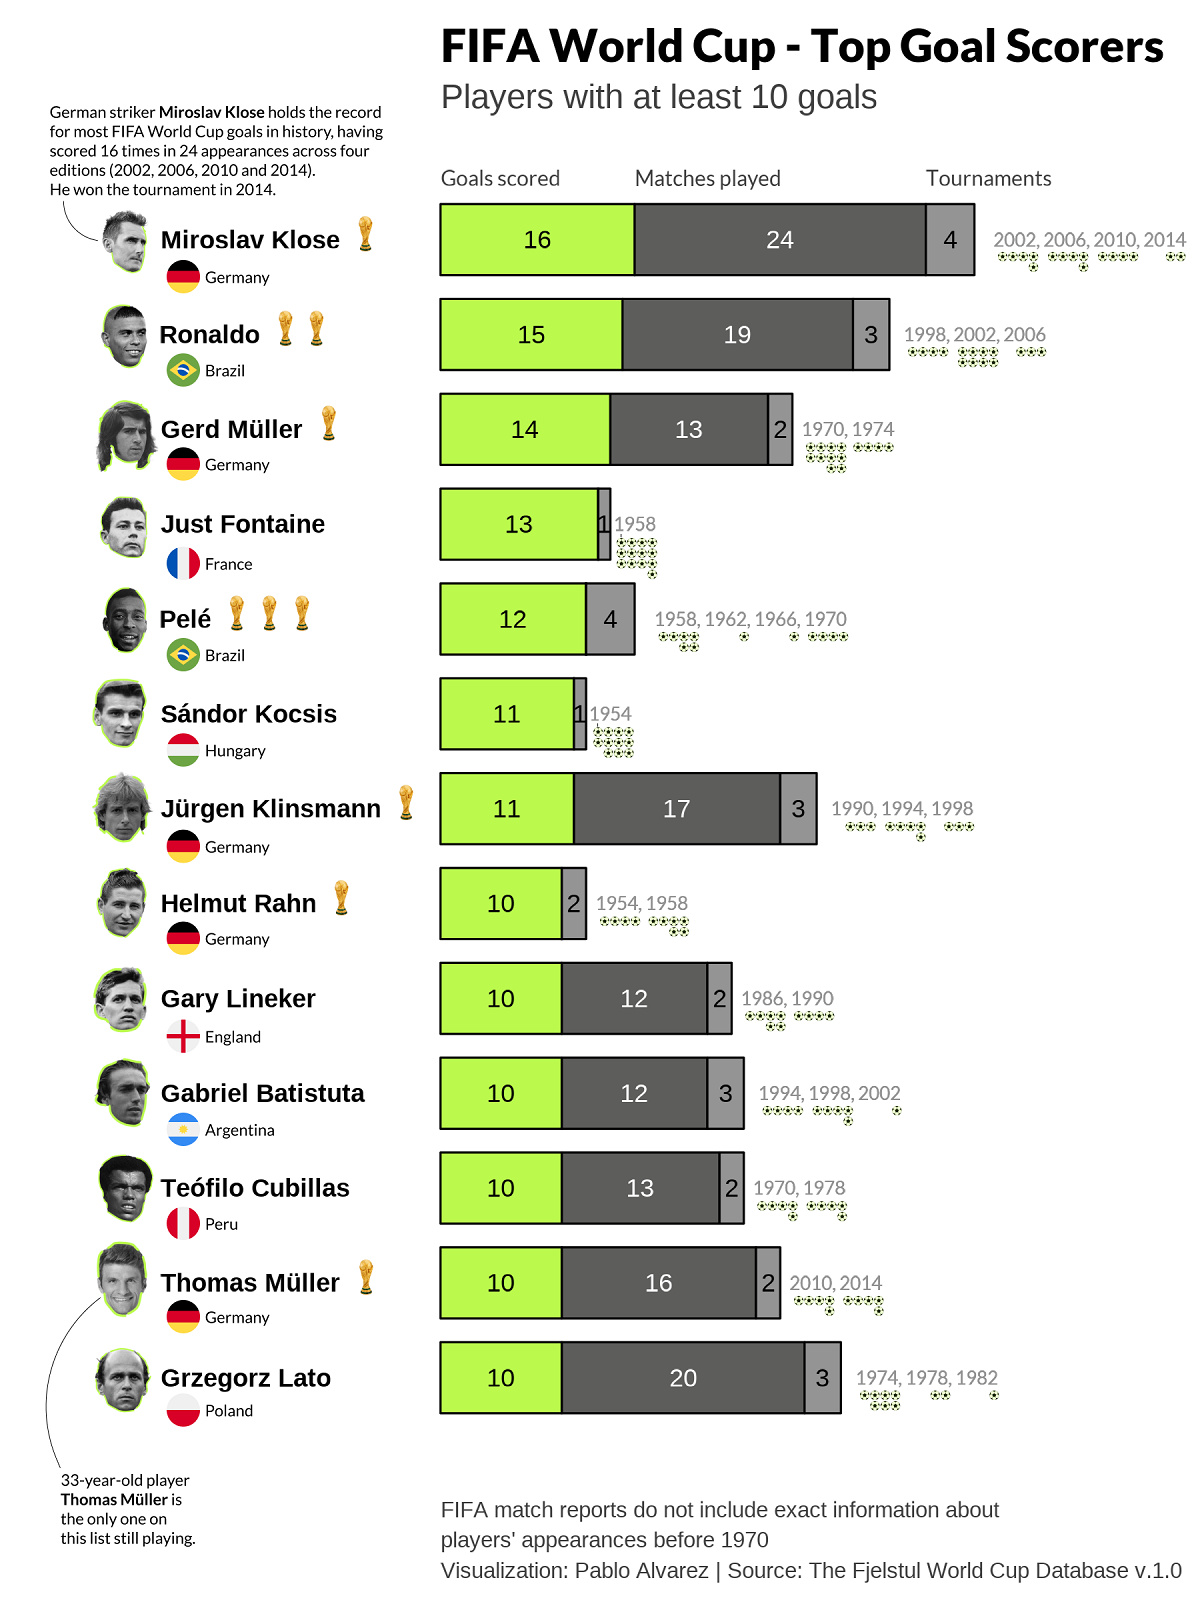
And across all these tournaments, just 13 players have scored 10 or more goals:
| Rank | Player (* denotes active) | World Cup Goals | Tournaments |
|---|---|---|---|
| 1 | 🇩🇪 Miroslav Klose | 16 | 4 |
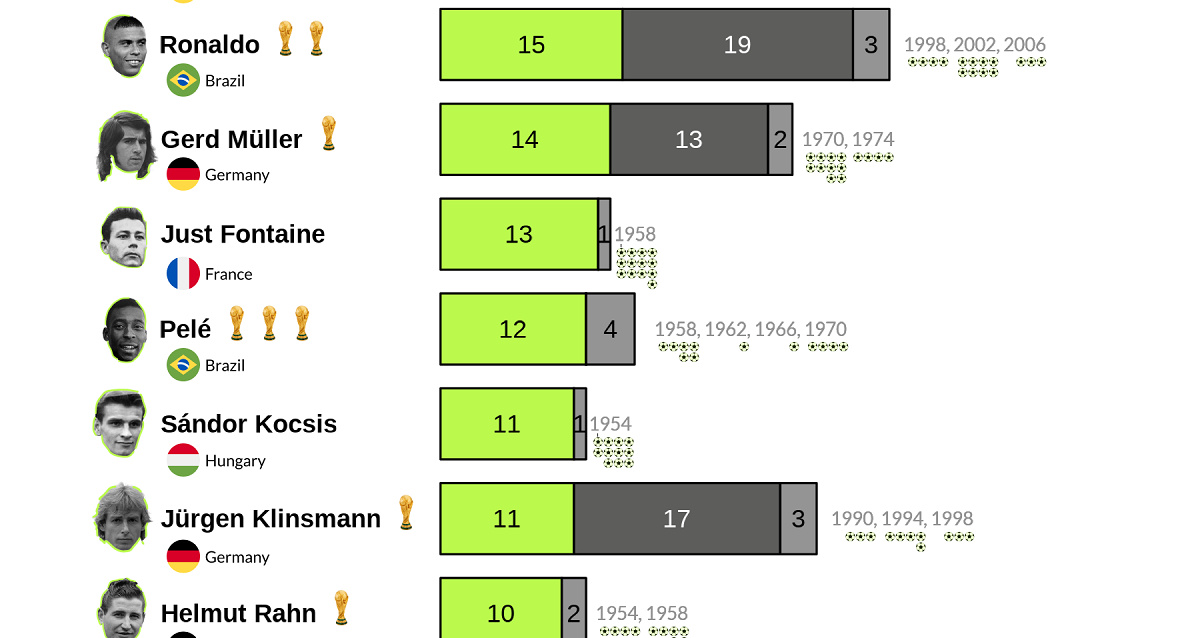
| 2 | 🇧🇷 Ronaldo | 15 | 3 |
| 3 | 🇩🇪 Gerd Müller | 14 | 2 |
| 4 | 🇫🇷 Just Fontaine | 13 | 1 |
| 5 | 🇧🇷 Pelé | 12 | 4 |
| T6 | 🇭🇺 Sándor Kocsis | 11 | 1 |
| T6 | 🇩🇪 Jürgen Klinsmann | 11 | 3 |
| T8 | 🇩🇪 Helmut Rahn | 10 | 2 |
| T8 | 🏴 Gary Lineker | 10 | 2 |
| T8 | 🇦🇷 Gabriel Batistuta | 10 | 3 |
| T8 | 🇵🇪 Teófilo Cubillas | 10 | 2 |
| T8 | 🇩🇪 Thomas Müller* | 10 | 2 |
| T8 | 🇵🇱 Grzegorz Lato | 10 | 3 |
The record for the most goals scored at the World Cup currently belongs to Germany’s Miroslav Klose with 16 goals across 4 tournaments, including one championship in 2014.
In fact, Germany had the most 10+ goal scorers of any country with five, including the only still-active player Thomas Müller.
Other well-known legends on the list include Ronaldo (not to be confused with Cristiano Ronaldo) and Pelé from Brazil, and Gary Lineker from England. But the title for the most goals scored in just one tournament goes to France’s Just Fontaine, who scored an incredible 13 goals in six matches in 1958.
Tracking World Cup Goals Per Appearances
Because of a diverse field and an intense qualification process, some teams play more games than others. Therefore, the above list skews towards teams and players with many caps.
So Alvarez also charted how World Cup goal scorers compare on a per-match basis. Unfortunately, FIFA match reports only fully tracked appearances and substitutions from 1970 onwards, though this still gives a clear picture of some of the world’s most effective (and least effective) goal scorers:
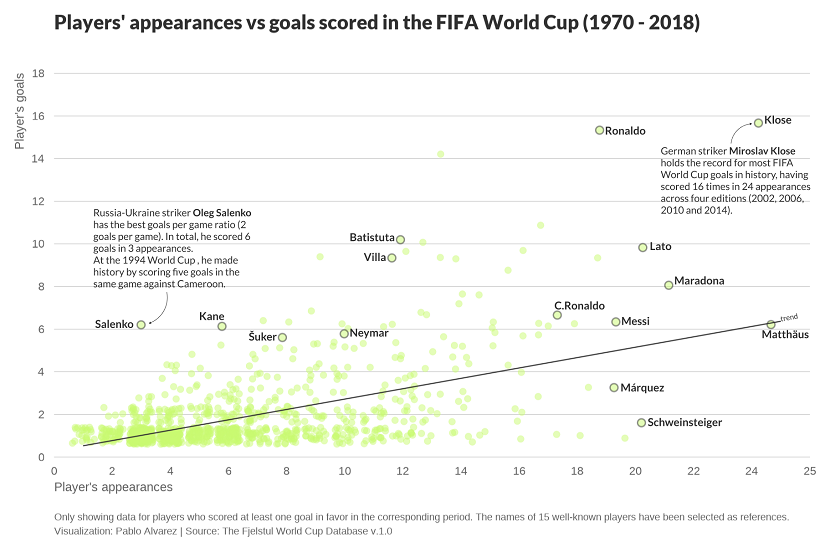
Again, the top goal scorers Klose and Ronaldo appear very prominently with 15+ goals, but other legends with a similar number of appearances like Maradona, Messi, and Cristiano Ronaldo weren’t as successful on a per-match basis.
What happens when we take the top World Cup goal scorers with 5 or more goals from 1970 onwards and look at their goals/match rate?
| Player | World Cup Goals (1970–2018) | Matches Played | Goals/Match |
|---|---|---|---|
| Miroslav Klose | 16 | 24 | 0.67 |
| Ronaldo | 15 | 19 | 0.79 |
| Gerd Müller | 14 | 13 | 1.08 |
| Jürgen Klinsmann | 11 | 17 | 0.65 |
| Gary Lineker | 10 | 12 | 0.83 |
| Gabriel Batistuta | 10 | 12 | 0.83 |
| Teófilo Cubillas | 10 | 13 | 0.77 |
| Thomas Müller | 10 | 16 | 0.63 |
| Grzegorz Lato | 10 | 20 | 0.50 |
| Christian Vieri | 9 | 9 | 1.00 |
| David Villa | 9 | 12 | 0.75 |
| Jairzinho | 9 | 13 | 0.69 |
| Paolo Rossi | 9 | 14 | 0.64 |
| Roberto Baggio | 9 | 16 | 0.56 |
| Karl-Heinz Rummenigge | 9 | 19 | 0.47 |
| Rivaldo | 8 | 14 | 0.57 |
| Rudi Völler | 8 | 15 | 0.53 |
| Diego Maradona | 8 | 21 | 0.38 |
| Careca | 7 | 9 | 0.78 |
| Andrzej Szarmach | 7 | 13 | 0.54 |
| Luis Suárez | 7 | 13 | 0.54 |
| Johnny Rep | 7 | 14 | 0.50 |
| Cristiano Ronaldo | 7 | 17 | 0.41 |
| Oleg Salenko | 6 | 3 | 2.00 |
| Harry Kane | 6 | 6 | 1.00 |
| Salvatore Schillaci | 6 | 7 | 0.86 |
| James Rodríguez | 6 | 8 | 0.75 |
| Davor Šuker | 6 | 8 | 0.75 |
| Neymar | 6 | 10 | 0.60 |
| Diego Forlán | 6 | 10 | 0.60 |
| Hristo Stoichkov | 6 | 10 | 0.60 |
| Asamoah Gyan | 6 | 11 | 0.55 |
| Dennis Bergkamp | 6 | 12 | 0.50 |
| Rob Rensenbrink | 6 | 13 | 0.46 |
| Bebeto | 6 | 15 | 0.40 |
| Arjen Robben | 6 | 15 | 0.40 |
| Rivellino | 6 | 15 | 0.40 |
| Zbigniew Boniek | 6 | 16 | 0.38 |
| Robin van Persie | 6 | 17 | 0.35 |
| Wesley Sneijder | 6 | 17 | 0.35 |
| Thierry Henry | 6 | 17 | 0.35 |
| Mario Kempes | 6 | 18 | 0.33 |
| Lionel Messi | 6 | 19 | 0.32 |
| Lothar Matthäus | 6 | 25 | 0.24 |
| Tomáš Skuhravý | 5 | 5 | 1.00 |
| Jon Dahl Tomasson | 5 | 6 | 0.83 |
| Fernando Morientes | 5 | 7 | 0.71 |
| Kennet Andersson | 5 | 7 | 0.71 |
| Alessandro Altobelli | 5 | 7 | 0.71 |
| Romário | 5 | 8 | 0.63 |
| Mario Mandžukić | 5 | 8 | 0.63 |
| Marc Wilmots | 5 | 8 | 0.63 |
| Emilio Butragueño | 5 | 9 | 0.56 |
| Tim Cahill | 5 | 9 | 0.56 |
| Roger Milla | 5 | 10 | 0.50 |
| Romelu Lukaku | 5 | 10 | 0.50 |
| Ivan Perišić | 5 | 10 | 0.50 |
| Hans Krankl | 5 | 10 | 0.50 |
| Raúl | 5 | 11 | 0.45 |
| Fernando Hierro | 5 | 12 | 0.42 |
| Zinedine Zidane | 5 | 12 | 0.42 |
| Landon Donovan | 5 | 12 | 0.42 |
| Johan Neeskens | 5 | 12 | 0.42 |
| Henrik Larsson | 5 | 13 | 0.38 |
| Gonzalo Higuaín | 5 | 14 | 0.36 |
| Edinson Cavani | 5 | 14 | 0.36 |
| Zico | 5 | 14 | 0.36 |
| Michel Platini | 5 | 14 | 0.36 |
| Lukas Podolski | 5 | 15 | 0.33 |
Most players expectedly scored under one goal/match, but five players stand out:
- Russia’s Oleg Salenko with an incredible 2 goals/match (6 goals in 3 matches).
- Germany’s Gerd Müller with 1.08 goals/match.
- Italy’s Christian Vieri, England’s Harry Kane, and the Czech Republic’s Tomáš Skuhravý with 1 goal/match.
Future Top Goal Scorers
With many players in Qatar 2022 vying for both the national championship and the Golden Boot, which is awarded to the tournament’s top goal scorer, the rankings are always ripe to change.
And future tournaments will likely offer more goal-scoring opportunities. The 2026 World Cup to be held in Canada, the U.S., and Mexico will be the first to feature 48 teams after FIFA voted to expand the tournament.
Which active players, or up-and-coming talents, will be next to climb the all-time goal scoring rankings?

This article was published as a part of Visual Capitalist's Creator Program, which features data-driven visuals from some of our favorite Creators around the world.


VC+
VC+: Get Our Key Takeaways From the IMF’s World Economic Outlook
A sneak preview of the exclusive VC+ Special Dispatch—your shortcut to understanding IMF’s World Economic Outlook report.

Have you read IMF’s latest World Economic Outlook yet? At a daunting 202 pages, we don’t blame you if it’s still on your to-do list.
But don’t worry, you don’t need to read the whole April release, because we’ve already done the hard work for you.
To save you time and effort, the Visual Capitalist team has compiled a visual analysis of everything you need to know from the report—and our VC+ Special Dispatch is available exclusively to VC+ members. All you need to do is log into the VC+ Archive.
If you’re not already subscribed to VC+, make sure you sign up now to access the full analysis of the IMF report, and more (we release similar deep dives every week).
For now, here’s what VC+ members get to see.
Your Shortcut to Understanding IMF’s World Economic Outlook
With long and short-term growth prospects declining for many countries around the world, this Special Dispatch offers a visual analysis of the key figures and takeaways from the IMF’s report including:
- The global decline in economic growth forecasts
- Real GDP growth and inflation forecasts for major nations in 2024
- When interest rate cuts will happen and interest rate forecasts
- How debt-to-GDP ratios have changed since 2000
- And much more!

Get the Full Breakdown in the Next VC+ Special Dispatch
VC+ members can access the full Special Dispatch by logging into the VC+ Archive, where you can also check out previous releases.
Make sure you join VC+ now to see exclusive charts and the full analysis of key takeaways from IMF’s World Economic Outlook.
Don’t miss out. Become a VC+ member today.
What You Get When You Become a VC+ Member
VC+ is Visual Capitalist’s premium subscription. As a member, you’ll get the following:
- Special Dispatches: Deep dive visual briefings on crucial reports and global trends
- Markets This Month: A snappy summary of the state of the markets and what to look out for
- The Trendline: Weekly curation of the best visualizations from across the globe
- Global Forecast Series: Our flagship annual report that covers everything you need to know related to the economy, markets, geopolitics, and the latest tech trends
- VC+ Archive: Hundreds of previously released VC+ briefings and reports that you’ve been missing out on, all in one dedicated hub
You can get all of the above, and more, by joining VC+ today.

-

 Mining1 week ago
Gold vs. S&P 500: Which Has Grown More Over Five Years?
-

 Markets2 weeks ago
Ranked: The Most Valuable Housing Markets in America
-

 Money2 weeks ago
Which States Have the Highest Minimum Wage in America?
-

 AI2 weeks ago
Ranked: Semiconductor Companies by Industry Revenue Share
-

 Markets2 weeks ago
Ranked: The World’s Top Flight Routes, by Revenue
-

 Countries2 weeks ago
Population Projections: The World’s 6 Largest Countries in 2075
-

 Markets2 weeks ago
The Top 10 States by Real GDP Growth in 2023
-

 Demographics2 weeks ago
The Smallest Gender Wage Gaps in OECD Countries