Technology
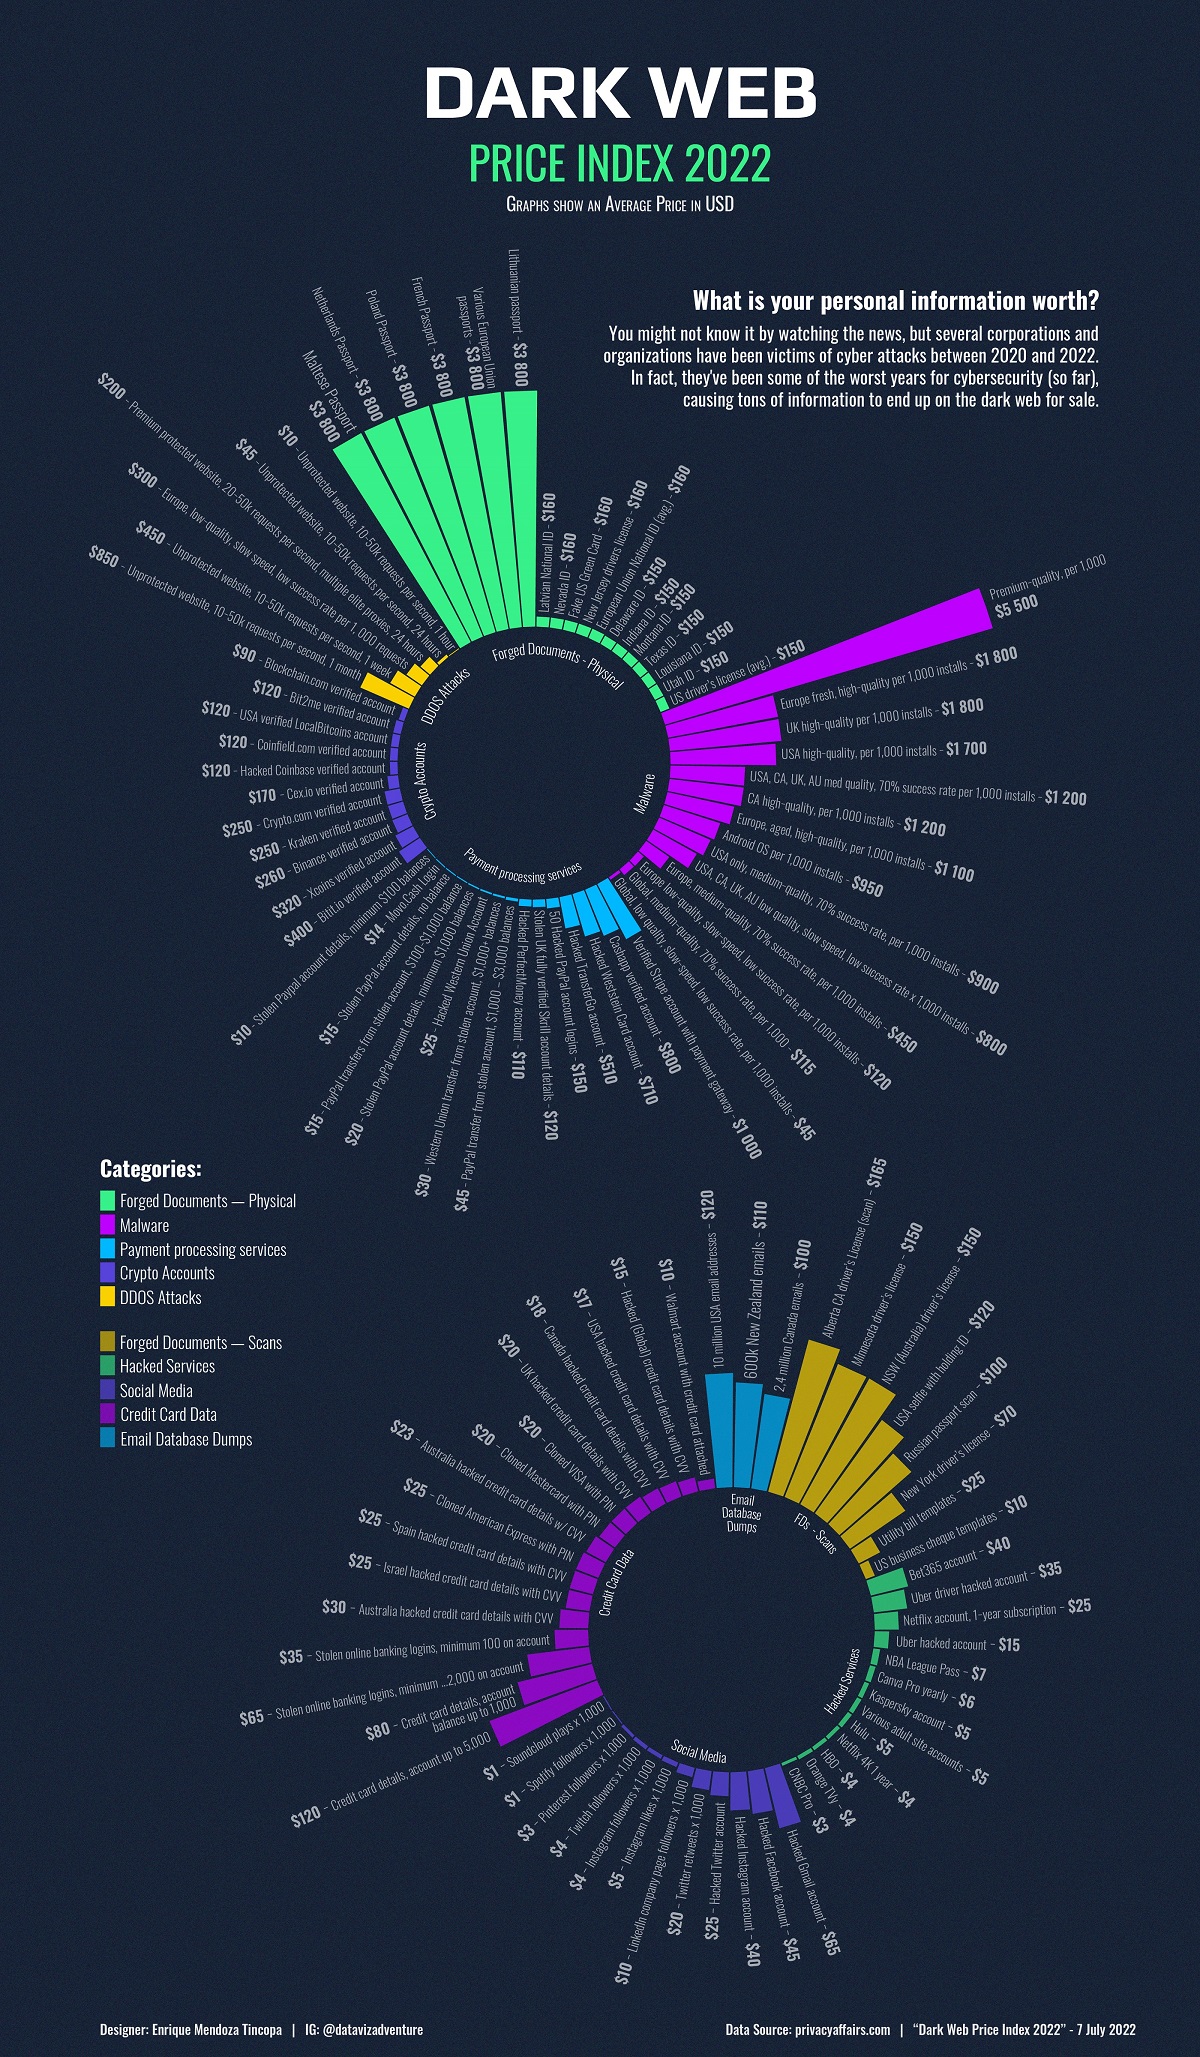
Charted: The Dark Web Price Index 2022
Article/Editing:
Click to view a larger version of the graphic.
The Dark Web Price Index 2022
Did you know that the internet you’re familiar with is only 10% of the total data that makes up the World Wide Web?
The rest of the web is hidden from plain sight, and requires special access to view. It’s known as the Deep Web, and nestled far down in the depths of it is a dark, sometimes dangerous place, known as the darknet, or Dark Web.
This graphic by Enrique Mendoza provides us a glimpse at this shrouded part of the internet, showing us some of the common items that are sold on there, and how much they typically cost.
A Brief Introduction to the Dark Web
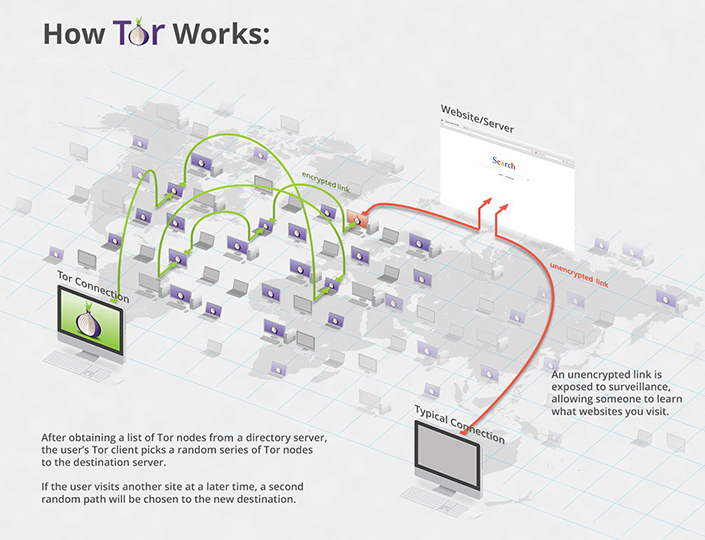
Before diving in, it’s worth quickly explaining what the Dark Web is, and how people typically gain access to it.
Unlike the ordinary web (which is also known as the Surface Web), the Dark Web cannot be accessed through a regular browser such as Chrome or Safari. Rather, users need to access it anonymously via a Tor browser.
Tor, which is short for “The Onion Router,” is a special portal that connects users to Dark Web websites in a complicated way that ultimately protects the user’s identity. This means users can access websites anonymously.
The Dark Web can be a breeding ground for illegal activity, where people can buy things like contract killings, drugs, malware, and other people’s personal information.
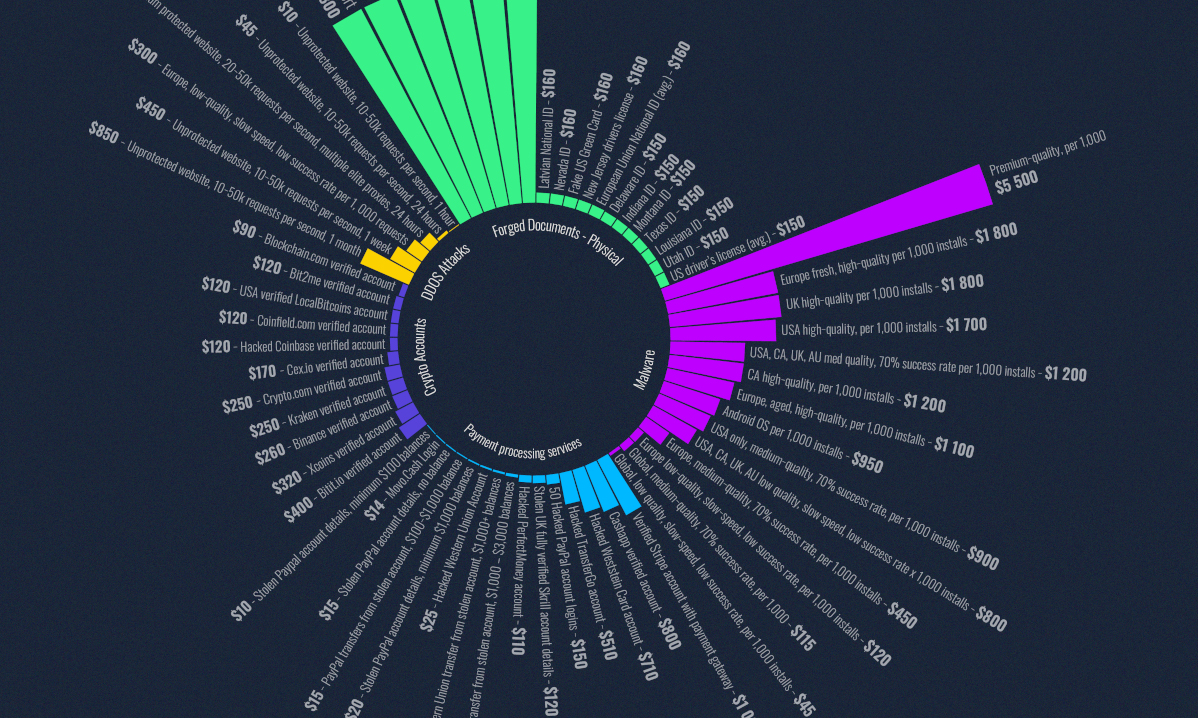
Product Price Breakdown
How much is your personal information worth on the Dark Web? This graphic uses data from the 2022 Dark Web Product Price Index to find that out and more.
This annual report by privacyaffairs.com provides insights into some of the most popular products that are for sale on the Dark Web, such as credit card data, forged documents, and hacked info, and lists the average price of each product.
While this list is far from exhaustive and not the only measure of Dark Web prices, the report gives us a glimpse into hidden online territory that’s extremely unfamiliar to many of us.
| Product | Product Category | Avg. Price USD (2022) |
|---|---|---|
| Credit card details, account balance up to 5,000 | Credit Card Data | $120 |
| Credit card details, account balance up to 1,000 | Credit Card Data | $80 |
| Stolen online banking logins, minimum 2,000 on account | Credit Card Data | $65 |
| Israel hacked credit card details with CVV | Credit Card Data | $25 |
| Hacked (Global) credit card details with CVV | Credit Card Data | $15 |
| Spain hacked credit card details with CVV | Credit Card Data | $25 |
| Cloned American Express with PIN | Credit Card Data | $25 |
| Canada hacked credit card details with CVV | Credit Card Data | $18 |
| Australia hacked credit card details w/ CVV | Credit Card Data | $23 |
| Cloned Mastercard with PIN | Credit Card Data | $20 |
| Cloned VISA with PIN | Credit Card Data | $20 |
| Stolen online banking logins, minimum 100 on account | Credit Card Data | $35 |
| Walmart account with credit card attached | Credit Card Data | $10 |
| USA hacked credit card details with CVV | Credit Card Data | $17 |
| UK hacked credit card details with CVV | Credit Card Data | $20 |
| PayPal transfer from stolen account, $1,000 – $3,000 balances | Payment Processing Services | $45 |
| Cashapp verified account | Payment Processing Services | $800 |
| Stolen PayPal account details, minimum $1,000 balances | Payment Processing Services | $20 |
| Stolen UK fully verified Skrill account details | Payment Processing Services | $120 |
| 50 Hacked PayPal account logins | Payment Processing Services | $150 |
| Hacked PerfectMoney account | Payment Processing Services | $110 |
| PayPal transfers from stolen account, $100-$1,000 balance | Payment Processing Services | $15 |
| Movo.Cash Login | Payment Processing Services | $14 |
| Hacked Western Union Account | Payment Processing Services | $25 |
| Stolen PayPal account details, minimum $100 balances | Payment Processing Services | $10 |
| Western Union transfer from stolen account, $1,000+ balances | Payment Processing Services | $30 |
| Stolen PayPal account details, no balance | Payment Processing Services | $15 |
| Verified Stripe account with payment gateway | Payment Processing Services | $1,000 |
| Hacked Weststein Card account | Payment Processing Services | $710 |
| Hacked TransferGo account | Payment Processing Services | $510 |
| 50 Hacked PayPal account logins | Payment Processing Services | $200 |
| Hacked PerfectMoney account | Payment Processing Services | $160 |
| Hacked UK Neteller account | Payment Processing Services | $70 |
| Hacked Western Union Account | Payment Processing Services | $45 |
| Movo.Cash Login | Payment Processing Services | $14 |
| Stolen PayPal account details, no balance | Payment Processing Services | $14 |
| Kraken verified account | Crypto Accounts | $250 |
| Cex.io verified account | Crypto Accounts | $170 |
| Hacked Coinbase verified account | Crypto Accounts | $120 |
| Coinfield.com verified account | Crypto Accounts | $120 |
| USA verified LocalBitcoins account | Crypto Accounts | $120 |
| Blockchain.com verified account | Crypto Accounts | $90 |
| Crypto.com verified account | Crypto Accounts | $250 |
| Xcoins verified account | Crypto Accounts | $320 |
| bitit.io verified account | Crypto Accounts | $400 |
| Bit2me verified account | Crypto Accounts | $120 |
| Netflix account, 1-year subscription | Hacked Services | $25 |
| Bet365 account | Hacked Services | $40 |
| Kaspersky account | Hacked Services | $5 |
| NBA League Pass | Hacked Services | $7 |
| Various adult site accounts | Hacked Services | $5 |
| Canva Pro yearly | Hacked Services | $6 |
| CNBC Pro | Hacked Services | $3 |
| Netflix 4K 1 year | Hacked Services | $4 |
| HBO | Hacked Services | $4 |
| Orange TV | Hacked Services | $4 |
| Hulu | Hacked Services | $5 |
| Uber hacked account | Hacked Services | $15 |
| Uber driver hacked account | Hacked Services | $35 |
| Utility bill templates | Forged Documents (Scans) | $25 |
| New York driver’s license | Forged Documents (Scans) | $70 |
| US business cheque templates | Forged Documents (Scans) | $10 |
| Russian passport scan | Forged Documents (Scans) | $100 |
| USA selfie with holding ID | Forged Documents (Scans) | $120 |
| Minnesota driver’s license | Forged Documents (Scans) | $150 |
| NSW (Australia) driver’s license | Forged Documents (Scans) | $150 |
| Alberta CA driver’s License (scan) | Forged Documents (Scans) | $165 |
| Maltese Passport | Forged Documents (Physical) | $3,800 |
| Latvian National ID | Forged Documents (Physical) | $160 |
| Netherlands Passport | Forged Documents (Physical) | $3,800 |
| Poland Passport | Forged Documents (Physical) | $3,800 |
| French Passport | Forged Documents (Physical) | $3,800 |
| Various European Union passports | Forged Documents (Physical) | $3,800 |
| Delaware ID | Forged Documents (Physical) | $150 |
| Indiana ID | Forged Documents (Physical) | $150 |
| Montana ID | Forged Documents (Physical) | $150 |
| Nevada ID | Forged Documents (Physical) | $160 |
| Texas ID | Forged Documents (Physical) | $150 |
| Fake US Green Card | Forged Documents (Physical) | $160 |
| New Jersey drivers license | Forged Documents (Physical) | $160 |
| Louisiana ID | Forged Documents (Physical) | $150 |
| Utah ID | Forged Documents (Physical) | $150 |
| European Union National ID (avg.) | Forged Documents (Physical) | $160 |
| US driver’s license | Forged Documents (Physical) | $150 |
| Lithuanian passport | Forged Documents (Physical) | $3,800 |
| 10 million USA email addresses | Email Database Dumps | $120 |
| 600k New Zealand emails | Email Database Dumps | $110 |
| 2,4 million Canada emails | Email Database Dumps | $100 |
| Europe fresh, high-quality per 1,000 installs | Malware | $1,800 |
| UK high-quality per 1,000 installs | Malware | $1,800 |
| Europe low-quality, slow-speed, low success rate, per 1,000 installs | Malware | $120 |
| USA, CA, UK, AU med quality, 70% success rate per 1,000 installs | Malware | $1,200 |
| CA high-quality, per 1,000 installs | Malware | $1,200 |
| USA high-quality, per 1,000 installs | Malware | $1,700 |
| USA, CA, UK, AU low quality, slow speed, low success rate x 1000 installs | Malware | $800 |
| Europe, aged, high-quality, per 1,000 installs | Malware | $1,100 |
| USA only, medium-quality, 70% success rate, per 1,000 installs | Malware | $900 |
| Europe, medium-quality, 70% success rate, per 1,000 installs | Malware | $450 |
| Global, low quality, slow-speed, low success rate, per 1,000 installs | Malware | $45 |
| Global, medium-quality, 70% success rate, per 1,000 | Malware | $115 |
| Android OS per 1,000 installs | Malware | $950 |
| Premium-quality, per 1,000 | Malware | $5,500 |
| Unprotected website, 10-50k requests per second, 1 month | DDOS Attacks | $850 |
| Unprotected website, 10-50k requests per second, 1 week | DDOS Attacks | $450 |
| Europe, low-quality, slow speed, low success rate per 1, 000 requests | DDOS Attacks | $300 |
| Unprotected website, 10-50k requests per second, 1 hour | DDOS Attacks | $10 |
| Unprotected website, 10-50k requests per second, 24 hours | DDOS Attacks | $45 |
| Premium protected website, 20-50k requests per second, multiple elite proxies, 24 hours | DDOS Attacks | $200 |
One of the most expensive items included in the dataset is premium malware, which costs about $5,500 per 1,000 installs. While the cost for premium malware is hefty, there are still billions of malware attacks occurring every year causing huge monetary damage.
On the other end of the spectrum are Paypal account details, Netflix logins, or stolen credit card details (complete with a CVV) all available for less than $20.
How to Protect Your Personal Information
As the line between the digital and physical realm becomes increasingly blurry, it’s more important than ever to make sure you’re protecting yourself and your personal information from identity theft.
According to Privacy Affairs, there are several proactive measures you can take to decrease your chances of getting hacked. This includes using a VPN whenever you access public Wi-Fi, using different passwords for different online accounts, and investing in anti-malware software to combat unwanted visitors.

This article was published as a part of Visual Capitalist's Creator Program, which features data-driven visuals from some of our favorite Creators around the world.


Technology
Visualizing AI Patents by Country
See which countries have been granted the most AI patents each year, from 2012 to 2022.


Visualizing AI Patents by Country
This was originally posted on our Voronoi app. Download the app for free on iOS or Android and discover incredible data-driven charts from a variety of trusted sources.
This infographic shows the number of AI-related patents granted each year from 2010 to 2022 (latest data available). These figures come from the Center for Security and Emerging Technology (CSET), accessed via Stanford University’s 2024 AI Index Report.
From this data, we can see that China first overtook the U.S. in 2013. Since then, the country has seen enormous growth in the number of AI patents granted each year.
| Year | China | EU and UK | U.S. | RoW | Global Total |
|---|---|---|---|---|---|
| 2010 | 307 | 137 | 984 | 571 | 1,999 |
| 2011 | 516 | 129 | 980 | 581 | 2,206 |
| 2012 | 926 | 112 | 950 | 660 | 2,648 |
| 2013 | 1,035 | 91 | 970 | 627 | 2,723 |
| 2014 | 1,278 | 97 | 1,078 | 667 | 3,120 |
| 2015 | 1,721 | 110 | 1,135 | 539 | 3,505 |
| 2016 | 1,621 | 128 | 1,298 | 714 | 3,761 |
| 2017 | 2,428 | 144 | 1,489 | 1,075 | 5,136 |
| 2018 | 4,741 | 155 | 1,674 | 1,574 | 8,144 |
| 2019 | 9,530 | 322 | 3,211 | 2,720 | 15,783 |
| 2020 | 13,071 | 406 | 5,441 | 4,455 | 23,373 |
| 2021 | 21,907 | 623 | 8,219 | 7,519 | 38,268 |
| 2022 | 35,315 | 1,173 | 12,077 | 13,699 | 62,264 |
In 2022, China was granted more patents than every other country combined.
While this suggests that the country is very active in researching the field of artificial intelligence, it doesn’t necessarily mean that China is the farthest in terms of capability.
Key Facts About AI Patents
According to CSET, AI patents relate to mathematical relationships and algorithms, which are considered abstract ideas under patent law. They can also have different meaning, depending on where they are filed.
In the U.S., AI patenting is concentrated amongst large companies including IBM, Microsoft, and Google. On the other hand, AI patenting in China is more distributed across government organizations, universities, and tech firms (e.g. Tencent).
In terms of focus area, China’s patents are typically related to computer vision, a field of AI that enables computers and systems to interpret visual data and inputs. Meanwhile America’s efforts are more evenly distributed across research fields.
Learn More About AI From Visual Capitalist
If you want to see more data visualizations on artificial intelligence, check out this graphic that shows which job departments will be impacted by AI the most.

-

 Markets1 week ago
U.S. Debt Interest Payments Reach $1 Trillion
-

 Business2 weeks ago
Charted: Big Four Market Share by S&P 500 Audits
-

 Real Estate2 weeks ago
Ranked: The Most Valuable Housing Markets in America
-

 Money2 weeks ago
Which States Have the Highest Minimum Wage in America?
-

 AI2 weeks ago
Ranked: Semiconductor Companies by Industry Revenue Share
-

 Markets2 weeks ago
Ranked: The World’s Top Flight Routes, by Revenue
-

 Demographics2 weeks ago
Population Projections: The World’s 6 Largest Countries in 2075
-

 Markets2 weeks ago
The Top 10 States by Real GDP Growth in 2023