Misc
Millennials are Buying Their First Homes, and Here’s What They Want

Millennials are Buying Their First Homes, and Here’s What They Want
Authorities disagree on the exact birth years of the Millennial generation: for example, Pew Research defines Millennials as being born between 1981-1997, the US Census Bureau claims 1982-2000, and the National Association of Realtors says 1980-1995.
However, what all these same sources agree upon is that the Millennials are the largest and most powerful demographic force in North America.
In the United States specifically, Millennials account for a quarter of the entire population with a total of 83.1 million people in the demographic. This is a group that makes up the next generation of investors, continues to struggle with mounting student debt, thinks about money differently, and is now buying homes for the first time.
Marketers in all industries have tried to nail down the preferences of Millennials for some time. Millennials have made things especially more difficult for the real estate industry, as they have delayed common life milestones such as marriage, having children, and home ownership. It is only over the last few years, as Millennials have started to buy homes in significant numbers, that the industry has truly understood what the group wants to see in a home.
Millennial home buyers make up 68% of all first-time home buyers right now, and here’s their average profile: 29 years old, a median income of $76,900, and a typical home purchase (median) of $189,900 for a 1,720 sq. ft home. Of these buyers, 84% believe a home to be a good investment.
Where do Millennials want to buy? About half of the cohort (49%) wants to buy in the suburbs, while 21% would prefer to buy in an urban area. In terms of choosing a specific neighborhood, the most-cited factors affecting Millennials’ decisions were the quality of neighborhood (75%), convenience of getting to job (74%), affordability of home (58%), proximity to friends and family (49%), and quality of the school district (44%).
Today, 32% of all home purchases are made by Millennials, but the reality is that many are still holding off on buying. The major reason for that is student debt, which 54% cited as the biggest obstacle to home ownership. In fact, about one-quarter of all Millennials still live with their parents.
Other reasons cited for not owning a home yet? They include: excessive debt, rising rents, slowing wage growth, tight-lending environment, can’t find home in desired price range, increased college enrollment, and delayed marriage/children.
Original graphic by: UpNest
Politics
Charted: Trust in Government Institutions by G7 Countries
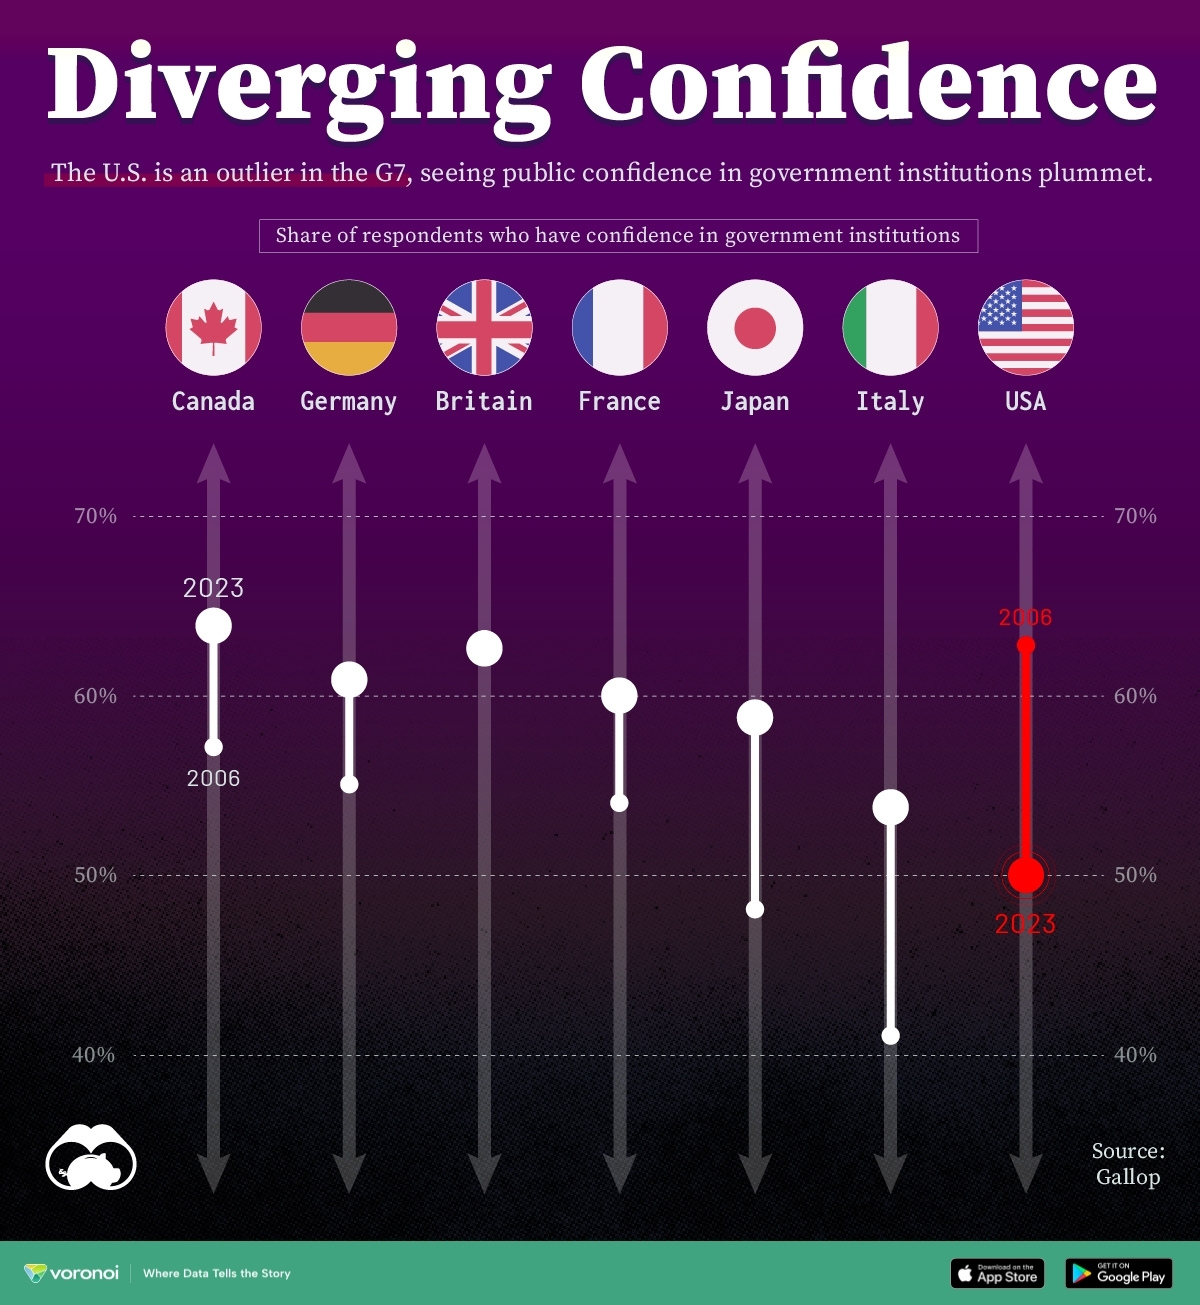
How much do you trust the government and its various institutions? We look at data for G7 countries for the time period of 2006-2023.
Trust in Government Institutions by G7 Countries
This was originally posted on our Voronoi app. Download the app for free on iOS or Android and discover incredible data-driven charts from a variety of trusted sources.
How much do you trust the government, and its various institutions?
It’s likely that your level of confidence probably depends on a wide range of factors, such as perceived competency, historical context, economic performance, accountability, social cohesion, and transparency.
And for these same reasons, trust levels in government institutions also change all the time, even in the world’s most developed countries: the G7.
Confidence in Government by G7 Countries (2006-2023)
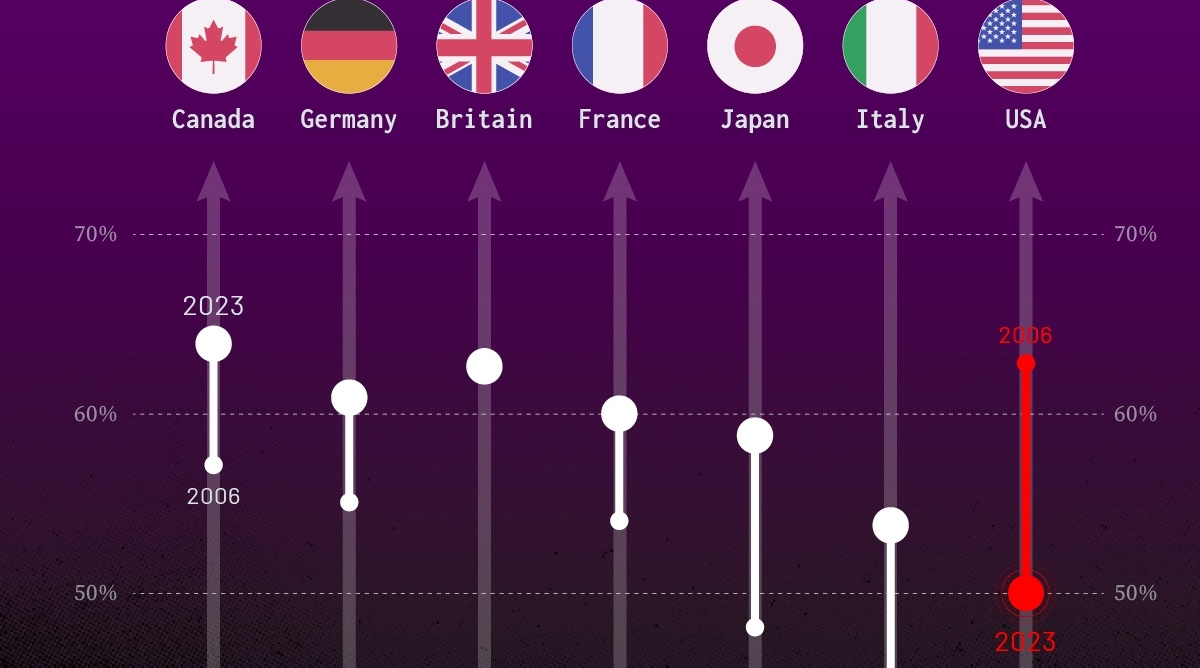
This chart looks at the changes in trust in government institutions between the years 2006 and 2023, based on data from a multi-country Gallup poll.
Specifically, this dataset aggregates confidence in multiple national institutions, including the military, the judicial system, the national government, and the integrity of the electoral system.
| Country | Confidence (2006) | Confidence (2023) | Change (p.p.) |
|---|---|---|---|
| Canada | 57% | 64% | +7 |
| Britain | 63% | 63% | +0 |
| Germany | 55% | 61% | +6 |
| France | 54% | 60% | +6 |
| Japan | 48% | 59% | +11 |
| Italy | 41% | 54% | +13 |
| United States | 63% | 50% | -13 |
What’s interesting here is that in the G7, a group of the world’s most developed economies, there is only one country bucking the general trend: the United States.
Across most G7 countries, confidence in institutions has either improved or stayed the same between 2006 and 2023. The largest percentage point (p.p.) increases occur in Italy and Japan, which saw +13 p.p. and +11 p.p. increases in trust over the time period.
In the U.S., however, confidence in government institutions has fallen by 13 p.p. over the years. What happened?
Key Figures on U.S. Trust in Institutions
In 2006, the U.S. was tied with the UK as having the highest confidence in government institutions, at 63%.
But here’s where the scores stand in 2023, across various institutions:
| 🇺🇸 Institutions | Confidence (2023) |
|---|---|
| Military | 81% |
| Judiciary | 42% |
| National Government | 30% |
| Elections | 44% |
| Overall | 49% |
Based on this data, it’s clear that the U.S. lags behind in three key indicators: confidence in the national government, confidence in the justice system, and confidence in fair elections. It ranked in last place for each indicator in the G7.
One other data point that stands out: despite leading the world in military spending, the U.S. is only the third most confident in its military in the G7. It lags behind France (86%) and the United Kingdom (83%).
-

 Wealth6 days ago
Charted: Which City Has the Most Billionaires in 2024?
-

 Mining2 weeks ago
Gold vs. S&P 500: Which Has Grown More Over Five Years?
-

 Uranium2 weeks ago
The World’s Biggest Nuclear Energy Producers
-

 Education2 weeks ago
How Hard Is It to Get Into an Ivy League School?
-

 Debt2 weeks ago
How Debt-to-GDP Ratios Have Changed Since 2000
-

 Sports2 weeks ago
The Highest Earning Athletes in Seven Professional Sports
-

 Science2 weeks ago
Visualizing the Average Lifespans of Mammals
-

 Brands1 week ago
How Tech Logos Have Evolved Over Time


