Real Estate
Mapping Affordability in the Epicenter of Canada’s Housing Bubble
Mapping Affordability in the Epicenter of Canada’s Housing Bubble
At the epicenter of Canada’s housing bubble, which is now rated as the most overvalued in the world, is the west coast city of Vancouver. It’s there that low interest rates and foreign buying have fueled the average detached home price to a record of C$1.47 million, a 20% increase from the previous year.
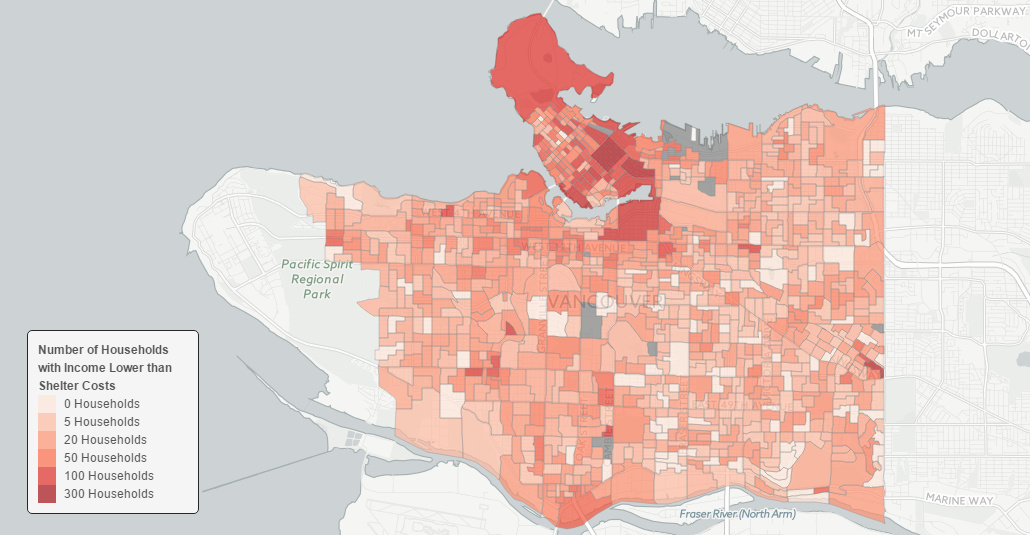
While there are many measures of unaffordability, the government and federal agencies frequently use one such measure called the Shelter-cost to Income Ratio. It essentially compares the annual cost of an individual’s housing with the amount of income they have coming in each year. Federal agencies in Canada consider households that spend 30% or more of total before-tax household income on shelter expenses to have a “housing affordability” problem.
In Vancouver, however, the city has become so unaffordable that 25,000 households pay more for their shelter costs than their entire declared income. This works out to 9.5% of the households in the city – far higher than Greater Toronto (5.9%) or Montreal (5%).
We recently stumbled across a data mapping project by Jens von Bergmann, via the Hongcouver blog. Von Bergmann, who runs a data firm in Vancouver, has compiled a series of interactive maps that overlay census data onto the city. In Canada, the mandatory census happens every five years and creates a wealth of granular information.
Here’s the percent of people in each city block that pay more for housing than they take home in income:
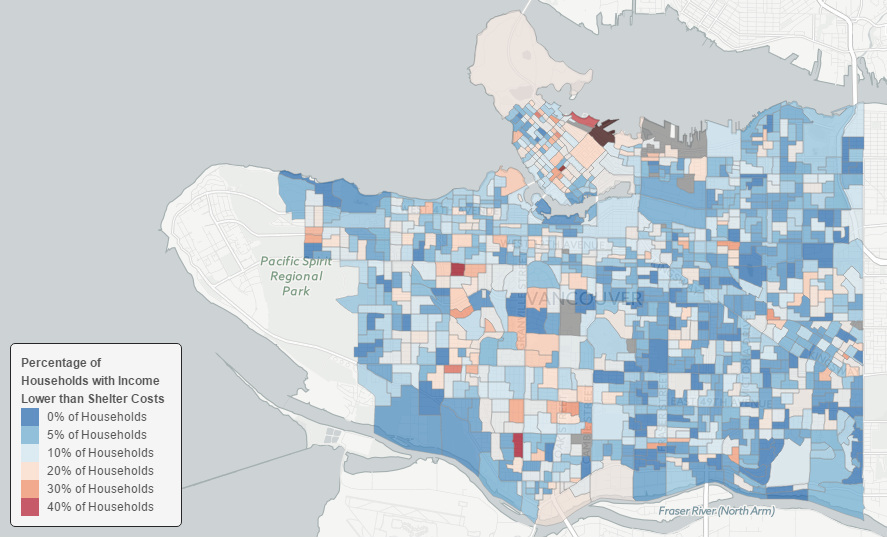
In an example neighborhood pocket (dissemination area 59150581) located between Arbutus and Macdonald streets, 44.8% of households pay more for shelter than they bring in for income. The average value for each “shelter”? A cool C$1.98 million. Yet, the median individual income in the area is only C$19,993.
Things get stranger yet in Vancouver’s high-end Coal Harbour neighborhood, where somehow 62% of households claim to have lower income than shelter costs. In a pocket of Yaletown, 50% of people make less than the cost of their housing.
While the precision of the data is excellent, the only problem with it is that the last census in Canada took place in 2011. Four years ago, housing prices were a fraction of what they are today. Compare today’s price of a detached home (C$1.47 million) to the price in August 2011: C$888,243.
Have median wages jumped this much? Not likely – the problem is only getting worse.
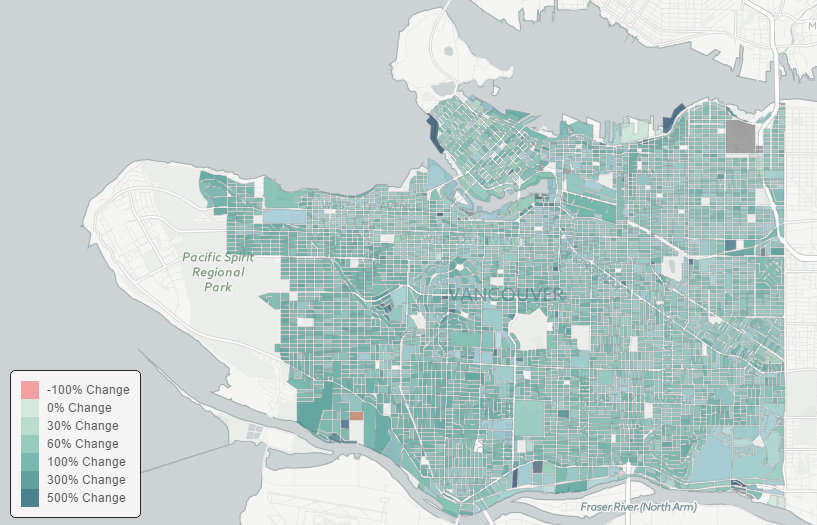
Here’s how the value of land has changed by block from 2006 to 2014 according to some of von Bergmann’s other data based on City of Vancouver assessment records:
Despite the country entering a technical recession, consumers having record-high debt, and commodity markets getting routed, Vancouver’s market is still flying high today.
Housing sales in August 2015 were up 28% compared to the ten-year average, and the median price in Vancouver’s west side is entering “crazy” territory at C$2.87 million. While it is true that shelter in the epicenter of Canada’s housing bubble may seem quite expensive, at least the homes don’t look like crack shacks. Or do they?


Real Estate
Ranked: The Most Valuable Housing Markets in America
The U.S. residential real estate market is worth a staggering $47.5 trillion. Here are the most valuable housing markets in the country.
The Most Valuable Housing Markets in America
This was originally posted on our Voronoi app. Download the app for free on iOS or Android and discover incredible data-driven charts from a variety of trusted sources.
The residential real estate market in the U.S. stands as one of the largest asset classes in the country, worth $47.5 trillion in 2023.
Despite a slowdown in home sales, the total value of homes increased $2.4 trillion last year as low inventory levels pushed up prices. Affordable metropolitan areas saw steady price growth, while expensive metros experienced slower price appreciation.
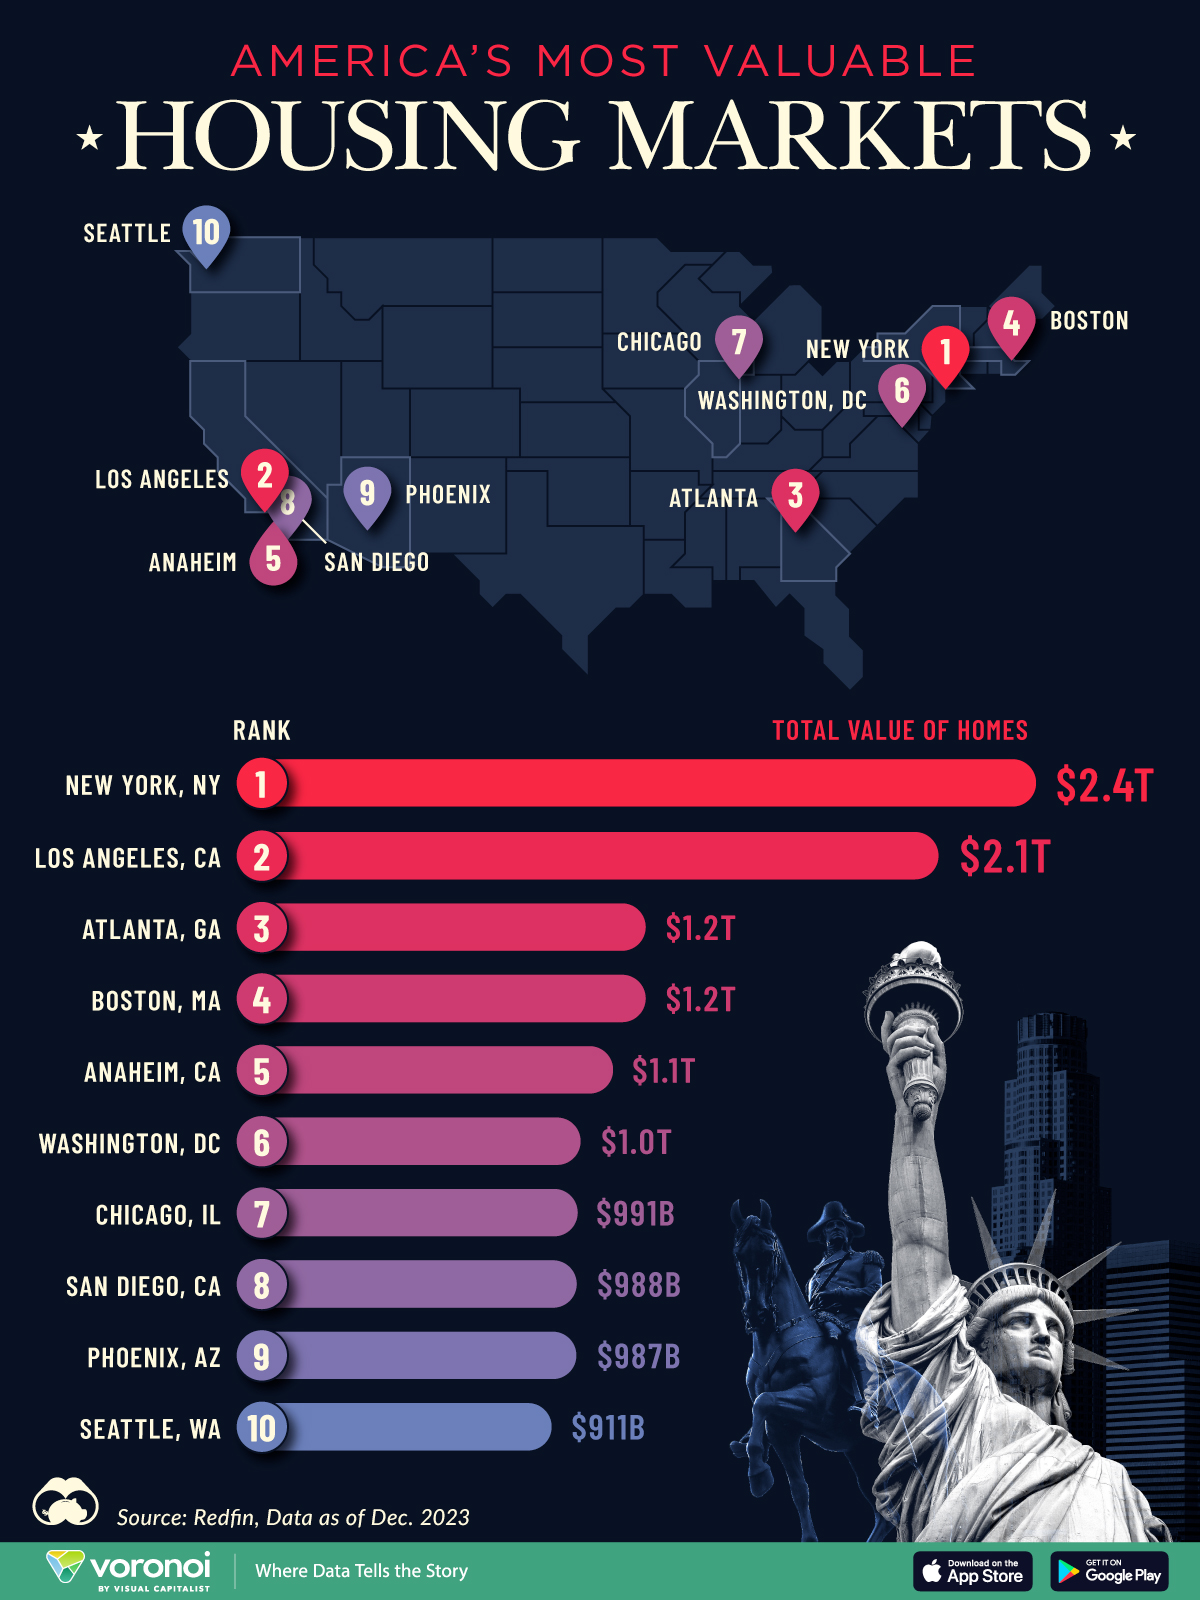
This graphic shows America’s most valuable housing markets, using data from Redfin.
Top U.S. Residential Real Estate Markets
To calculate the largest U.S. housing markets, Redfin analyzed 90 million properties covering single-family homes, townhouses, condos, and two-to four-unit multifamily properties.
Below, we show the most valuable residential markets as of December 2023:
| Rank | U.S. Metro | Total Value of Homes | Total Value of Homes YoY Change |
|---|---|---|---|
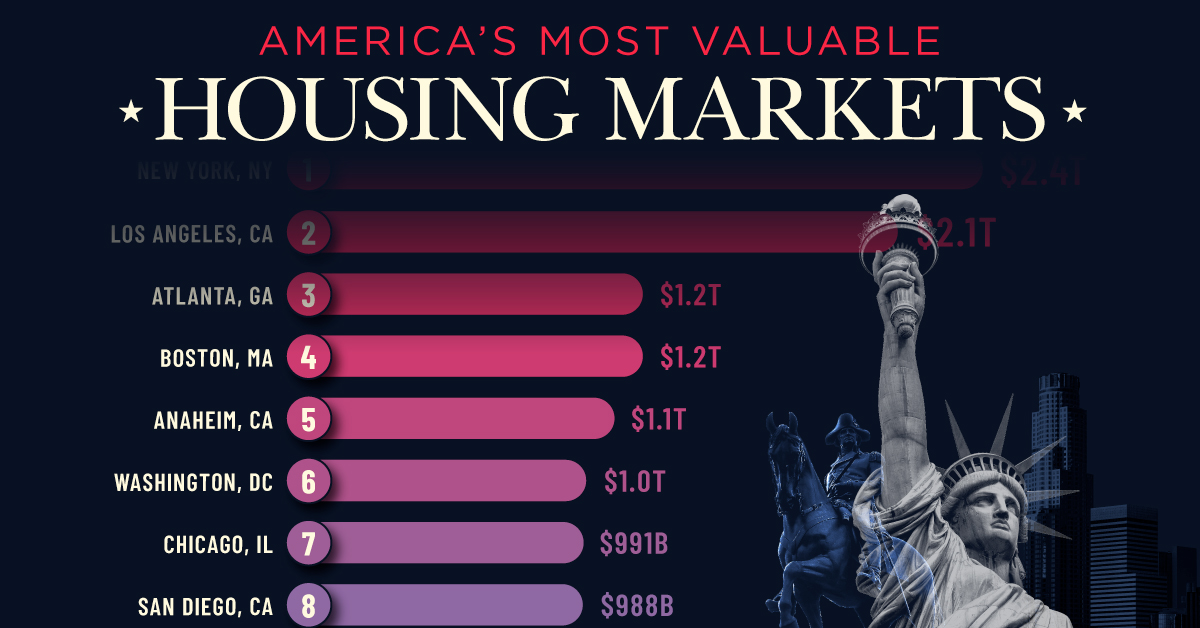
| 1 | New York, NY | $2.4T | -1.0% |
| 2 | Los Angeles, CA | $2.1T | +4.3% |
| 3 | Atlanta, GA | $1.2T | +6.2% |
| 4 | Boston, MA | $1.2T | +8.3% |
| 5 | Anaheim, CA | $1.1T | +8.0% |
| 6 | Washington, DC | $1.0T | +6.2% |
| 7 | Chicago, IL | $991B | +7.4% |
| 8 | San Diego, CA | $988B | +9.4% |
| 9 | Phoenix, AZ | $987B | +4.2% |
| 10 | Seattle, WA | $911B | +4.6% |
With a housing market worth $2.4 trillion, New York, NY tops the list.
Unlike the majority of large U.S. cities, the aggregate value of homes declined as buyers became increasingly priced out of the market. At the same time, homeowners hesitated to sell in order to lock in low mortgage rates. In fact, more than 80% of mortgage holders in New York City have interest rates that are 5% or lower.
Los Angeles, CA falls in second, with a residential real estate market worth $2.0 trillion. Last year, existing home sales tumbled 24.8%, falling to the lowest point since 2007. However, the housing shortage led prices to increase amid high demand. The median sale price climbed to $975,000 in February 2024, a 5.9% jump compared to the same time last year.
Atlanta, GA ranks third and is the most overpriced housing market in the country according to one countrywide analysis. Homes have been selling for 41.7% more than their worth as of the February 2024 data update.
People are flocking to the city for many reasons. General housing affordability is a major driver, along with its thriving tech center. Along with this, state tax credits have increasingly made it a hub for the TV and film industries, earning it the moniker “Y’allywood”. Another factor in Atlanta’s inflating housing market are large investment firms, which own a huge footprint of homes in the city.
Editor’s note: For those wondering about the Bay Area, the data groups cities like San Francisco ($657 billion), San Jose ($821 billion), and Oakland ($881 billion) as individual entities, which puts them outside the cutoff. See the Redfin data for the full list of cities.

-

 Green2 weeks ago
Ranked: Top Countries by Total Forest Loss Since 2001
-

 Travel1 week ago
Ranked: The World’s Top Flight Routes, by Revenue
-

 Technology1 week ago
Ranked: Semiconductor Companies by Industry Revenue Share
-

 Money2 weeks ago
Which States Have the Highest Minimum Wage in America?
-

 Real Estate2 weeks ago
Ranked: The Most Valuable Housing Markets in America
-

 Markets2 weeks ago
Charted: Big Four Market Share by S&P 500 Audits
-

 AI2 weeks ago
The Stock Performance of U.S. Chipmakers So Far in 2024
-

 Automotive2 weeks ago
Almost Every EV Stock is Down After Q1 2024