Politics
Map: A Visual Guide To Europe’s Member States
Map: A Visual Guide To Europe’s Member States
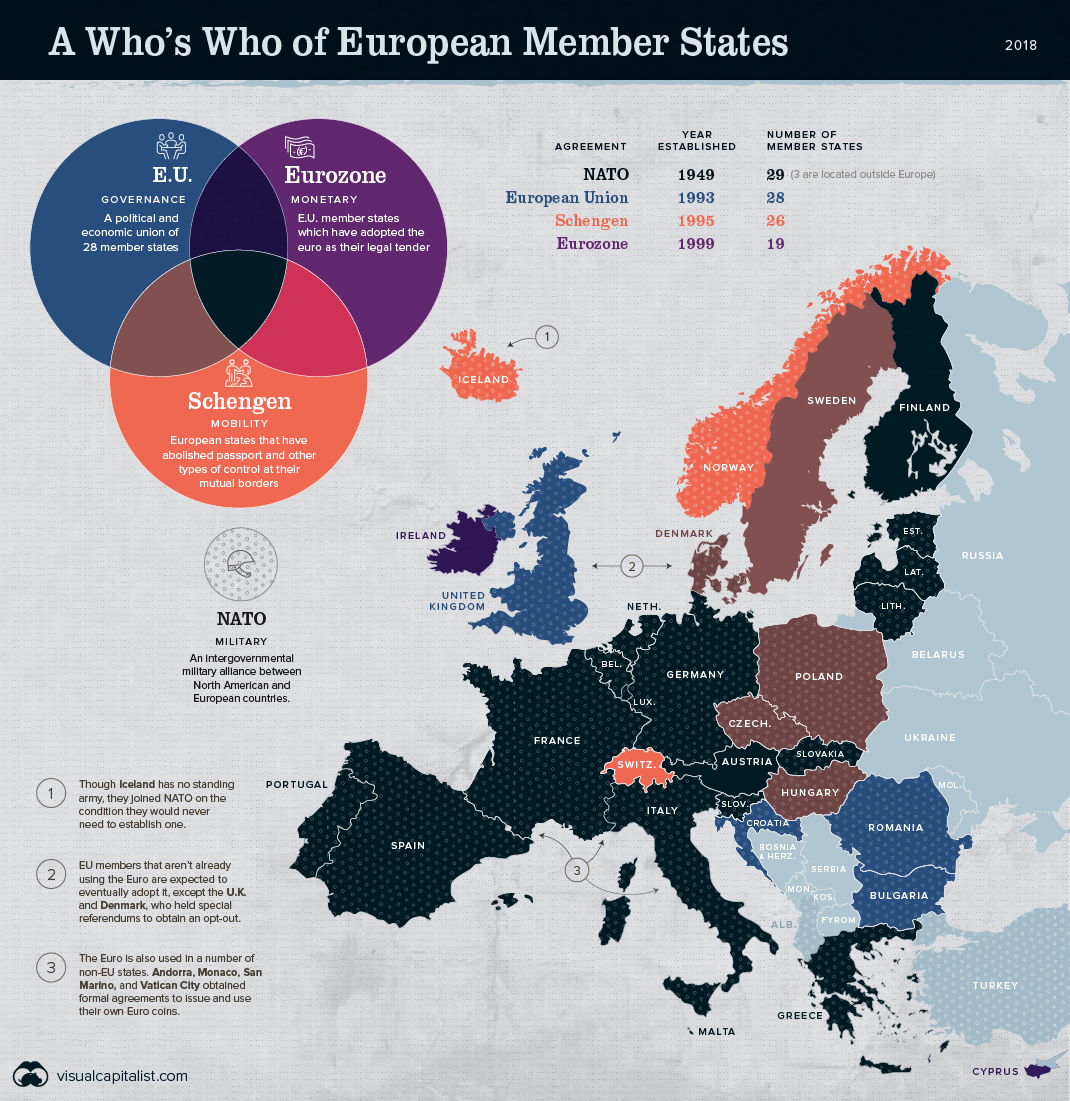
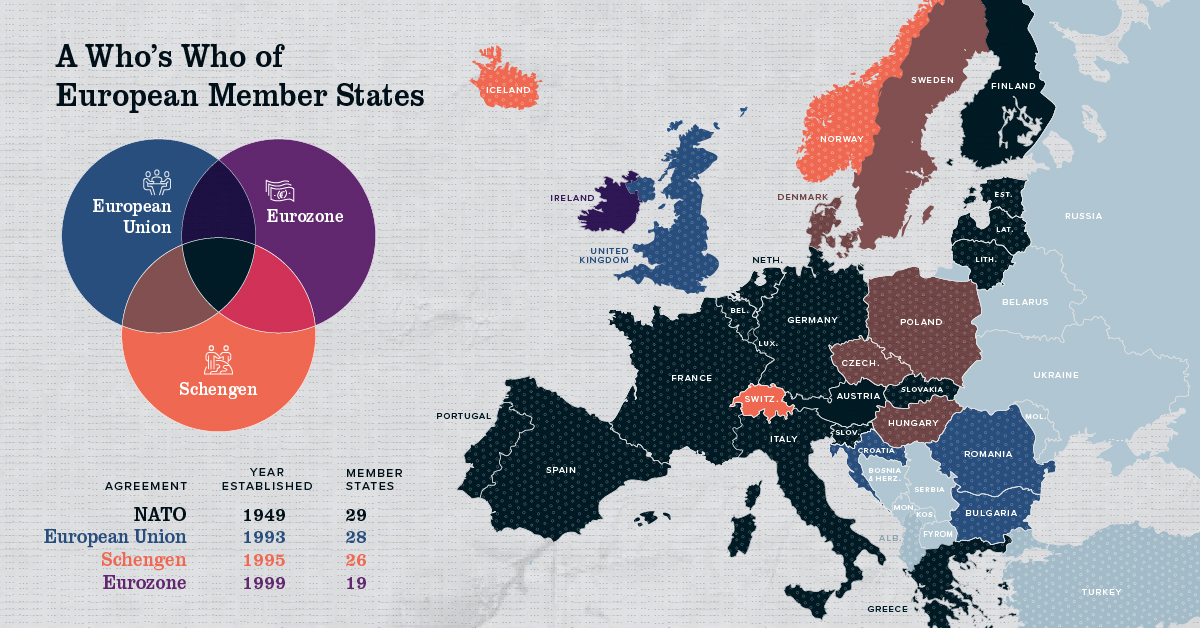
EU, NATO, and Schengen, oh my!
Amidst whispers of Brexit and potential changes within NATO, you might be wondering how these organizations fit into the big picture of Europe’s member states.
Europe has members in at least four major treaty groups, each of which governs a different aspect of the region’s infrastructure.
Let’s break down each group:
European Union (EU)
The European Union is primarily a political organization. It promotes economic, social, and political cooperation among its member states, encompassing more than 510 million citizens. The last nation to join was Croatia in 2013, while the United Kingdom will be the first to officially withdraw on March 29, 2019.
The EU is governed according to a supranational parliamentary system, with representatives elected by member states. The union maintains common policies on trade, agriculture, and regional development. It also enacts legislation on justice and home affairs, ensuring the free movement of people, goods, services, and capital within its borders.
The EU was awarded the Nobel Peace Prize in 2017 for its contribution to the “advancement of peace and reconciliation, democracy, and human rights in Europe.”
North Atlantic Treaty Organization (NATO)
NATO is a military alliance between the United States, Canada, Turkey, and 26 other European countries.
Established in 1949 as a response to post-WW2 Soviet aggression, NATO exists for the collective defense and security of the group. Members share few laws and regulations, but an attack on one constitutes an attack on all, and member states are obligated to act in defense of one another.
Iceland remains the only member without armed forces. Their strategic geographic location earned them a spot as a founding member of NATO, but they have no standing army and joined on the condition they would never need to establish one.
Eurozone
The Eurozone is a monetary union of 19 EU nations which have adopted the Euro as their common currency.
Established in 1999 to control inflation, the Eurozone is managed by a board of central banks, but members share no fiscal policies. The remaining EU members are obliged to adopt the Euro at some point in the future, except for the UK and Denmark, who are exempt and permitted to retain a unique currency.
The Euro is also used in a number of non-EU states. Andorra, Monaco, San Marino, and Vatican City obtained formal agreements to issue and use their own Euro coins. Kosovo and Montenegro also adopted the Euro, but without formal permission, meaning they cannot legally issue currency.
Schengen
This grouping of 26 European states abolished passports and other types of border control at their mutual borders in 1995. For travel purposes, Schengen states function as a single country with a common visa policy.
This visa doesn’t cover residency or work permits, but allows tourists and visitors to obtain a single visa for the entire area, making border restrictions virtually non-existent. While travellers face stringent controls when entering or leaving the Schengen zones, visa holders can pass between Schengen countries without a passport or ID.
Monaco, San Marino, and Vatican City are not formally part of Schengen, but maintain open borders within the Schengen area.
The map of Europe’s member states has changed constantly over thousands of years. As political shakeups continue and the United Kingdom prepares for their exit from the EU, it might be interesting to see how different this map looks a few years from now.


Economy
The Bloc Effect: International Trade with Geopolitical Allies on the Rise
Rising geopolitical tensions are shaping the future of international trade, but what is the effect on trading among G7 and BRICS countries?


The Bloc Effect: International Trade with Allies on the Rise
International trade has become increasingly fragmented over the last five years as countries have shifted to trading more with their geopolitical allies.
This graphic from The Hinrich Foundation, the first in a three-part series covering the future of trade, provides visual context to the growing divide in trade in G7 and pre-expansion BRICS countries, which are used as proxies for geopolitical blocs.
Trade Shifts in G7 and BRICS Countries
This analysis uses IMF data to examine differences in shares of exports within and between trading blocs from 2018 to 2023. For example, we looked at the percentage of China’s exports with other BRICS members as well as with G7 members to see how these proportions shifted in percentage points (pp) over time.
Countries traded nearly $270 billion more with allies in 2023 compared to 2018. This shift came at the expense of trade with rival blocs, which saw a decline of $314 billion.
Country Change in Exports Within Bloc (pp) Change in Exports With Other Bloc (pp)
🇮🇳 India 0.0 3.9
🇷🇺 Russia 0.7 -3.8
🇮🇹 Italy 0.8 -0.7
🇨🇦 Canada 0.9 -0.7
🇫🇷 France 1.0 -1.1
🇪🇺 EU 1.1 -1.5
🇩🇪 Germany 1.4 -2.1
🇿🇦 South Africa 1.5 1.5
🇺🇸 U.S. 1.6 -0.4
🇯🇵 Japan 2.0 -1.7
🇨🇳 China 2.1 -5.2
🇧🇷 Brazil 3.7 -3.3
🇬🇧 UK 10.2 0.5
All shifts reported are in percentage points. For example, the EU saw its share of exports to G7 countries rise from 74.3% in 2018 to 75.4% in 2023, which equates to a 1.1 percentage point increase.
The UK saw the largest uptick in trading with other countries within the G7 (+10.2 percentage points), namely the EU, as the post-Brexit trade slump to the region recovered.
Meanwhile, the U.S.-China trade dispute caused China’s share of exports to the G7 to fall by 5.2 percentage points from 2018 to 2023, the largest decline in our sample set. In fact, partly as a result of the conflict, the U.S. has by far the highest number of harmful tariffs in place.
The Russia-Ukraine War and ensuing sanctions by the West contributed to Russia’s share of exports to the G7 falling by 3.8 percentage points over the same timeframe.
India, South Africa, and the UK bucked the trend and continued to witness advances in exports with the opposing bloc.
Average Trade Shifts of G7 and BRICS Blocs
Though results varied significantly on a country-by-country basis, the broader trend towards favoring geopolitical allies in international trade is clear.
Bloc Change in Exports Within Bloc (pp) Change in Exports With Other Bloc (pp)
Average 2.1 -1.1
BRICS 1.6 -1.4
G7 incl. EU 2.4 -1.0
Overall, BRICS countries saw a larger shift away from exports with the other bloc, while for G7 countries the shift within their own bloc was more pronounced. This implies that though BRICS countries are trading less with the G7, they are relying more on trade partners outside their bloc to make up for the lost G7 share.
A Global Shift in International Trade and Geopolitical Proximity
The movement towards strengthening trade relations based on geopolitical proximity is a global trend.
The United Nations categorizes countries along a scale of geopolitical proximity based on UN voting records.
According to the organization’s analysis, international trade between geopolitically close countries rose from the first quarter of 2022 (when Russia first invaded Ukraine) to the third quarter of 2023 by over 6%. Conversely, trade with geopolitically distant countries declined.
The second piece in this series will explore China’s gradual move away from using the U.S. dollar in trade settlements.
Visit the Hinrich Foundation to learn more about the future of geopolitical trade

-

 Economy2 days ago
Economic Growth Forecasts for G7 and BRICS Countries in 2024
The IMF has released its economic growth forecasts for 2024. How do the G7 and BRICS countries compare?
-

 United States2 weeks ago
Ranked: The Largest U.S. Corporations by Number of Employees
We visualized the top U.S. companies by employees, revealing the massive scale of retailers like Walmart, Target, and Home Depot.
-

 Economy2 weeks ago
Where U.S. Inflation Hit the Hardest in March 2024
We visualized product categories that saw the highest % increase in price due to U.S. inflation as of March 2024.
-

 Economy1 month ago
G20 Inflation Rates: Feb 2024 vs COVID Peak
We visualize inflation rates across G20 countries as of Feb 2024, in the context of their COVID-19 pandemic peak.
-

 Economy1 month ago
Mapped: Unemployment Claims by State
This visual heatmap of unemployment claims by state highlights New York, California, and Alaska leading the country by a wide margin.
-

 Markets2 months ago
Confidence in the Global Economy, by Country
Will the global economy be stronger in 2024 than in 2023?


-

 Debt1 week ago
How Debt-to-GDP Ratios Have Changed Since 2000
-

 Markets2 weeks ago
Ranked: The World’s Top Flight Routes, by Revenue
-

 Demographics2 weeks ago
Population Projections: The World’s 6 Largest Countries in 2075
-

 Markets2 weeks ago
The Top 10 States by Real GDP Growth in 2023
-

 Demographics2 weeks ago
The Smallest Gender Wage Gaps in OECD Countries
-
Economy2 weeks ago
Where U.S. Inflation Hit the Hardest in March 2024
-

 Green2 weeks ago
Top Countries By Forest Growth Since 2001
-
United States2 weeks ago
Ranked: The Largest U.S. Corporations by Number of Employees