Visualized: Interest Rate Forecasts for Advanced Economies
The Best U.S. Companies to Work for According to LinkedIn
The Top Private Equity Firms by Country
Economic Growth Forecasts for G7 and BRICS Countries in 2024
U.S. Debt Interest Payments Reach $1 Trillion
All of the Grants Given by the U.S. CHIPS Act
Visualizing AI Patents by Country
How Tech Logos Have Evolved Over Time
Ranked: Semiconductor Companies by Industry Revenue Share
The Stock Performance of U.S. Chipmakers So Far in 2024
Ranked: The Top 20 Countries in Debt to China
Charted: Which Country Has the Most Billionaires in 2024?
Charted: Which City Has the Most Billionaires in 2024?
Charted: Who Has Savings in This Economy?
How Debt-to-GDP Ratios Have Changed Since 2000
The Cost of an EpiPen in Major Markets
Charted: Global Tobacco Use by Country and Sex
Visualized: What Lives in Your Gut Microbiome?
Charted: Average Years Left to Live by Age
Charted: The Average Cost of Insulin By Country
Mapped: The Age of Energy Projects in Interconnection Queues, by State
Ranked: The Top 10 EV Battery Manufacturers in 2023
The World’s Biggest Nuclear Energy Producers
The World’s Biggest Oil Producers in 2023
How Much Does the U.S. Depend on Russian Uranium?
The Largest Earthquakes in the New York Area (1970-2024)
Mapped: Average Wages Across Europe
Mapped: Asia’s Population Patterns by Density
A Map of Global Happiness By Country in 2024
Mapped: Population Growth by Region (1900-2050F)
Visualizing Global Gold Production in 2023
Gold vs. S&P 500: Which Has Grown More Over Five Years?
Charted: The Value Gap Between the Gold Price and Gold Miners
Charted: Global Uranium Reserves, by Country
The Carbon Footprint of Major Travel Methods
Ranking the Top 15 Countries by Carbon Tax Revenue
Ranked: The Countries With the Most Air Pollution in 2023
Top Countries By Forest Growth Since 2001
Ranked: Top Countries by Total Forest Loss Since 2001
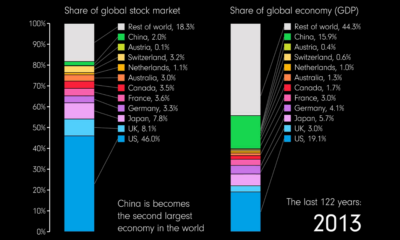
Stock Market vs. GDP Share, by Country (1900-2022) While the distribution of global GDP has diversified over time, the global stock market remains dominated by a...
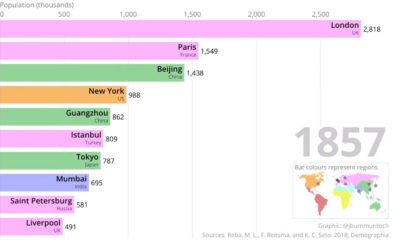
Animation: The Most Populous Cities, Over 500 Years What do Beijing, Tokyo, Istanbul, London, and New York City all have in common? Not only are they...
...watch out for while viewing the animation. 1880s: Breaking the 50-Year Barrier In the late 19th century, Nordic countries such as Sweden and Norway already found...
...we see shaping our economic future. Honorable mentions: Animation: The World’s 10 Largest Economies by GDP (1960-Today) This enthralling animation shows the rise and fall of...
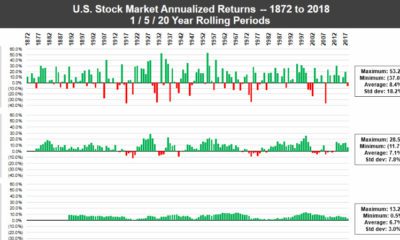
...is virtually irrefutable: U.S. markets have consistently performed over long holding periods, even going back to the 19th century. Market Performance (1872-2018) Today’s animation comes to...
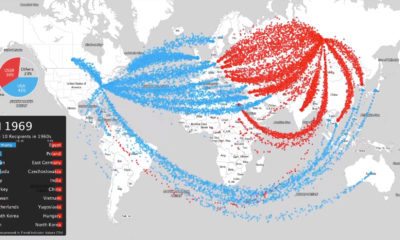
...Today’s animation comes from data scientist Will Geary, and it shows the history of international arms sales originating from the U.S. and the Soviet Union (later...
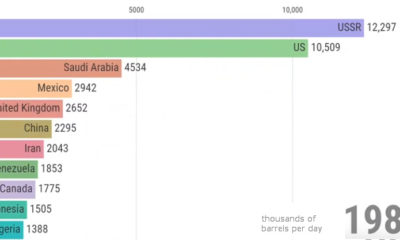
...becoming a footnote on the global stage. Animation: The Changing Oil Landscape Today’s animation shows you how the oil landscape has changed, in terms of production...
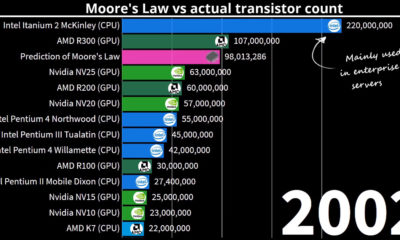
Animation: Visualizing Moore’s Law in Action (1971-2019) The pace of technological progress keeps accelerating. There are many ways to show this, but perhaps the simplest way...
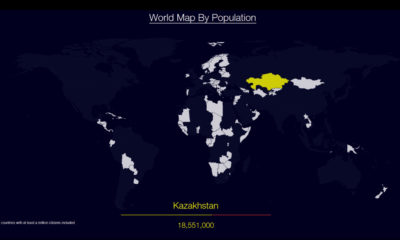
...Scratch In the above animation, countries are added onto the map in sequence — each must have a minimum population of 1 million people — going...
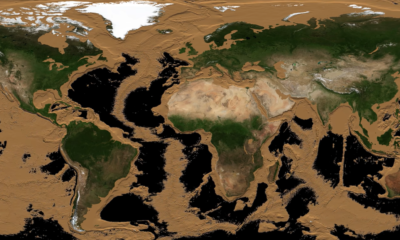
...well-known formations on the ocean floor, but there’s a whole detailed “world” that’s as rich as the surface, just waiting to be explored. This animation from...


 Creator Program