Technology
Visualizing Moore’s Law in Action (1971-2019)
Animation: Visualizing Moore’s Law in Action (1971-2019)
The pace of technological progress keeps accelerating.
There are many ways to show this, but perhaps the simplest way is to create a visual representation of Moore’s Law in action.
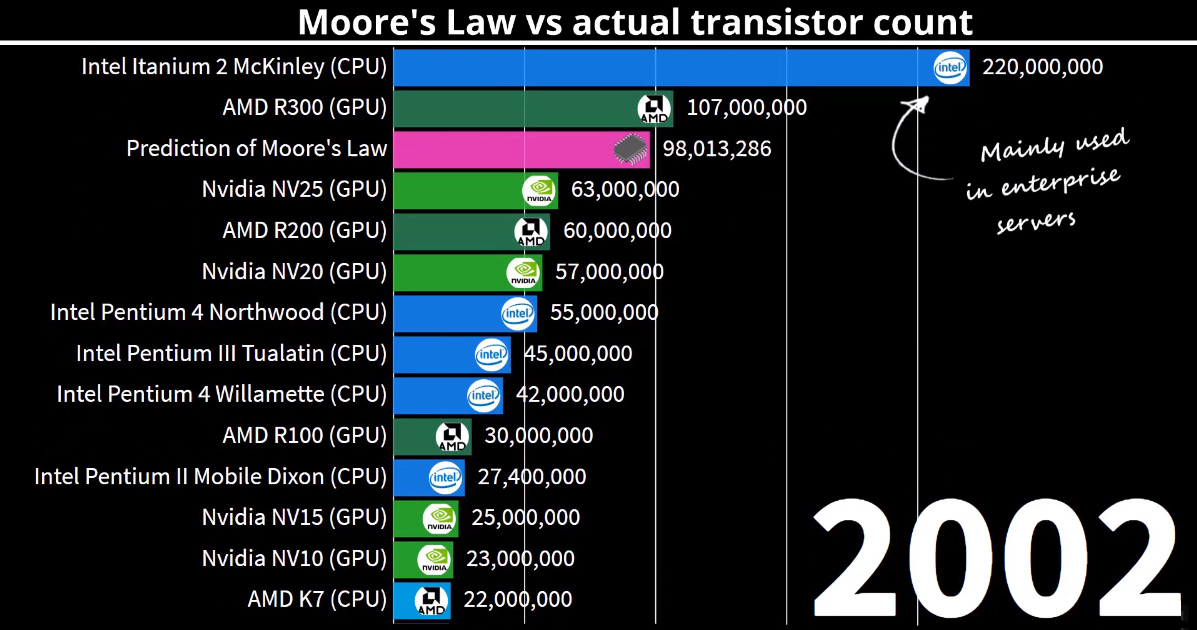
Today’s animation comes to us from DataGrapha, and it compares the predictions of Moore’s Law with data from actual computer chip innovations occurring between 1971 to 2019.
Defining Moore’s Law
Moore’s Law was originally derived from an observation by Gordon Moore, the co-founder of Fairchild Semiconductor and later the co-founder and CEO of Intel.
In 1965, Moore wrote that the number of components in a dense integrated circuit (i.e., transistors, resistors, diodes, or capacitors) had been doubling with every year of research, and he predicted that this would continue for another decade.
Later on in 1975, he revised his prediction to the doubling occurring every two years.
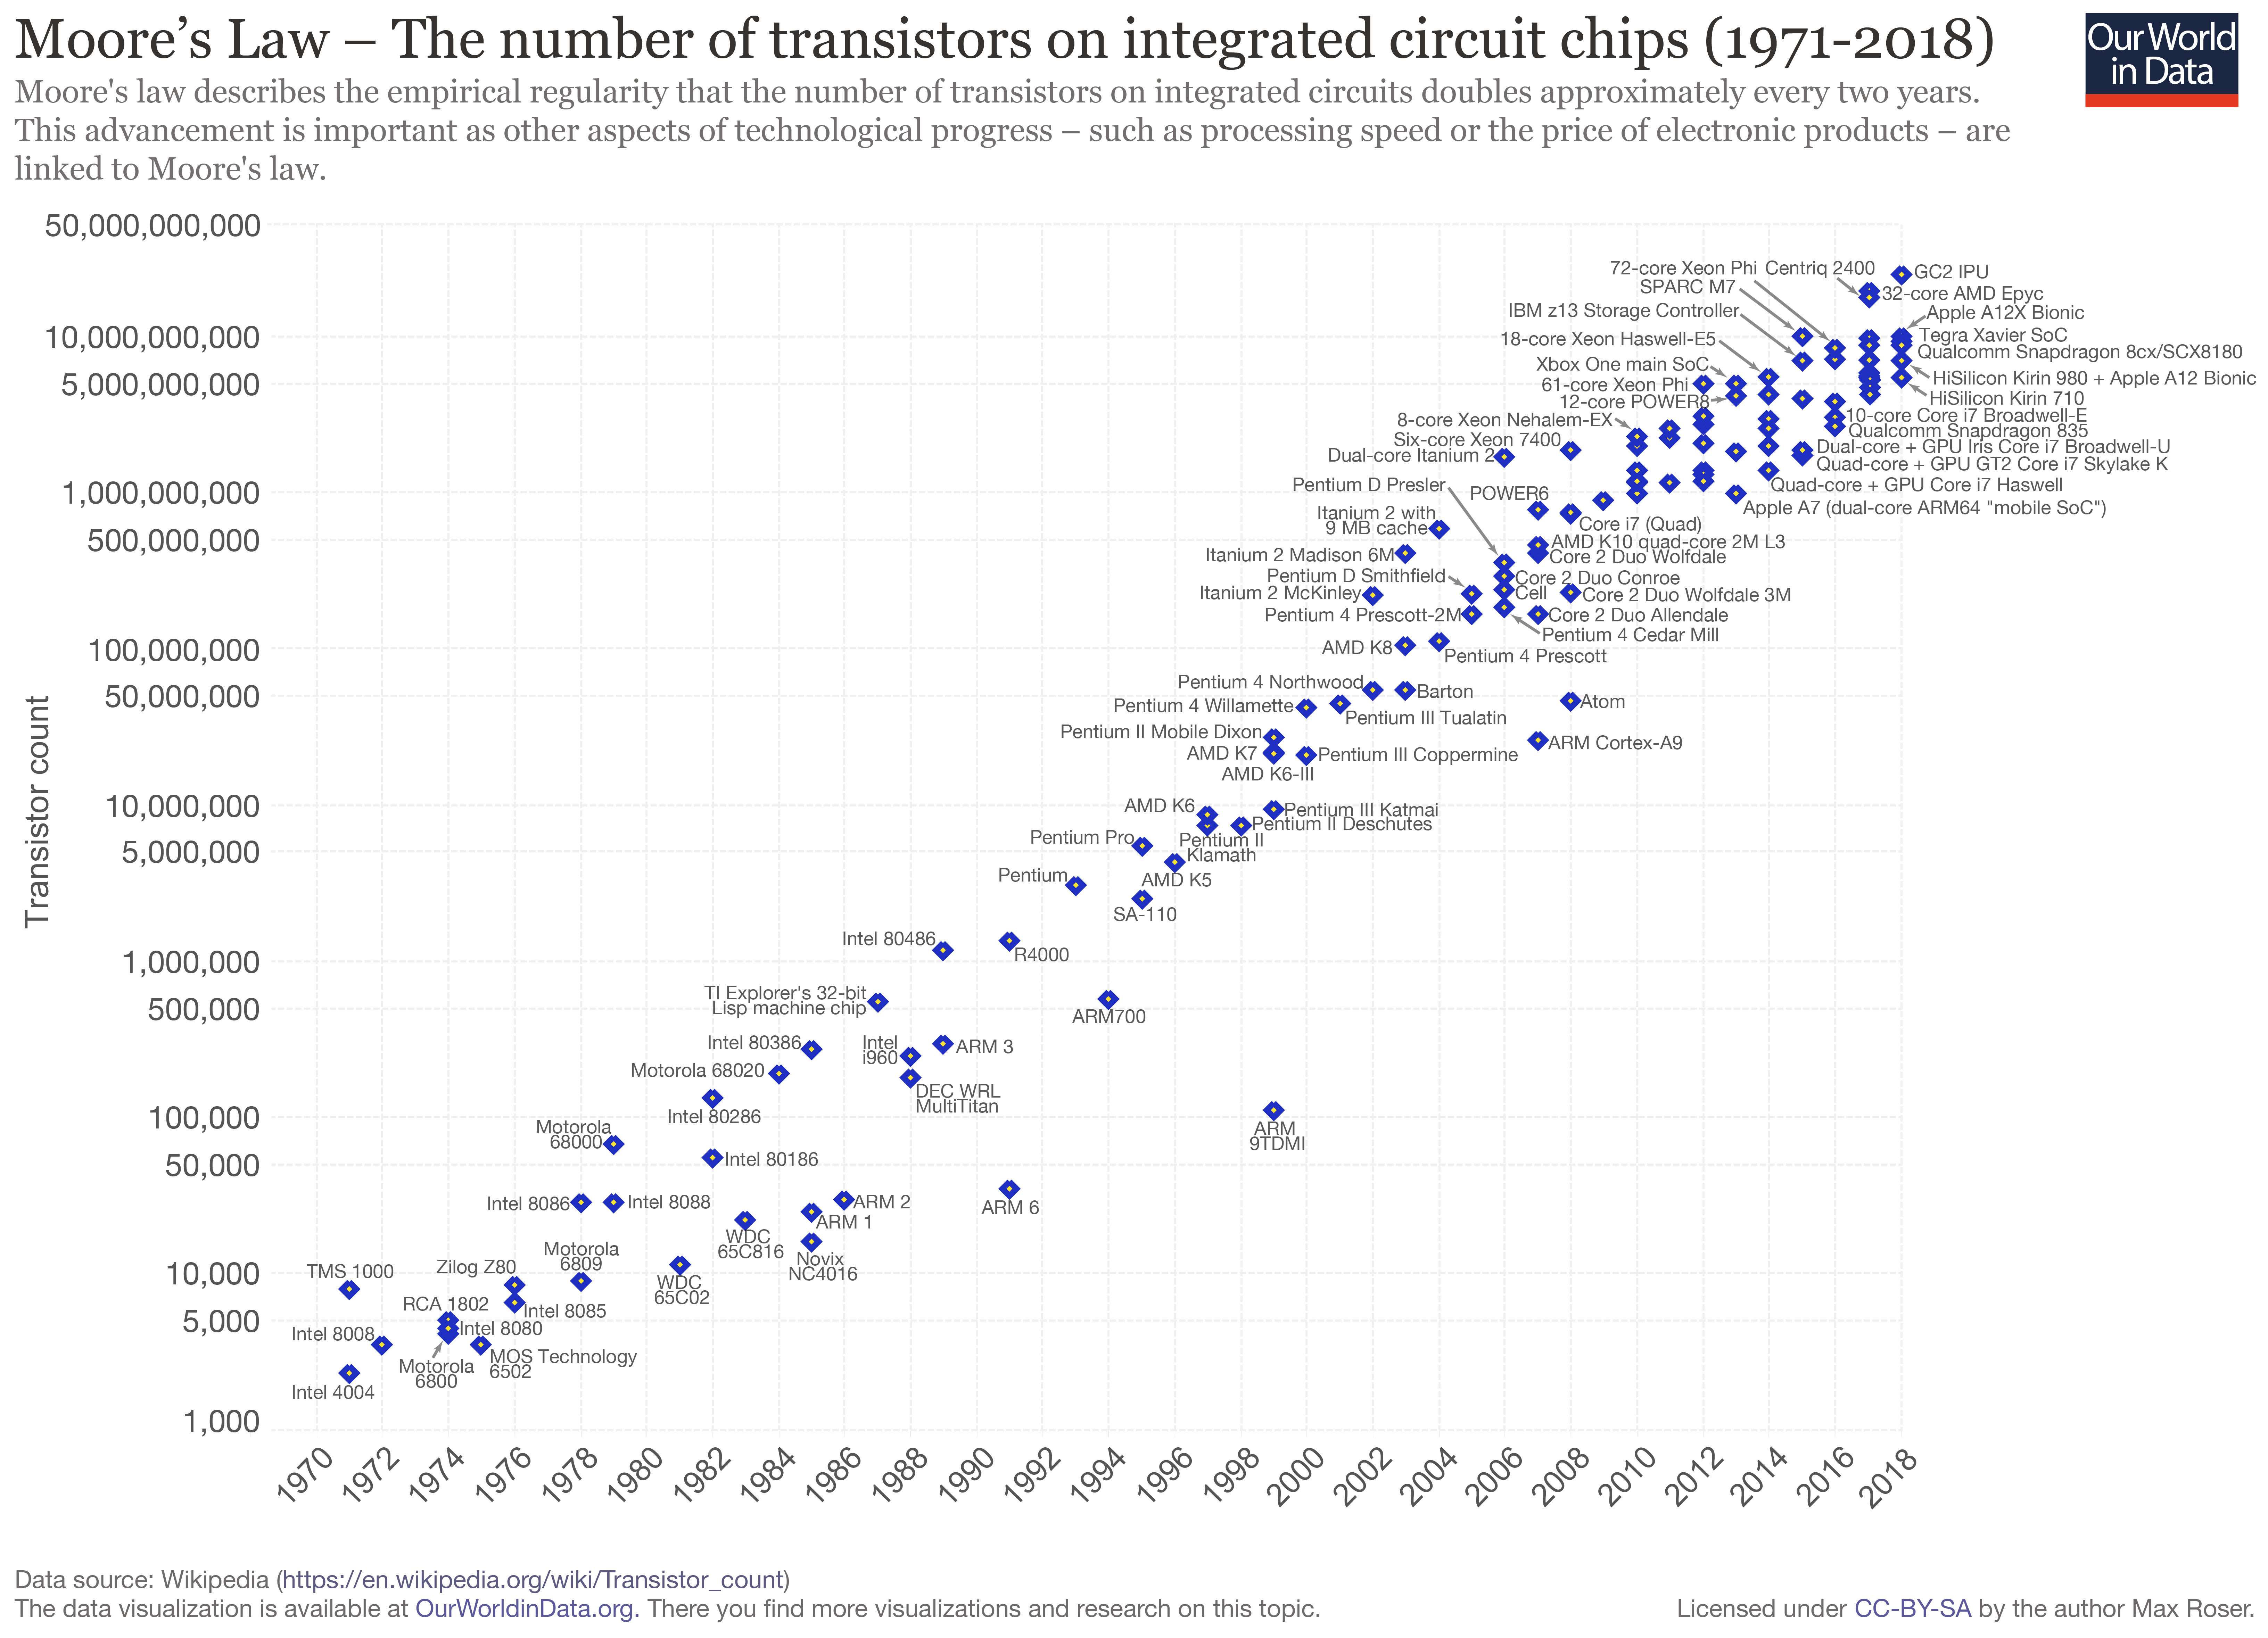
Like the animation, the following chart from Our World in Data helps plot out the predictions of Moore’s Law versus real world data — note that the Y Axis is logarithmic:
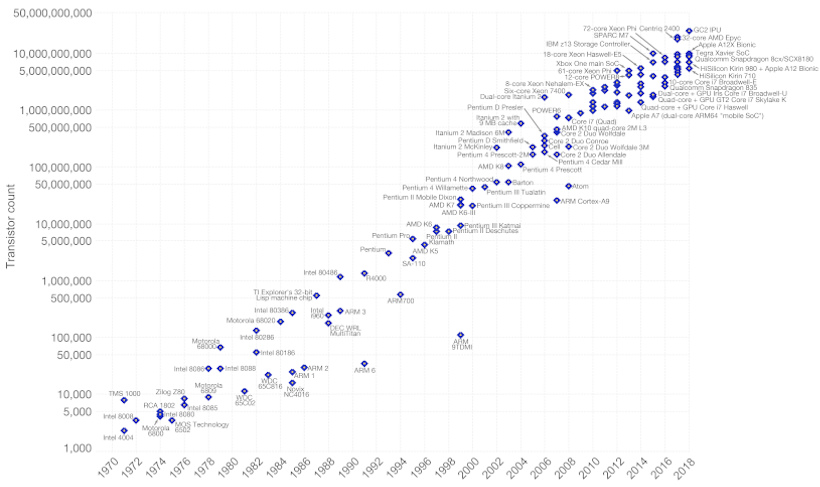
The prophetic prediction of Moore’s Law has led to exponential progress in computing — as well as for everything else touched by computers.
It’s no surprise then, especially given that the modern information age is largely driven by increasingly efficient computing, that this law has had a trickle down effect on nearly every significant aspect of global innovation.
An Accelerated Pace of Change
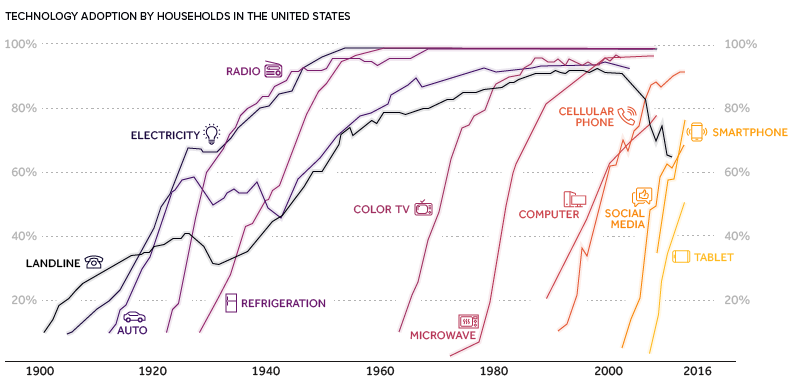
Moore’s Law has translated into a faster rate of change for society as a whole.
A new idea, like the smartphone, can get immediate traction because of instantaneous communication, increased global connectivity, and the ubiquity of information. New tech advancements can now change business or culture in a heartbeat:
Further, since software is a “layer” built upon the foundation of computing, it means that digital products can be replicated at almost no marginal cost. This is why a phenomenon like Pokémon Go was able to captivate 50 million users in just 19 days.
Imagine this kind of scalability, when applied to things like artificial intelligence or virtual reality.
Is Moore’s Law Dead or Alive?
As with any enduring prediction, there are always naysayers out there that will boldly forecast an imminent end to the trend.
Since the 2000s, there has been an ongoing debate within the semiconductor community on whether Moore’s Law will continue its reign, or if progress will ultimately sputter out as certain physical limitations catch up with the process of miniaturization.
Earlier in 2019, Nvidia CEO Jensen Huang declared that Moore’s Law is no longer possible. For what it’s worth, Intel still says technology in chipmaking always finds a way to advance — while TSMC has recently said the law is actually alive and well.
Regardless of who is right, Moore’s Law has held true for close to 50 years, and its repercussions will continue to be felt in almost every aspect of life and society going forward.


Technology
All of the Grants Given by the U.S. CHIPS Act
Intel, TSMC, and more have received billions in subsidies from the U.S. CHIPS Act in 2024.


All of the Grants Given by the U.S. CHIPS Act
This was originally posted on our Voronoi app. Download the app for free on iOS or Android and discover incredible data-driven charts from a variety of trusted sources.
This visualization shows which companies are receiving grants from the U.S. CHIPS Act, as of April 25, 2024. The CHIPS Act is a federal statute signed into law by President Joe Biden that authorizes $280 billion in new funding to boost domestic research and manufacturing of semiconductors.
The grant amounts visualized in this graphic are intended to accelerate the production of semiconductor fabrication plants (fabs) across the United States.
Data and Company Highlights
The figures we used to create this graphic were collected from a variety of public news sources. The Semiconductor Industry Association (SIA) also maintains a tracker for CHIPS Act recipients, though at the time of writing it does not have the latest details for Micron.
| Company | Federal Grant Amount | Anticipated Investment From Company |
|---|---|---|
| 🇺🇸 Intel | $8,500,000,000 | $100,000,000,000 |
| 🇹🇼 TSMC | $6,600,000,000 | $65,000,000,000 |
| 🇰🇷 Samsung | $6,400,000,000 | $45,000,000,000 |
| 🇺🇸 Micron | $6,100,000,000 | $50,000,000,000 |
| 🇺🇸 GlobalFoundries | $1,500,000,000 | $12,000,000,000 |
| 🇺🇸 Microchip | $162,000,000 | N/A |
| 🇬🇧 BAE Systems | $35,000,000 | N/A |
BAE Systems was not included in the graphic due to size limitations
Intel’s Massive Plans
Intel is receiving the largest share of the pie, with $8.5 billion in grants (plus an additional $11 billion in government loans). This grant accounts for 22% of the CHIPS Act’s total subsidies for chip production.
From Intel’s side, the company is expected to invest $100 billion to construct new fabs in Arizona and Ohio, while modernizing and/or expanding existing fabs in Oregon and New Mexico. Intel could also claim another $25 billion in credits through the U.S. Treasury Department’s Investment Tax Credit.
TSMC Expands its U.S. Presence
TSMC, the world’s largest semiconductor foundry company, is receiving a hefty $6.6 billion to construct a new chip plant with three fabs in Arizona. The Taiwanese chipmaker is expected to invest $65 billion into the project.
The plant’s first fab will be up and running in the first half of 2025, leveraging 4 nm (nanometer) technology. According to TrendForce, the other fabs will produce chips on more advanced 3 nm and 2 nm processes.
The Latest Grant Goes to Micron
Micron, the only U.S.-based manufacturer of memory chips, is set to receive $6.1 billion in grants to support its plans of investing $50 billion through 2030. This investment will be used to construct new fabs in Idaho and New York.

-

 Debt1 week ago
How Debt-to-GDP Ratios Have Changed Since 2000
-

 Markets2 weeks ago
Ranked: The World’s Top Flight Routes, by Revenue
-

 Countries2 weeks ago
Population Projections: The World’s 6 Largest Countries in 2075
-

 Markets2 weeks ago
The Top 10 States by Real GDP Growth in 2023
-

 Demographics2 weeks ago
The Smallest Gender Wage Gaps in OECD Countries
-

 United States2 weeks ago
Where U.S. Inflation Hit the Hardest in March 2024
-

 Green2 weeks ago
Top Countries By Forest Growth Since 2001
-

 United States2 weeks ago
Ranked: The Largest U.S. Corporations by Number of Employees