Technology
How Long Does It Take to Hit 50 Million Users?
How Long Does It Take to Hit 50 Million Users?
The Chart of the Week is a weekly Visual Capitalist feature on Fridays.
Imagine it’s the year 1960, and you’re an entrepreneur that’s about to launch the next big thing.
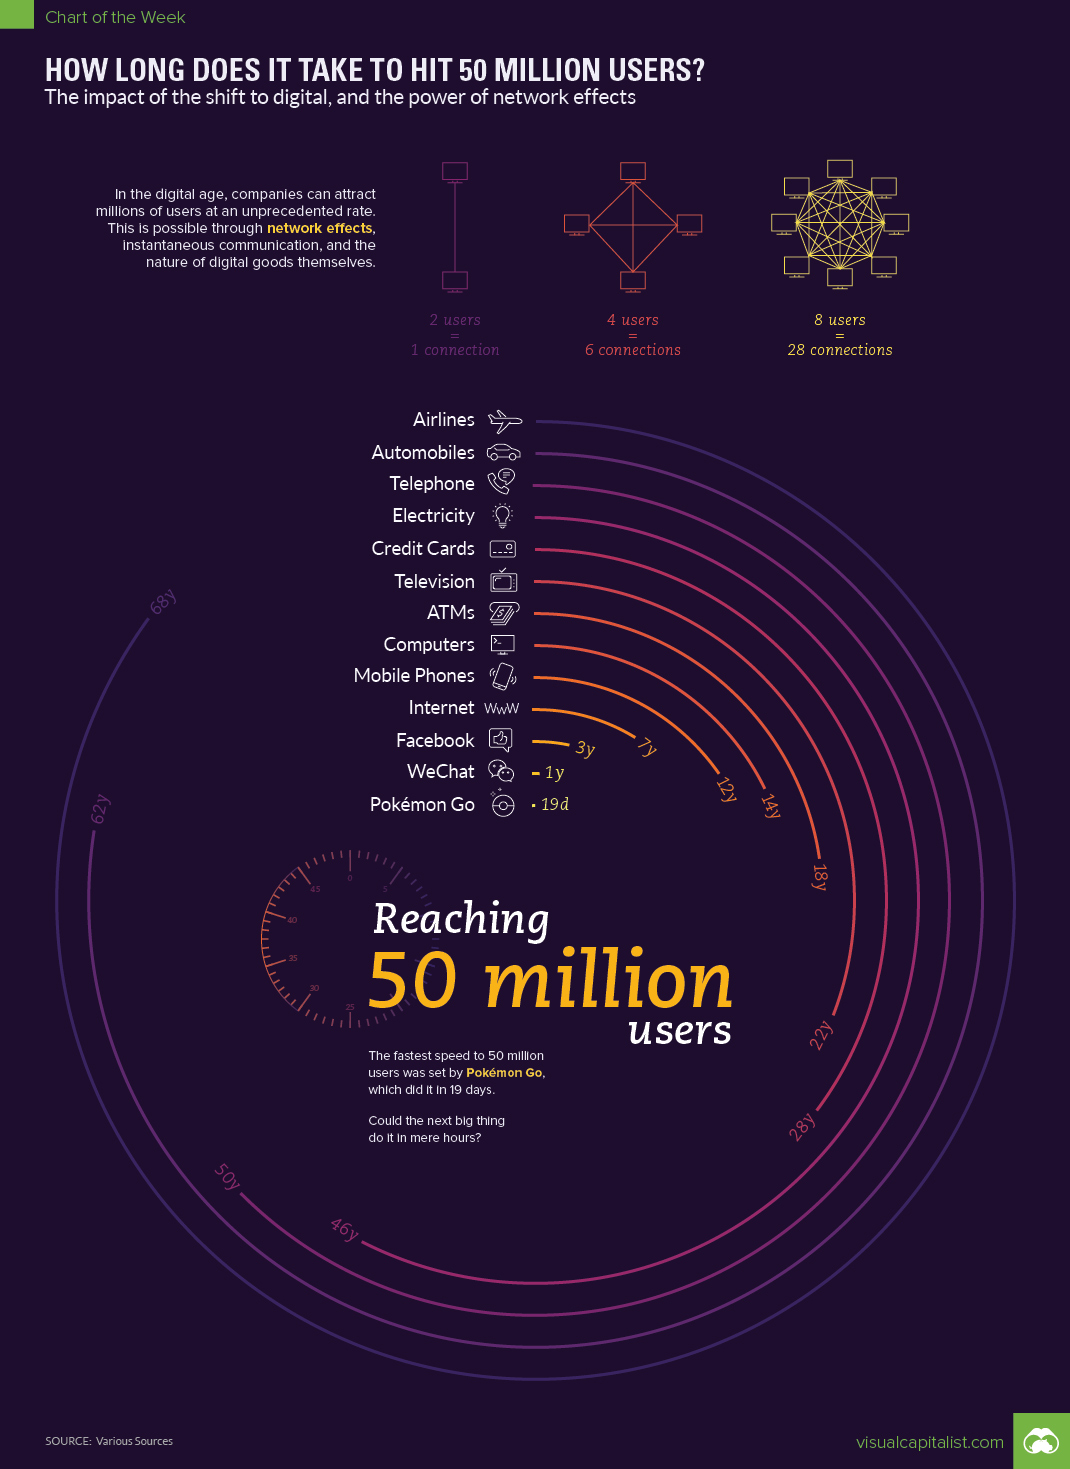
Let’s assume that your product is actually pretty revolutionary, and that you’re going to receive widespread buzz and word-of-mouth traction. How quickly do you think it could be adopted by millions of users?
Before the internet and consumption of digital goods, the use of a product could only spread as fast as you could manufacture the physical good. You would first need many millions of dollars in capital, a plant, a workforce, and inventory. Then, once the product is ready for distribution, you’d need mass advertising, word-of-mouth, sales channels, and press coverage to stand a chance.
Even then, if the product is really revolutionary, you’re looking at a decade or more for it to get widespread adoption.
Atoms Versus Bytes
Automobiles took 62 years to be adopted by 50 million users. The telephone took three years just to be in the homes of 50,000 people.
But these are both physical goods that need raw materials, skilled workers to produce, and economies of scale. They are made of atoms – and atoms must abide by the laws of physics.
In the modern era, you don’t have to produce a physical good. All you need to do is produce a useful piece of code that be replicated or re-used indefinitely at a marginal cost near zero, and it can spread like a wildfire.
| Product / Technology | Time it Took to Hit 50 Million Users |
|---|---|
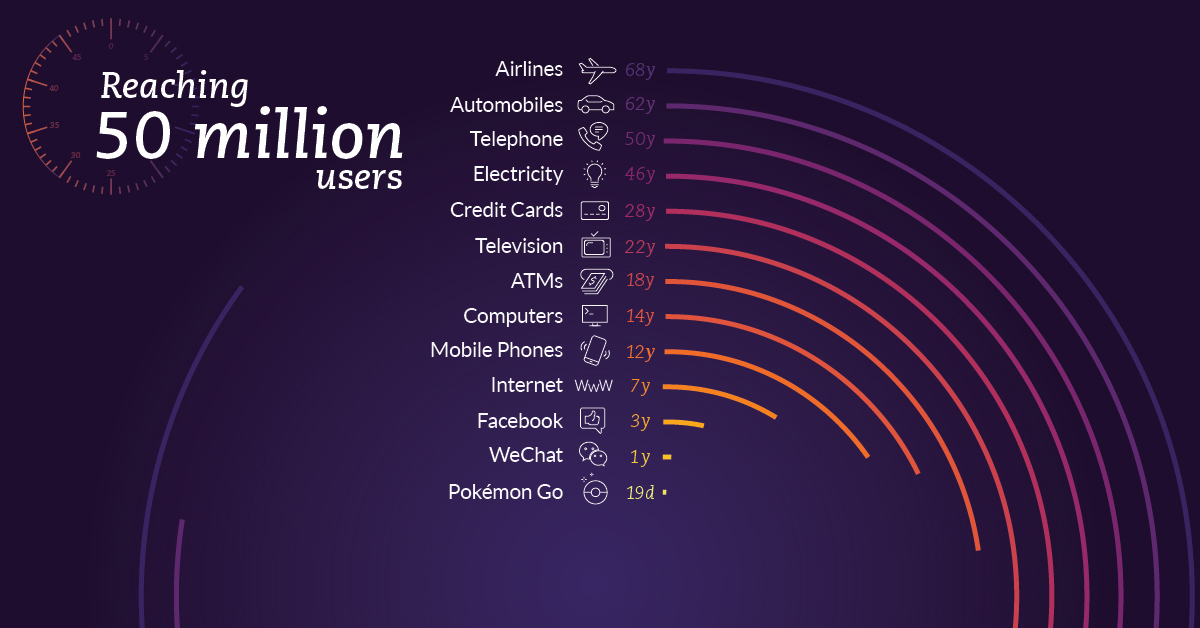
| Airlines | 64 years |
| Automobiles | 62 years |
| Telephone | 50 years |
| Electricity | 46 years |
| Credit Cards | 28 years |
| Television | 22 years |
| ATMs | 18 years |
| Computers | 14 years |
| Mobile Phones | 12 years |
| Internet | 7 years |
| 4 years | |
| 1 year | |
| Pokemon Go | 19 days |
As you can see, the transition from physical to digital goods has affected adoption rates, but so has the growing power of network effects.
Metcalfe’s Law
Metcalfe’s Law states the effect of a network is proportional to the square of the number of connected users of the system (n2).
Within the context above, it simply means that each additional user of a good or service adds additional value to others in that network. New goods or services in the digital realm can harness this network effect to gain users at unprecedented rates. It’s why social media, apps, and the internet were able to take off so quick.
It’s also why the augmented reality game Pokémon Go was able to reach a mind-blowing 50 million users in just 19 days.
And now, with unparalleled connectivity and more than four billion internet users globally, the next big thing could hit that milestone even faster than Pokémon Go. Instead of almost three weeks, it might do so in a few days – or even a few hours.


Technology
All of the Grants Given by the U.S. CHIPS Act
Intel, TSMC, and more have received billions in subsidies from the U.S. CHIPS Act in 2024.


All of the Grants Given by the U.S. CHIPS Act
This was originally posted on our Voronoi app. Download the app for free on iOS or Android and discover incredible data-driven charts from a variety of trusted sources.
This visualization shows which companies are receiving grants from the U.S. CHIPS Act, as of April 25, 2024. The CHIPS Act is a federal statute signed into law by President Joe Biden that authorizes $280 billion in new funding to boost domestic research and manufacturing of semiconductors.
The grant amounts visualized in this graphic are intended to accelerate the production of semiconductor fabrication plants (fabs) across the United States.
Data and Company Highlights
The figures we used to create this graphic were collected from a variety of public news sources. The Semiconductor Industry Association (SIA) also maintains a tracker for CHIPS Act recipients, though at the time of writing it does not have the latest details for Micron.
| Company | Federal Grant Amount | Anticipated Investment From Company |
|---|---|---|
| 🇺🇸 Intel | $8,500,000,000 | $100,000,000,000 |
| 🇹🇼 TSMC | $6,600,000,000 | $65,000,000,000 |
| 🇰🇷 Samsung | $6,400,000,000 | $45,000,000,000 |
| 🇺🇸 Micron | $6,100,000,000 | $50,000,000,000 |
| 🇺🇸 GlobalFoundries | $1,500,000,000 | $12,000,000,000 |
| 🇺🇸 Microchip | $162,000,000 | N/A |
| 🇬🇧 BAE Systems | $35,000,000 | N/A |
BAE Systems was not included in the graphic due to size limitations
Intel’s Massive Plans
Intel is receiving the largest share of the pie, with $8.5 billion in grants (plus an additional $11 billion in government loans). This grant accounts for 22% of the CHIPS Act’s total subsidies for chip production.
From Intel’s side, the company is expected to invest $100 billion to construct new fabs in Arizona and Ohio, while modernizing and/or expanding existing fabs in Oregon and New Mexico. Intel could also claim another $25 billion in credits through the U.S. Treasury Department’s Investment Tax Credit.
TSMC Expands its U.S. Presence
TSMC, the world’s largest semiconductor foundry company, is receiving a hefty $6.6 billion to construct a new chip plant with three fabs in Arizona. The Taiwanese chipmaker is expected to invest $65 billion into the project.
The plant’s first fab will be up and running in the first half of 2025, leveraging 4 nm (nanometer) technology. According to TrendForce, the other fabs will produce chips on more advanced 3 nm and 2 nm processes.
The Latest Grant Goes to Micron
Micron, the only U.S.-based manufacturer of memory chips, is set to receive $6.1 billion in grants to support its plans of investing $50 billion through 2030. This investment will be used to construct new fabs in Idaho and New York.

-

 Education1 week ago
How Hard Is It to Get Into an Ivy League School?
-

 Technology2 weeks ago
Ranked: Semiconductor Companies by Industry Revenue Share
-

 Markets2 weeks ago
Ranked: The World’s Top Flight Routes, by Revenue
-

 Demographics2 weeks ago
Population Projections: The World’s 6 Largest Countries in 2075
-

 Markets2 weeks ago
The Top 10 States by Real GDP Growth in 2023
-

 Demographics2 weeks ago
The Smallest Gender Wage Gaps in OECD Countries
-

 Economy2 weeks ago
Where U.S. Inflation Hit the Hardest in March 2024
-

 Green2 weeks ago
Top Countries By Forest Growth Since 2001